

Abstract
Mass spectrometry imaging (MSI) allows for untargeted mapping of the chemical compositions of tissues with attomole detection limits. MSI using Fourier transform (FT)-based mass spectrometers, such as FT-ion cyclotron resonance (FT-ICR), grants the ability to examine the chemical space with unmatched mass resolution and mass accuracy. However, direct imaging of large tissue samples using FT-ICR is slow. In this work, we present an approach that combines the subspace modeling of ICR temporal signals with compressed sensing to accelerate high-resolution FT-ICR MSI. A joint subspace and spatial sparsity constrained model computationally reconstructs high-resolution MSI data from the sparsely sampled transients with reduced duration, allowing a significant reduction in imaging time. Simulation studies and experimental implementation of the proposed method in investigation of brain tissues demonstrate a 10-fold enhancement in throughput of FT-ICR MSI, without the need for instrumental or hardware modifications.
Keywords: compressed sensing, subspace imaging, fast acquisition, mass spectrometry imaging
Graphical Abstract

Fast mass spectrometry imaging: A computational imaging method that integrates compressed sensing and subspace modeling enables high-throughput mass spectrometry imaging (MSI) using Fourier transform- mass spectrometry (FTMS) of large tissue sections. The proposed method allows faithful reconstruction of high-dimensional FTMS MSI data while providing substantial improvement for the imaging speed.
Introduction
Mass spectrometry imaging (MSI) allows for label-free spatially-resolved molecular mapping of biological tissues with exceptional sensitivity and specificity.1–3 Particularly, Fourier transform-mass spectrometry (FTMS) offers superb mass resolution desirable for resolving and identifying the molecular contents in chemically complex samples.4,5 Atmospheric pressure (AP) matrix-assisted laser desorption/ionization (MALDI) MSI coupled with an Orbitrap was reported to achieve 1.4 μm lateral resolution and ~2 ppm mass accuracy, demonstrating the possibility of high-mass accuracy imaging at the subcellular level.6 A 21T FT-ICR mass spectrometer was used in an MSI experiment and resolved lipid signals with a molecular mass difference of 1.79 mDa.7 Despite these significant achievements, a major bottleneck for MSI on FTMS (either on Orbitrap or FT-ICR) is the limited throughput due to the long transient acquisition time needed to resolve isobaric compounds often present in complex biochemical systems, and hundreds of thousands of acquisitions required for large-scale tissue imaging. An image with 1s transients can easily take up to 24 h to acquire. The low throughput poses major limits on FTMS MSI experiment designs, especially for high lateral resolution imaging (e.g. for subcellular level details), volumetric imaging (large number of serial slices), and in clinical biopsy MSI. Although faster speeds can be achieved by several recent hardware developments,8–11 imaging acceleration often requires highly customized instrumentation that is not easily accessible. Alternatively, conventional time-of-flight (ToF) MS can provide higher throughput, but does not reach the mass resolution provided by FTMS for more precise compound identification and chemical coverage.
Computational imaging has played transformative roles in improving the throughput of various imaging modalities. With the unique data complexity and data dimensionality brought by the high-mass resolution FT-ICR instrument, there is tremendous potential for leveraging computational strategies to address the limitations in throughput for high-mass resolution MSI experiments. Absorption mode FT has been applied to MSI to achieve improved mass resolution over standard FT on the same data.12 Targeted least-squares fitting for selected m/z features (cyclotron frequencies) has been used to achieve spectral super-resolution compared to conventional Fourier transform analyses from transients acquired at reduced durations.13 A phase spectrum deconvolution method was proposed to enhance the resolution several times higher than standard FT.14 Hence, transients with the reduced duration can be collected for improved throughput without sacrificing the mass resolution. Subspace imaging has recently been adapted to accelerate FT-ICR MSI by enabling efficient reconstruction of high-resolution mass spectra from short transients (short-time acquisition) in an untargeted and data-driven fashion.15 However, as the transient acquisition time per pixel decreases, the measurement overhead (e.g., stage movement, laser firing and ion accumulation) becomes dominant and starts to limit the achievable acceleration when scanning through all the pixels on the tissue surface is still required. Furthermore, the pixel-by-pixel subspace fitting strategy does not incorporate prior spatial information and can be sensitive to noise and inaccuracy of the subspace estimation.
Here, we demonstrate a novel computational high-dimensional data recovery method that integrates compressed sensing (CS) with subspace modeling to significantly enhance the throughput of the FT-MSI experiment by 10-fold. CS has proven successful in a variety of imaging applications allowing image reconstruction from sparsely sampled data.16–20 Early attempts to apply CS to MSI focused on spatial image recovery from sparsely sampled pixels for ToF MSI.21,22 These methods demonstrated potential in only simulated settings, and have not taken full advantage of the spatio-temporal signal characteristics of high-dimensional FT-MSI data. Nonuniform sampling with CS reconstruction has been proposed for 2D FT-ICR MS, which is not applicable to imaging data.23 Our proposed method integrates spatial sparse sampling in addition to the reduced transient duration sampling offered by subspace imaging. The synergy of the two allows us to significantly reduce the total FT-MSI acquisition time and enable computational reconstruction of the full mass spectral profiles of large tissue sections, without sacrificing lateral and mass resolution. A novel simulated design and FT-MSI experiments have been conducted to demonstrate the performance and implementation of the proposed method.
Methods
Highly accelerated FT-MSI through integrative compressed sensing and subspace imaging.
Two major factors limit the throughput of high-resolution FT-MSI: (1) the need to acquire transients with long transient durations to achieve high mass resolution and, (2) the need to raster the laser across many pixels to achieve high lateral resolution over a significant tissue area. We propose to sparsely sample data in the spatial and temporal domains to accelerate the MSI acquisition speed. Specifically, we randomly scan only a fraction of pixel locations and only acquire transients with the reduced duration at the sampled locations to minimize the signal acquisition time. This sparse sampling strategy led to a multiplicative acceleration effect also with reduced measurement overhead due to the smaller number of pixels scanned (Figure 1A). The design of spatial sparse sampling is motivated by the compressed sensing theory for recovering images from randomly sampled pixels,24,25 and the reduced transient acquisition is enabled by a subspace model for the high-dimensional FT-MSI data (described below). A direct reconstruction from the reduced data generated by this accelerated acquisition, i.e., using standard interpolation in the spatial dimensions and Fourier transform along the transient dimension, produced ion images lacking informative spatial structures and mass spectra with low resolution.
Figure 1.
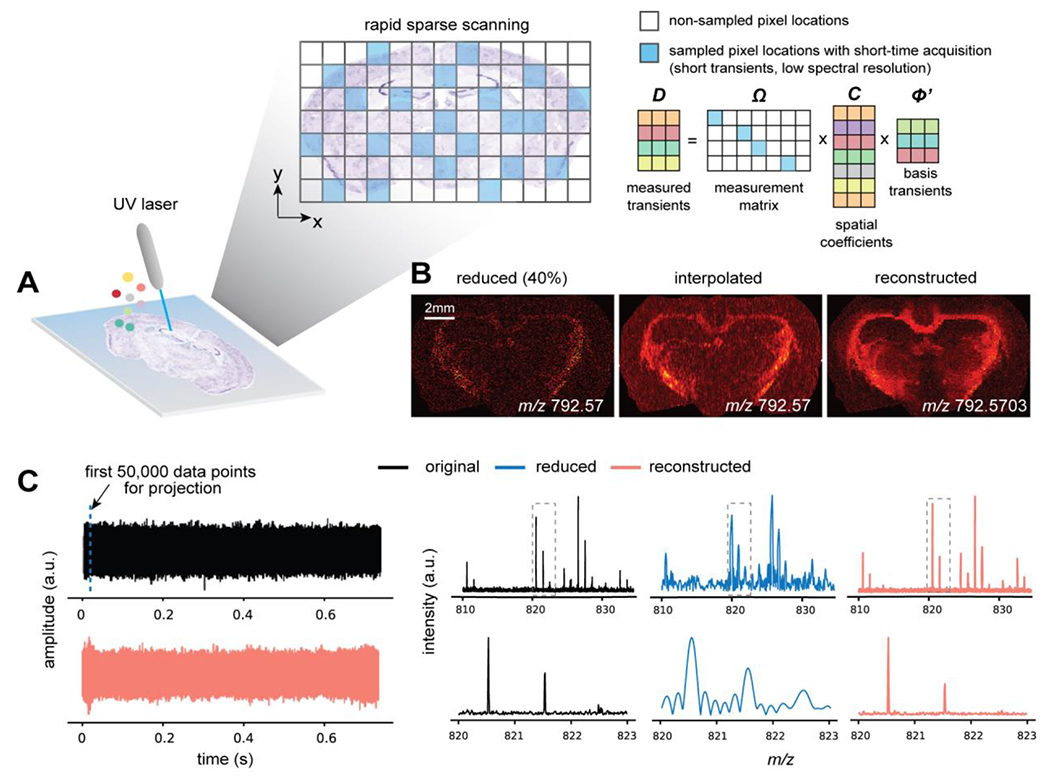
Overview of the proposed approach for enhanced throughput FT-ICR MSI. (A) An illustration of the rapid scanning strategy integrating both the compressed sensing based spatial sparse sampling and the subspace model based short-time acquisition. The data matrix, D, contains collected transients with much fewer temporal points per transient than standard acquisition, at randomly sampled pixel locations (corresponding to different color shadings) defined by the measurement matrix (blue grids are 1 and white grids are 0). With the predetermined basis transient in Φ, the reconstruction of entire high-resolution MSI dataset is defined as estimating the much lower-dimensional spatial coefficients given the sparsely measured data in D. (B) An ion image (left) directly formed from a sparsely sampled dataset (40% pixels) provides limited interpretation about the tissue morphological features and the spatial distributions of molecules (unsampled pixels filled with zeros). The reconstructed ion image (right) effectively recovers tissue features with a much higher mass accuracy for the corresponding ion signal than the simple linear interpolation of the sparse ion image (middle). (C) An original transient (top left) and its reconstructed transient (bottom left) by fitting the first 50,000 data points to the subspace spanned by a set of basis transients. The original and reconstructed mass spectra exhibit highly similar mass spectral profiles and consistent intensity levels, while the mass spectra obtained from a direct Fourier transform of the first 50,000 data points alone with zero-filling have poor spectral quality and strong artifact.
Our proposed computational reconstruction method integrates a subspace model and CS-based sparse regularization to recover the FT-MSI data with both high lateral resolution and high mass resolution from sparsely sampled data. We modeled the underlying high-dimensional MSI data using a subspace representation ρ = CΦ, in which Φ is a low-rank matrix containing basis transients whose linear combination accurately approximates the desired long transient (with rank L ≪ dimensions of ρ) and C is also a rank L matrix containing pixel-dependent spatial coefficients.15 The basis transients can be estimated through singular value decomposition (SVD) on a small set of long transients acquired with the desired mass resolution, either within the same tissue section being imaged or from an adjacent tissue section so that the chemical variation between differing tissue types is adequately accounted for. With the subspace model, the problem of recovering the long transient is transformed into estimating the much lower-dimensional pixel-dependent spatial coefficients with the pre-determined Φ (Figure 1C). The transients with short duration contain information about all the frequency components (all the ions) and only yield low mass-resolution spectra because of using the Fourier transform directly. Here, the basis transients determine the reconstructed mass resolution, which is the same as long transient data (e.g. high-resolution mass spectra), thus achieving the target mass resolution with a minimal loss of spectral fidelity (Figure 1C). More details on subspace model can be found in the Supporting Information and Ref. 13. While effective with spatially fully sampled data, the original pixel-by-pixel subspace fitting is not applicable to spatial sparse sampling. Therefore, we developed an integrated subspace and sparsity model-based strategy to jointly reconstruct high-resolution mass spectra for all the pixels. More specifically, the entire reduced data D can be related to the subspace model through an underdetermined linear system D = ΩCΦ (Figure 1A) with the measurement matrix Ω describing the spatio-temporal sampling process (see Supporting Information for formulation details) and the coefficients matrix C being the unknown, which has a much lower degrees-of-freedom than ρ.26,27 We then exploit the spatial sparsity constraint complementary to the subspace model, formulating the coefficient estimation as the following ℓ1-regularized reconstruction problem:
| eq.(1) |
The first term enforces data consistency, and the second term encourages a sparse solution in the transform domain. We used wavelet transform operator W as the sparsifying transform to demonstrate the concept, although more sophisticated transforms could also be used to further enhance performance. MT is the image formation operator to map individual pixels to their two-dimensional spatial coordinates (accounting for how the MSI scan is performed), and Φ′ is a temporally truncated basis transient matrix from Φ (details in the Supporting Information). We solved the optimization problem in eq.(1) using the alternating direction method of multipliers (ADMM),28 algorithmic details in the Supporting Information. Ion images produced from our reconstruction method exhibit improved quality and mass accuracy than a simple linear interpolation of the sparse ion image (Figure 1B). Our method faithfully reconstructed the original high-resolution mass spectra with only a small portion of the temporal transients using the subspace representation, whereas direct Fourier transform of the reduced temporal signal (zero filled to the length of the long transient) produces much degraded spectral quality (Figure 1C). Note that without spatial sparse sampling, our approach becomes a spatially regularized joint-subspace fitting of all sampled pixels simultaneously, which offers improved robustness to noise and subspace estimation error compared to the original pixel-by-pixel fitting. A general workflow is provided in Figure S1.
A novel FT-MSI simulation design.
We have developed a computational simulation framework of FT-ICR MSI data to allow quantitative validation of the proposed method. The simulated imaging dataset contains a collection of transients that are synthesized based on a list of chemical formulas and arranged in a spatial pattern mimicking a rat brain sagittal section. We simulated each transient by following the generic ICR signal model proposed by Marshall29,30:
| (1) |
For ion i, Ai is the constant that represents the initial signal amplitude, τi is the decay rate of the excited ICR signal due to ion collisions, and ωi is the ion cyclotron frequency. The decay rate was set to 0.9 for the simulation. Starting with the list of 30 chemical formulas, we reverse calculated the cyclotron frequencies for all possible ions generated (refer Table S1 for the full list). H+, Na+, and K+ adducts were assigned to each formula, and theoretical isotopic distributions (3 isotopic peaks with charge=1 for each possible adduct) were calculated using the Python implementation of the BRAIN algorithm (brainpy),31 which resulted in hundreds of m/z features in the simulated dataset. To generate realistically looking ion images, we took the Allen Brain Atlas (ABA) mouse brain annotation as the spatial reference,32 which was then partitioned into 8 spatial substructures (Figure S2). For each substructure, we simulated the transients by taking 15 shared chemical formulas plus five randomly selected ones from the list. Of each transient, we obtained Ai’s by sampling from Gaussian distributions with the mean values specific to every substructure. Those parameters were then multiplied by the corresponding isotopic ratios, resulting in the final signal amplitude parameters Ai. All transients were of a uniform length with 262,144 data points. White Gaussian noise was added to each transient to generate the noisy dataset.
Performance evaluation and implementation details.
The quantitative model performance evaluation can be achieved by generating the sparse and low-resolution data from the reference fully sampled high-resolution data. This allows direct comparison of the reconstructed data with the original reference. When using the simulated datasets, we treated the clean data (full-length transients without noise) as the ground truth. To assess the effect of noise on the basis transients and the reconstruction quality, we also simulated a dataset with Gaussian white noise added. Two sets of basis transients were extracted from both datasets, denoted as the clean basis and noisy basis. A rank of 10 was used for basis extraction from 1000 randomly sampled clean or noisy transients. We truncated transients in the simulated noisy FT-ICR MSI dataset to keep the first 50,000 points (5% temporal points), and applied 30, 60, 80, and 100% sample rates for sparse (or non-sparse) measurements to mimic the sparse sampling with short-time acquisition. These truncated and sparsely sampled noisy transients were then subjected to reconstruction using our proposed algorithm. Since the ion signals were known in the simulated dataset, we only compared the images formed at their corresponding m/z values for the ground truth and the reconstructed data. Pearson correlation coefficients were used as the metric to evaluate the spatial consistency for each pair of image vectors in comparison, and spectral consistency for each pair of pixels (or spectra). We also performed evaluations using experimental FT-ICR data from rat brain tissue sections. Fully sampled high-resolution FT-ICR data were first acquired and retrospectively sparsely sampled. A rank of 50 was used to estimate the basis from 4000 randomly sampled transients from the dataset. We truncated the original long transients by keeping the first 5% points of each transient. Unlike the simulation, the ground truth for the experimental data was unknown, so we utilized peak picking on the average mass spectrum of the fully sampled high-resolution dataset to provide a list of m/z peaks as our reference. Ion images were formed via the list of m/z values for the original and the reconstructed datasets. The rest of the evaluation steps were identical to those applied to the simulated data. We have also implemented the proposed sparse sampling strategy in actual experimental settings on a 7T FT-ICR mass spectrometer and acquired data with different sampling rates. Different sampling settings were employed (similar to the simulation) with a reduced transient duration and various sampling rates to evaluate the reconstruction quality and performance. Details on the sampling can be found in the Supporting Information. The reconstruction was done on raw transients, and the mass spectra were obtained from apodized transients using hamming window, followed by magnitude mode FT. Our acquisition method generates raw data for substantially less storage space and memory requirement, allowing offline reconstruction and parallel processing with standard computing resource. All computational experiments were conducted with an Intel i7-8700K CPU and 64 GBs RAM.
Results and discussion
Quantitative evaluation using simulated FT-MSI data.
Noisy FT-ICR MSI transient data were generated using the proposed simulation framework (Figure S3), with various sampling schemes for reconstruction validation. A set of representative results from the reduced noisy data with only 60% pixels sampled and only 5% of the original transient length is shown in Figure 2. Direct Fourier transform of the reduced noisy data yielded low mass resolution (Figure 2A, left). The proposed method produced enriched spectral features due to a higher mass resolution by fitting the basis transients extracted from the noisy dataset (Figure 2A, right). Representative ion images from the ground truth data, the reduced noisy data, and the reconstructed data (by the proposed method) with a 60% sampling rate were compared (Figure 2B). The reduced noisy data alone resulted in poor image and spectral quality, while the proposed method achieved high spatial and spectral fidelity compared to the ground truth. (Figure 2B, C). Pearson correlation coefficients between all pairs of noiseless reference ion images and the reconstructed ion images from the proposed method as well as the mass spectra at various sampling rates were computed to further quantitatively evaluate the reconstruction. The proposed method achieved excellent consistency with the ground truth and provided significant improvement over the standard reconstruction approach using the direct Fourier transform (see correlation coefficient r in Figure 2C; Figure S4). Ion images can still be accurately reconstructed with a 30% sampling rate, indicated by the strong spatial correlation with the ground truth. Comparing the reconstructed ion images, we noticed a slight overfitting when the noisy basis was used versus the clean basis for reconstruction, which highlights the importance of accurate basis estimation for practical experimental data (Figure S5; Figure S6). More accurate basis can be potentially obtained by multiple scans then averaging per pixel for higher signal-to-noise ratios (SNRs).
Figure 2.
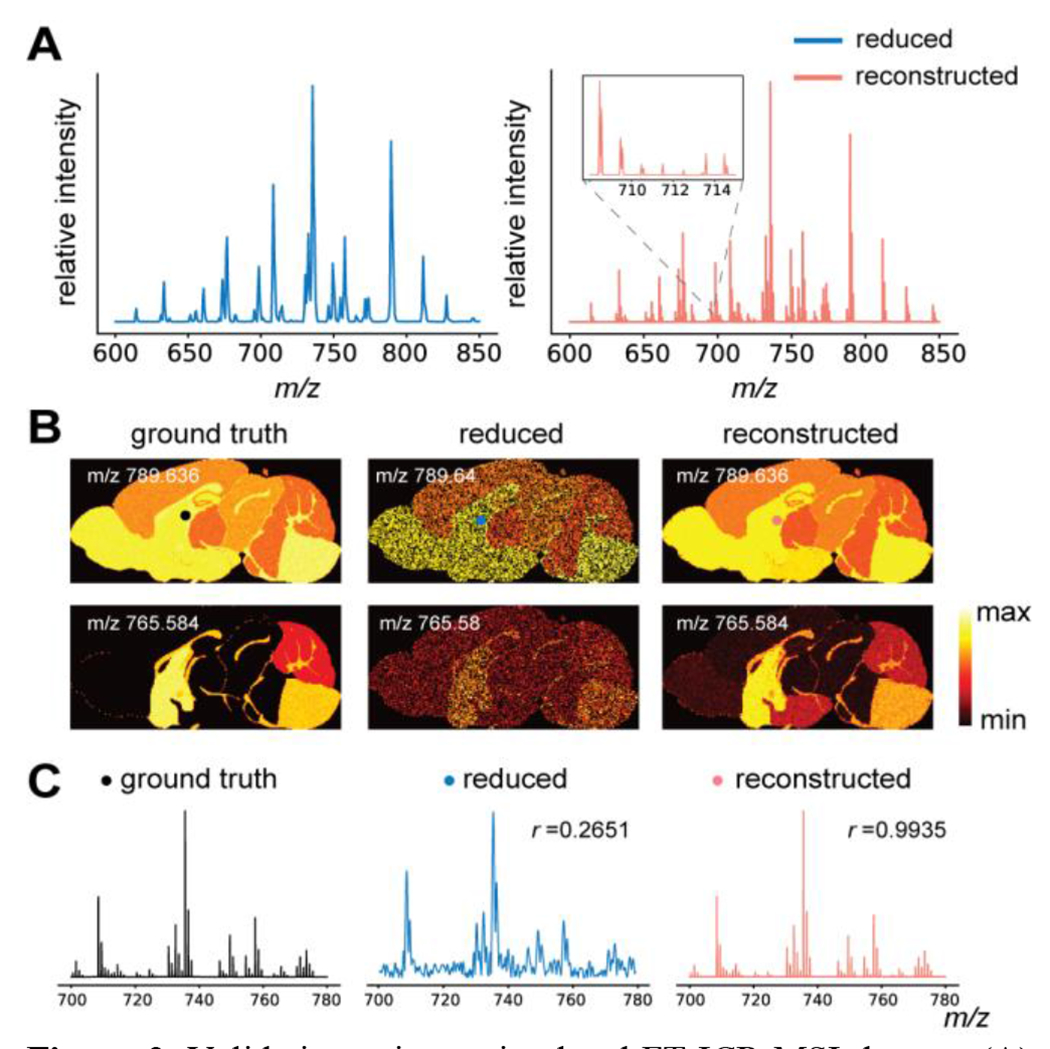
Validation using a simulated FT-ICR MSI dataset. (A) Average mass spectra of the reduced noisy data (left, 60% pixels sampled at a 5% transient duration) and the reconstruction (right) from the same reduced data. Spectral features with close m/z values that cannot be resolved by direct Fourier-transform were successfully resolved after the proposed reconstruction (inset). (B) Representative ion images from the ground truth, the reduced noisy data, and the proposed reconstruction for two simulated ions. (C) Individual mass spectra of the ground truth, the reduced noisy data, and the reconstructed data from a selected pixel location (marked in the ion images). Pearson correlation coefficients were calculated to quantitatively evaluate the fidelity of the different methods using a ground truth mass spectrum as the standard for comparison. Spectra shown were not from transients used to estimate the basis.
Experimental evaluation through retrospective sparse sampling of high-resolution FT-MSI data.
Next, the capability of our approach was demonstrated through retrospective sparse sampling of experimentally acquired fully sampled high-resolution MALDI FT-MSI data of rat brain sections acquired using a 7T FT-ICR mass spectrometer. We followed a similar reconstruction evaluation procedure used on the simulated dataset by first mimicking the sparse sampling and short-time acquisition for the reduced data, which were then reconstructed by our model. The basis transients were estimated from a subset of long transients (4000 in total) randomly sampled from a subset of pixel locations (see Methods). The model exploits the spatio-temporal redundancy to reconstruct the whole intensity profiles of the mass spectra in both sampled and non-sampled (missing) pixel locations rather than one ion image at a time (a key difference from the standard CS-based reconstruction and enabled by the subspace model). The spectral features, including isotopic distributions and ratios, were reconstructed with high fidelity compared to the reference spectra from the full dataset (Figure 3A). Considerable noise reduction (10 times lower standard deviation of the noise) was observed due to the low-rank approximation of transients and excellent preservation of low-intensity peaks. The mass resolution of the reconstructed mass spectra was consistent with the reference mass spectra (mass resolution R = 63,357 for the peak at m/z 832.6497), shown on the right of Figure 3A. The proposed reconstruction from reduced data resolved isotopic peaks which were completely indifferentiable in the original reduced data (R = 4,132 for the peak at m/z 832.6497). Spectral similarity was evaluated through the Pearson correlation between the original and reconstructed peak intensities, which showed strong correlation for both sampled and non-sampled pixel locations (Figure 3B, Figure S7). Because the ground truth of the experimental data was unknown, we adapted peak picking on the average mass spectrum to form ion images from the full data as the reference for comparison. Reference and reconstructed ion images of m/z 820.5359 ([C44H79NO10+K]+, ppm=2.81) and m/z 832.6497 ([C45H89NO11+H]+, ppm=1.32) with different sampling rates were shown in Figure 3C. Reconstructing using a 30% sampling rate displays morphological consistency to the reference ion image (Fig. 3C, second row), though missing some subtle structural details. Using a 60% sampling rate (Fig. 3C, third row) significantly improves the recovery of finer details. It is worth noting that fully sampling all pixel locations (100% sampling rate) followed by the proposed reconstruction produces better quality images than the reference due to the denoising effect of both the subspace and sparse models (Fig. 3C, fourth row). The overall reconstruction quality determined by the spatial correlation suggests that sampling less than half of the total number of pixels can still achieve high-quality reconstruction (Figure 3D, Figure S7), with a score close to 0.8 giving nearly identical ion images. For high-lateral resolution imaging (e.g. subcellular level), higher acceleration factors can be achieved when the underlying full images have more pixels (such as the mega-pixel images used for evaluating different CS-based image recovery algorithms), which have important implications for high-resolution MSI experiments
Figure 3.
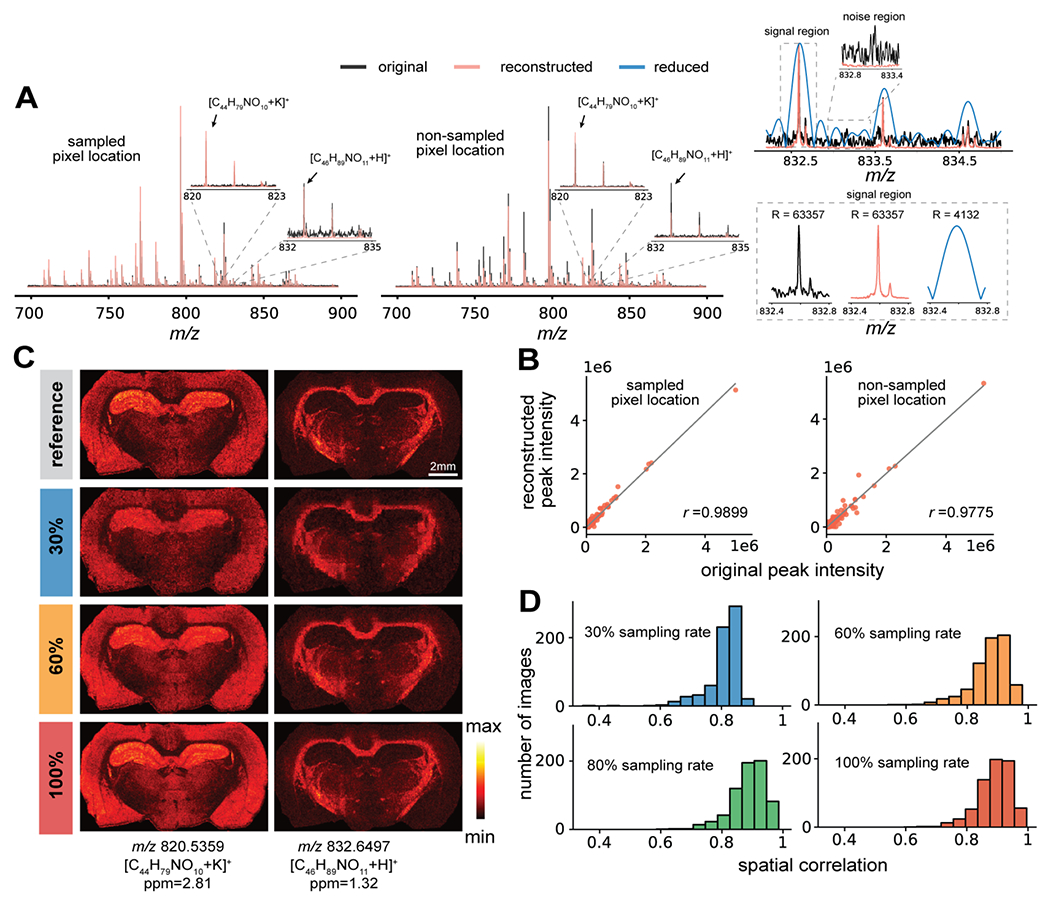
Reconstruction of a high-resolution FT-ICR MSI dataset from a rat brain coronal section. (A) Mass spectra from the reference dataset (all pixels fully sampled with long transients) and reconstruction from the sparsely sampled reduced data (5% transient duration and 30% sampling rate) by the proposed approach exhibit strong consistency for both sampled and non-sampled pixel locations. The insets show the isotopic distributions for two ion signals. The mass spectra obtained from the reconstructed data have a lower noise level than the reference data and achieved significantly improved mass resolution over the standard Fourier transform of the reduced data. Mass spectra were obtained from apodized transients with magnitude mode. (B) High-level similarity between the reference and reconstructed mass spectra is supported by quantitative analysis of peak intensity profiles using the Pearson correlation. (C) Selected ion images are shown at m/z 820.5359 and m/z 832.6497 from the reference dataset (row 1) as well as the reconstructed dataset with 30, 60 and 100% pixels sampled, all with 5% transient duration (rows 2 to 4 respectively). (D) The histograms of the spatial correlation measures of ion images from reference and reconstructed datasets suggest that the proposed method can produce accurate molecular distributions from sparsely sampled data.
High-resolution FT-MSI with enhanced throughput.
For the experimental implementation of the proposed integrated subspace and CS based sparse sampling strategy, we acquired multiple datasets from adjacent slices of the rat brain using different sampling settings to better assess the reconstruction quality under practical experimental conditions, with a 25 μm lateral resolution (Table 1). Dataset 1 was fully sampled with standard transient acquisition (0.731 s acquisition time per transient, 160,000 mass resolution at m/z 400), which took 34 h to complete and was processed using the standard method. Five other datasets (datasets 2-6, each from a slice 160 μm apart) were all acquired with a reduced transient duration (0.045 s) and reconstructed using the proposed method with the basis transients estimated from dataset 1. Although sampling only transients with reduced duration significantly decreased the actual acquisition time for dataset 2, measurement overhead became dominant and limited the overall experimental acceleration as all pixels were still being scanned. Datasets 3 to 6 were acquired with randomly sampled portions of the pixels at different ratios (sparsely sampled data), further reducing the total imaging time on top of the acceleration already offered by the short-time acquisition. Specifically, with a 40% sampling rate, we were able to acquire a dataset containing 84,763 pixels in <5 h (dataset 5). A 30% sampling rate with short-time acquisition led to an approximately 10× faster scan than the traditional uniform sampling. Details on the sample preparation, experimental implementation, data acquisition, and reconstruction are provided in the Supporting Information. Compared to a direct Fourier transform of the raw reduced data, the proposed reconstruction improved mass resolution from 5,800 (from the raw reduced data) to 93,000 at m/z 700, as shown by the single-pixel spectra from the same location sampled from dataset 5 (Figure 4A, top). The average spectrum from the reconstructed dataset retained remarkable similarity to the high-resolution dataset 1 (Figure 4A, middle and bottom). Ion images for some lipid species are shown in Figure 4B. Similar to results shown in Figure 3, images reconstructed by our method with fully sampled pixel locations but reduced transient duration (Figure 4B ii, dataset 2) display higher SNRs and better ion image contrast in comparison to the images from the standard reconstruction of dataset 1 which was acquired using uniform, long transients (Figure 4B i). All sparsely sampled data yielded images with consistent ion spatial distributions (Figure 4B iii, iv, Figure S8). Although gradual loss of fine spatial details can be observed as sampling rate decreases, we still found satisfactory recovery of structural features, e.g., as demonstrated by the zoomed in images of two ions [C42H78NO8P+H]+ and [C49H80NO7P+H]+ at the corpus callosum region (Figure 4C) observed in adjacent slices. Additionally, we performed exploratory data analysis including principal component analysis (PCA) and k-means clustering on datasets listed in Table 1 to unveil the spatial variations of the tissue chemical profiles (Figure 5 and Figure S9). Reconstruction of data with considerably low sampling rates (30-40%) could adequately recover spatio-chemical variations across the tissue obtained either by PCA, or k-means clustering for spatial segmentation of the chemically defined tissue types that were reconstructed by our proposed method (Figure 5A, B). The high mass resolution achieved by the reconstruction retained rich spectral features which were putatively assigned through searching against the LIPIDMAPS database33 with a mass accuracy threshold (<2 ppm). For dataset 5, a total of 658 m/z features (out of 2226 detected m/z features) were putatively assigned to lipids with common positive mode adducts (H+, K+, Na+), and the number of lipid assignments for the major lipid classes was summarized in Figure 5C. These results demonstrate the potential of our method to enable rapid mapping of tissue chemical profiles when both high throughput and high data quality (defined by lateral and mass resolution) are desired, which is especially true for volumetric reconstruction of tissue biomolecular profiles using FT-MSI and potential clinical translations. For application of our method to other types of tissue, the lower bound of sampling rate to achieve satisfactory recovery may vary depending on the spatial redundancy of the tissue morphology.
Table 1.
Acquisition settings for 6 different experimental datasets used for evaluation.
| Dataset | Total number of pixels | Number of pixels sampled | Transient duration (s) | Data acquisition/total imaging time (min) |
|---|---|---|---|---|
| 1 | 99585 | 99585 (100%) | 0.731 | 1213/2039 |
| 2 | 88699 | 88669 (100%) | 0.045 | 66/724 |
| 3 | 100856 | 60513 (60%) | 0.045 | 45/497 |
| 4 | 84918 | 42459 (50%) | 0.045 | 32/350 |
| 5 | 84763 | 33905 (40%) | 0.045 | 25/282 |
| 6 | 86759 | 26027 (30%) | 0.045 | 19/219 |
Figure 4.
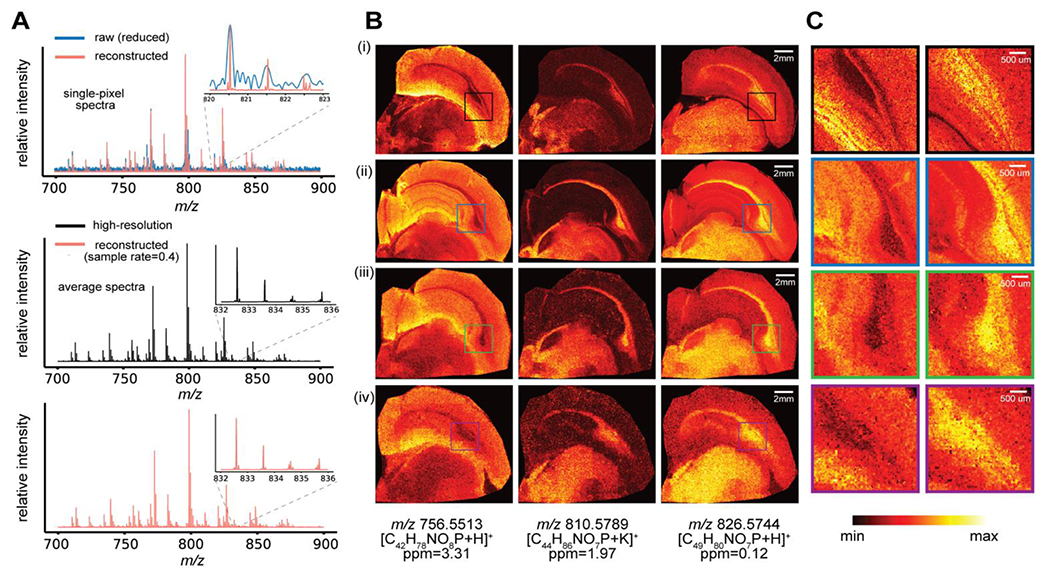
Representative results from different datasets listed in Table 1 generated by experimental implementation of the proposed sparse sampling strategy and reconstruction using our algorithm. (A) Reduced and reconstructed single-pixel mass spectra (sampled location) from dataset 5 with 40% sampling rate (top), average mass spectra in the range of m/z 700-900 from the fully sampled high-resolution dataset 1 (middle), and the average mass spectra from the reconstruction of dataset 5 (bottom). Insets show the isotopic distribution for a selected ion in a small m/z window. Individual mass spectra were obtained from apodized transients with magnitude mode FT processing. (B) Three representative ion images for m/z 756.5513, 810.5789, and 826.5744 are shown for the the fully sampled high-resolution (HR) dataset 1 (i), short-time acquisition without spatial sparse sampling (dataset 2) (ii), short-time acquisition with 60% pixels sampled (iii), and short-time acquisition with 40% pixels sampled (iv). (C) Zoomed in ion images at m/z 756.5513 and 826.5744 for certain brain regions, which include part of the corpus callosum, display significant recovery of the spatial information and structural details while using a relatively low sampling rate.
Figure 5.
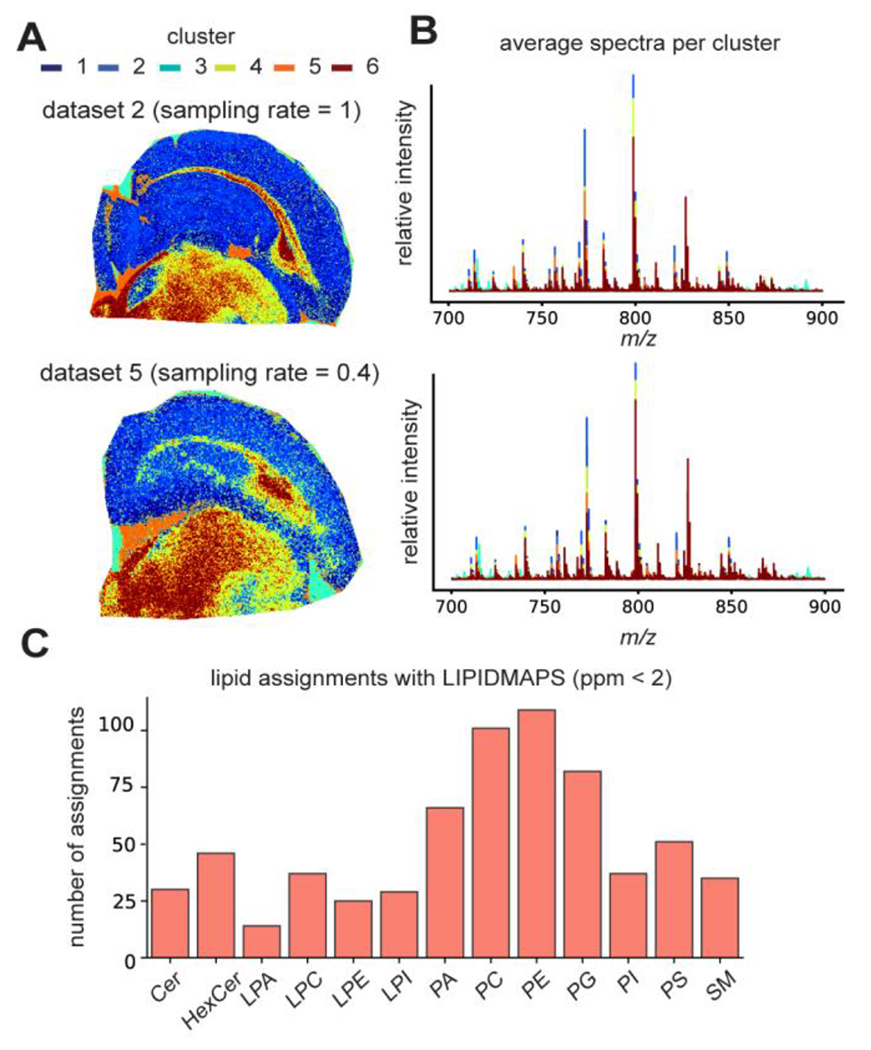
Downstream data analysis of the reconstructed datasets listed in Table 1 demonstrates the preservation of chemical insights of the tissue by the proposed method with enhanced throughput. (A) Spatial segmentation using the chemical profiles from the reconstructed data through k-means clustering (k=6) provides structurally intuitive cluster assignments, which are consistent between datasets acquired without (top) and with spatially sparse sampling at a 40% sampling rate (bottom). (B) Average mass spectra of 6 clusters for the two datasets, respectively. (C) Putative lipid assignments of the major lipid classes obtained by searching against the LIPIDMAPS with a <2ppm threshold for dataset 5
Conclusion
We present an integrative computational and experimental approach for enhancing the throughput of FTMS MSI that synergizes CS and subspace imaging based sparse sampling. The novel combination of subspace imaging with CS allows for multiplicative acceleration factors by reducing both acquisition time per pixel and the measurement overhead. Results from both simulations and real experimental data demonstrated significantly improved throughput enabled by the proposed approach while still achieving the desired high mass resolution which is critical for accurate compound identification and analyte coverage of samples. Our computational imaging strategy provides more flexibility in balancing the imaging speed, resolution, and data quality. The increased speed either enables more samples to be imaged per instrument or the same number of samples at a higher lateral resolution while retaining high mass resolution. Theoretically for tissues with less structural and chemical complexity than the brain, a lower sampling rate, shorter transient duration, as well as a lower rank than what we practiced in the experiments could be achieved due to a higher data redundancy for more homogeneous samples, thus providing an even higher imaging throughput. Our method is also theoretically applicable to another FTMS mass analyzer, the Orbitrap, which also acquires temporal transient and uses Fourier transform analysis, and can also be integrated with other scanning strategies (with customized hardware) to achieve greater acceleration of high-resolution, high-throughput FTMS MSI for tissue biochemical imaging.
Supplementary Material
Supporting methods: computational details for modes and algorithms and experimental details for sample preparations and MSI setups; supporting Figure S1-S10, Table S1, as noted in the text.
Acknowledgment
This project was supported by the National Institute on Drug Abuse under award No. P30DA018310, the National Human Genome Research Institute under award No. RM1HG010023 and National Institute of General Medical Sciences under award No. 1R35GM142969-01. Y.R.X acknowledges support from the Beckman Graduate Fellowship. The content is solely the responsibility of the authors and does not necessarily represent the official views of the awarding agencies.
Footnotes
Conflict of Interest
The authors declare no competing financial interest.
Data and Code Availability
The data and code for this paper can be available upon reasonable requests to the authors.
REFERENCES
- (1).Norris JL; Caprioli RM Analysis of Tissue Specimens by Matrix-Assisted Laser Desorption/Ionization Imaging Mass Spectrometry in Biological and Clinical Research. Chem. Rev 2013, 113 (4), 2309–2342. [DOI] [PMC free article] [PubMed] [Google Scholar]
- (2).Rae Buchberger A; DeLaney K; Johnson J; Li L Mass Spectrometry Imaging: A Review of Emerging Advancements and Future Insights. Anal Chem 2018, 90 (1), 240–265. [DOI] [PMC free article] [PubMed] [Google Scholar]
- (3).Wang T; Cheng X; Xu H; Meng Y; Yin Z; Li X; Hang W Perspective on Advances in Laser-Based High-Resolution Mass Spectrometry Imaging. Anal. Chem 2020, 92 (1), 543–553. [DOI] [PubMed] [Google Scholar]
- (4).Scigelova M; Hornshaw M; Giannakopulos A; Makarov A Fourier Transform Mass Spectrometry. Mol Cell Proteomics 2011, 10 (7). [DOI] [PMC free article] [PubMed] [Google Scholar]
- (5).Xian F; Hendrickson CL; Marshall AG High Resolution Mass Spectrometry. Anal. Chem 2012, 84 (2), 708–719. [DOI] [PubMed] [Google Scholar]
- (6).Kompauer M; Heiles S; Spengler B Atmospheric Pressure MALDI Mass Spectrometry Imaging of Tissues and Cells at 1.4-Mm Lateral Resolution. Nature Methods 2017, 14 (1), 90–96. [DOI] [PubMed] [Google Scholar]
- (7).Bowman AP; Blakney GT; Hendrickson CL; Ellis SR; Heeren RMA; Smith DF Ultra-High Mass Resolving Power, Mass Accuracy, and Dynamic Range MALDI Mass Spectrometry Imaging by 21-T FT-ICR MS. Anal. Chem 2020, 92 (4), 3133–3142. [DOI] [PMC free article] [PubMed] [Google Scholar]
- (8).Prentice BM; Chumbley CW; Caprioli RM High-Speed MALDI MS/MS Imaging Mass Spectrometry Using Continuous Raster Sampling. Journal of Mass Spectrometry 2015, 50 (4), 703–710. [DOI] [PMC free article] [PubMed] [Google Scholar]
- (9).Bednařík A; Kuba P; Moskovets E; Tomalová I; Krásenský P; Houška P; Preisler J Rapid Matrix-Assisted Laser Desorption/Ionization Time-of-Flight Mass Spectrometry Imaging with Scanning Desorption Laser Beam. Anal. Chem 2014, 86 (2), 982–986. [DOI] [PubMed] [Google Scholar]
- (10).Kooijman PC; Nagornov KO; Kozhinov AN; Kilgour DPA; Tsybin YO; Heeren RMA; Ellis SR Increased Throughput and Ultra-High Mass Resolution in DESI FT-ICR MS Imaging through New-Generation External Data Acquisition System and Advanced Data Processing Approaches. Scientific Reports 2019, 9 (1), 1–11. [DOI] [PMC free article] [PubMed] [Google Scholar]
- (11).Spraggins JM; Caprioli RM High-Speed MALDI-TOF Imaging Mass Spectrometry: Rapid Ion Image Acquisition and Considerations for Next Generation Instrumentation. J Am Soc Mass Spectrom 2011, 22 (6), 1022–1031. [DOI] [PMC free article] [PubMed] [Google Scholar]
- (12).Smith DF; Kilgour DPA; Konijnenburg M; O’Connor PB; Heeren RMA Absorption Mode FTICR Mass Spectrometry Imaging. Anal. Chem 2013, 85 (23), 11180–11184. 10.1021/ac403039t. [DOI] [PubMed] [Google Scholar]
- (13).Nagornov KO; Tsybin OY; Nicol E; Kozhinov AN; Tsybin YO Fourier Transform Ion Cyclotron Resonance Mass Spectrometry at the True Cyclotron Frequency. Mass Spectrom Rev 2021. [DOI] [PubMed] [Google Scholar]
- (14).Grinfeld D; Aizikov K; Kreutzmann A; Damoc E; Makarov A Phase-Constrained Spectrum Deconvolution for Fourier Transform Mass Spectrometry. Anal. Chem 2017, 89 (2), 1202–1211. 10.1021/acs.analchem.6b03636. [DOI] [PubMed] [Google Scholar]
- (15).Xie YR; Castro DC; Lam F; Sweedler JV Accelerating Fourier Transform-Ion Cyclotron Resonance Mass Spectrometry Imaging Using a Subspace Approach. J. Am. Soc. Mass Spectrom 2020, 31 (11), 2338–2347. [DOI] [PMC free article] [PubMed] [Google Scholar]
- (16).Lustig M; Donoho D; Pauly JM Sparse MRI: The Application of Compressed Sensing for Rapid MR Imaging. Magnetic Resonance in Medicine 2007, 58 (6), 1182–1195. [DOI] [PubMed] [Google Scholar]
- (17).Zhu L; Zhang W; Elnatan D; Huang B Faster STORM Using Compressed Sensing. Nature Methods 2012, 9 (7), 721–723. [DOI] [PMC free article] [PubMed] [Google Scholar]
- (18).Ma Y; Lee Y; Best-Popescu C; Gao L High-Speed Compressed-Sensing Fluorescence Lifetime Imaging Microscopy of Live Cells. PNAS 2021, 118 (3). [DOI] [PMC free article] [PubMed] [Google Scholar]
- (19).Cleary B; Simonton B; Bezney J; Murray E; Alam S; Sinha A; Habibi E; Marshall J; Lander ES; Chen F; Regev A Compressed Sensing for Highly Efficient Imaging Transcriptomics. Nature Biotechnology 2021, 1–7. [DOI] [PMC free article] [PubMed] [Google Scholar]
- (20).Schede HH; Schneider CG; Stergiadou J; Borm LE; Ranjak A; Yamawaki TM; David FPA; Lönnerberg P; Tosches MA; Codeluppi S; La Manno G Spatial Tissue Profiling by Imaging-Free Molecular Tomography. Nature Biotechnology 2021, 1–10. 10.1038/s41587-021-00879-7. [DOI] [PubMed] [Google Scholar]
- (21).Bartels A; Dülk P; Trede D; Alexandrov T; Maaß P Compressed Sensing in Imaging Mass Spectrometry. Inverse Problems 2013, 29 (12), 125015. [Google Scholar]
- (22).Helminiak D; Hu H; Laskin J; Ye DH Deep Learning Approach for Dynamic Sparse Sampling for High-Throughput Mass Spectrometry Imaging. IS&T Int Symp Electron Imaging 2021, 2021 (Computational Imaging XIX), 2901–2907. [DOI] [PMC free article] [PubMed] [Google Scholar]
- (23).Bray F; Bouclon J; Chiron L; Witt M; Delsuc M-A; Rolando C Nonuniform Sampling Acquisition of Two-Dimensional Fourier Transform Ion Cyclotron Resonance Mass Spectrometry for Increased Mass Resolution of Tandem Mass Spectrometry Precursor Ions. Anal. Chem 2017, 89 (17), 8589–8593. 10.1021/acs.analchem.7b01850. [DOI] [PubMed] [Google Scholar]
- (24).Candes EJ; Wakin MB An Introduction To Compressive Sampling. IEEE Signal Processing Magazine 2008, 25 (2), 21–30. [Google Scholar]
- (25).Bruckstein AM; Donoho DL; Elad M From Sparse Solutions of Systems of Equations to Sparse Modeling of Signals and Images. SIAM Rev. 2009, 51 (1), 34–81. [Google Scholar]
- (26).Liang Z Spatiotemporal Imaging with Partially Seperable Functions. 2007 4th IEEE International Symposium on Biomedical Imaging: From Nano to Macro; 2007; 988–991. [Google Scholar]
- (27).Lam F; Ma C; Clifford B; Johnson CL; Liang Z-P High-Resolution 1H-MRSI of the Brain Using SPICE: Data Acquisition and Image Reconstruction. Magnetic Resonance in Medicine 2016, 76 (4), 1059–1070. [DOI] [PMC free article] [PubMed] [Google Scholar]
- (28).Yang J; Zhang Y Alternating Direction Algorithms for l1-Problems in Compressive Sensing. SIAM J. Sci. Comput 2011, 33 (1), 250–278. [Google Scholar]
- (29).Marshall AG; Comisarow MB; Parisod G Relaxation and Spectral Line Shape in Fourier Transform Ion Resonance Spectroscopy. J. Chem. Phys 1979, 71 (11), 4434–4444. [Google Scholar]
- (30).Marshall AG; Hendrickson CL; Jackson GS Fourier Transform Ion Cyclotron Resonance Mass Spectrometry: A Primer. Mass Spectrometry Reviews 1998, 17 (1), 1–35. [DOI] [PubMed] [Google Scholar]
- (31).Dittwald P; Claesen J; Burzykowski T; Valkenborg D; Gambin A BRAIN: A Universal Tool for High-Throughput Calculations of the Isotopic Distribution for Mass Spectrometry. Anal. Chem 2013, 85 (4), 1991–1994. [DOI] [PubMed] [Google Scholar]
- (32).Sunkin SM; Ng L; Lau C; Dolbeare T; Gilbert TL; Thompson CL; Hawrylycz M; Dang C Allen Brain Atlas: An Integrated Spatio-Temporal Portal for Exploring the Central Nervous System. Nucleic Acids Research 2013, 41 (D1), D996–D1008. [DOI] [PMC free article] [PubMed] [Google Scholar]
- (33).Fahy E; Sud M; Cotter D; Subramaniam S LIPID MAPS Online Tools for Lipid Research. Nucleic Acids Res 2007, 35 (Web Server issue), W606–W612. [DOI] [PMC free article] [PubMed] [Google Scholar]
Associated Data
This section collects any data citations, data availability statements, or supplementary materials included in this article.
Supplementary Materials
Supporting methods: computational details for modes and algorithms and experimental details for sample preparations and MSI setups; supporting Figure S1-S10, Table S1, as noted in the text.
Data Availability Statement
The data and code for this paper can be available upon reasonable requests to the authors.