Abstract
Overview
Processed foods make up about 70 percent of the North American diet. Sulfites and other food preservatives are added to these foods largely to limit bacterial contamination. The mouth microbiota and its associated enzymes are the first to encounter food and therefore likely to be the most affected.
Methods
Eight saliva samples from ten individuals were exposed to two sulfite preservatives, sodium sulfite and sodium bisulfite. One sample set was evaluated for bacteria composition utilizing 16s rRNA sequencing, and the number of viable cells in all sample sets was determined utilizing ATP assays at 10 and 40-minute exposure times. All untreated samples were analyzed for baseline lysozyme activity, and possible correlations between the number of viable cells and lysozyme activity.
Results
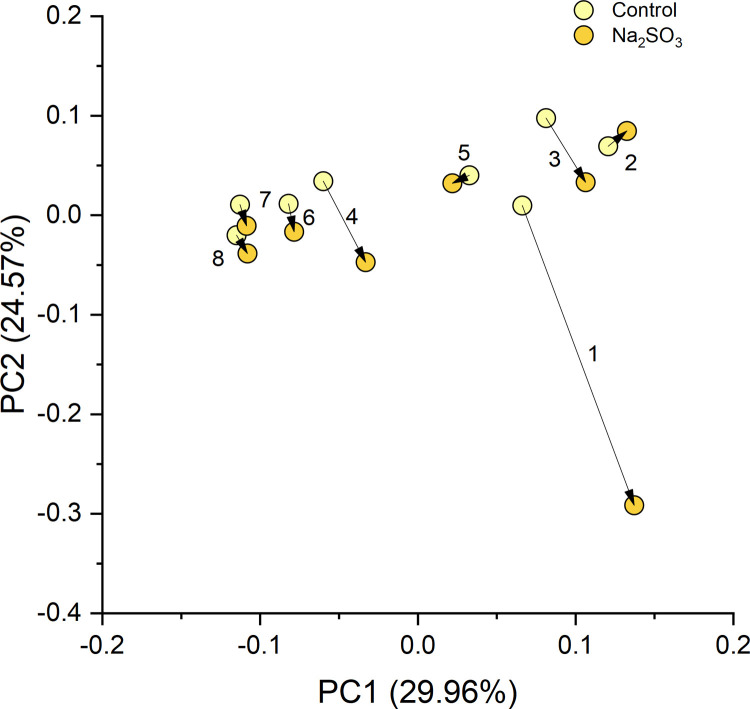
Sequencing indicated significant increases in alpha diversity with sodium bisulfite exposure and changes in relative abundance of 3 amplicon sequence variants (ASV). Sodium sulfite treated samples showed a significant decrease in the Firmicutes/Bacteroidetes ratio, a marginally significant change in alpha diversity, and a significant change in the relative abundance for Proteobacteria, Firmicutes, Bacteroidetes, and for 6 ASVs. Beta diversity didn’t show separation between groups, however, all but one sample set was observed to be moving in the same direction under sodium sulfite treatment. ATP assays indicated a significant and consistent average decrease in activity ranging from 24–46% at both exposure times with both sulfites.
Average initial rates of lysozyme activity between all individuals ranged from +/- 76% compared to individual variations of +/- 10–34%. No consistent, significant correlation was found between ATP and lysozyme activity in any sample sets.
Conclusions
Sulfite preservatives, at concentrations regarded as safe by the FDA, alter the relative abundance and richness of the microbiota found in saliva, and decrease the number of viable cells, within 10 minutes of exposure.
Introduction
The human oral cavity is a complex environment hosting up to 700 different species of bacteria, found primarily in 5 phyla, residing in saliva, teeth surfaces and on the apical mucosa of the tongue and cheeks [1–3]. At birth, colonization of the mouth begins. Streptococcus salivarius, a facultative anaerobe, is one of the initial colonizers along with several aerobes within the 1st year, including Lactobacillus, Actinomyces, Neisseria and Veillonella, an anaerobe. [4]. Diversity and the number of bacteria present in different individuals’ mouths may vary as a result of environmental and genetic factors including disease and diet. However, recent studies have found most healthy individuals maintain a fairly consistent population over weeks to months of time [2,5].
Human saliva contains several enzymes and buffers that contribute to the first steps in digestion and serve as a first line of defense in immunological responses [6,7]. Lysozyme is found in saliva, as well as tears, blood serum, perspiration, and other bodily fluids. It is an antimicrobial enzyme that catalyzes cleaving of ß(1,4)-glycosidic bonds between residues of N-acetylmuramic acid (NAM) and N-acetylglucosamine (NAG) in peptidoglycan of primarily gram positive bacterial cell walls. Research has shown that lysozyme found in the mouth can lower the adherence of bacteria to surfaces and limit the number of microbes [8,9].
An imbalance in the mouth microbiome can lead to oral diseases such as dental caries, periodontitis, oral mucosal disease, and systemic diseases of the gastrointestinal, cardiovascular, and nervous systems [1,10]. A few recent studies have detected significant changes in the mouth microbiota in response to short and long-term environmental alterations [11–14]. Bescos et.al. observed the effects of chlorhexidine mouthwash resulting in a significant increase in the percent abundance of Firmicutes and Proteobacteria and a decrease in Bacteroidetes, Fusobacteria, TM7, and SR1 [11]. The effects of inorganic nitrates (found in vegetables) on the mouth microbiome of 19 omnivores and 22 vegetarians, displayed an increase in the percent abundance of Proteobacteria and a decrease in Bacteroidetes consistent with the chlorhexidine mouthwash study [12]. Another study, examining the effects of green tea on both the gut and mouth microbes showed “an irreversible increase of Firmicutes to Bacteroidetes ratio, elevated SCFA producing genera, and reduction of bacterial LPS synthesis in feces” [13]. A study examining betel nut chewing in 122 individuals, found reduced bacterial diversity, elevated levels of Streptococcus infantis, and changes in distinct taxa of Actinomyces and Streptococcus genera in current users and reduced levels of Parascardovia and Streptococcus in long-term chewers [14]. At the phyla level in both the mouth and gut, an increase in Firmicutes is often observed with obesity, and an increase in Bacteroidetes is observed with inflammatory bowel disease [10,15,16]. Proteobacteria, another key player in the oral microbiome, has been found to be the most variable phylum in dysbiosis and its increase is generally related to a decrease in Firmicutes [10,16].
Antibiotics, diet, and food additives including artificial sweeteners, emulsifiers, preservatives, colorants, and acidity regulators can result in dysbiosis in the gut leading to a variety of human health issues [17–20]. An unhealthy gut microbiome influences signaling in the gut-brain axis; a bidirectional signaling system responsible for homeostasis, function, and overall health [21]. A recent study in germ-free humanized mice found that a mixture of common antimicrobial food additives including sodium benzoate, sodium nitrite, and potassium sorbate induced a significant dysbiosis in the gut [22]. Sodium sulfite and sodium bisulfite have long been used as preservatives to prevent food spoilage and browning. They can be found in a variety of foods such as dried fruit, processed meat, beer, wine, and canned goods [23]. Many foods contain such high levels of sulfites that exposure above levels generally regarded as safe (GRAS) by the US Food and Drug Administration (FDA) is common [23]. Our previous study demonstrated that under ideal growing conditions, sodium sulfite at 3780ppm and sodium bisulfite at 1800 ppm (both lower than the 5000ppm allowable for GRAS), were bactericidal to four probiotic species in 2–6 hours of exposure [24]. Few studies have been conducted to determine the effect of preservatives on the gut microbiota and none are known to us regarding their impact on the mouth microbiome.
Most recent studies on the human mouth and gut microbiota have utilized 16s rRNA sequencing, and in some cases flow cytometry or CFUs along with OD600 spectrophotometry to quantify cell numbers [2,5]. Twenty to sixty percent of the bacterial cells in the mouth microbiome are estimated to be unculturable, making plate counts and CFUs of limited use [2]. This has made 16S rRNA sequencing a powerful tool to profile mixed communities of bacteria. However immediate or short-term changes in the microbiome cannot reliably be detected due to the complex nature of the communities and the detection of DNA sequences from both living and recently lysed cells [2]. Flow cytometry is thought to be the gold standard for cell counting but also has limitations due to the potential presence of bacterial aggregates which may artificially deflate the cell count [2].
The concentration of adenosine triphosphate (ATP) present in living cells can be quantified using a proportional luminescent signal to observe immediate changes in the numbers of viable bacterial cells in a sample. Sensitivity as low as 0.0001nM ATP, reflecting the test population, is high due to the rapid loss of ATP in non-living cells [25]. This method implements a recombinant luciferase enzyme to oxidize luciferin in the presence of ATP and oxygen to produce oxyluciferin and light. It has been used to accurately quantify changes in the number of viable cells in various antibiotic susceptibility tests ranging from in-vitro biofilm formations by Pseudomonas aeruginosa [26], multiple gram-negative bacterial species within 24 hours of treatment with antibiotics [27], and slow growing species such as Borrelia burgdorferi [28]. Limitations to this method include the detection of eukaryotic cell’s ATP present in some mixed populations, differences in amounts of ATP produced by varying cell types and inhibition of the luminescence signal due to the media used in assays. All these factors were considered in the experiments described here.
This study examines the effects of two types of sulfite preservatives on the human mouth microbiome by corresponding changes in ATP activity of saliva samples collected over a 4–5-week period from 10 individuals. Bacteria in saliva samples from one individual were examined for responses to the sulfite treatments indicated by changes in the percent abundance and/or diversity with 16s rRNA sequencing. Additionally, baseline lysozyme activity in the individuals being studied was determined and compared to the number of viable cells found in the samples.
Methods and materials
Saliva collection
Unstimulated saliva was collected from 10 individuals between 2–10 hours after consuming food or drink, other than water. Prior to donation, each individual rinsed mouth 3 times with water followed by a twenty-minute waiting period before delivering saliva via spitting into a sterile tube. Samples were placed on ice for the duration of collection and aliquoting. Time allowed for saliva collection was kept under 30 minutes. Collections took place twice a week with at least 2 days in between, over 4–5 weeks. Each participant supplied 8 samples total. Collected saliva was diluted 1:10 with sterile DI water, aliquoted and stored at -80°C. Participants contributing to saliva collections included ten individuals, 2 males (M1 and M2) and 8 females (F1-F8) from 18–60 years of age, all in overall good health. Our protocol for utilizing human saliva samples was reviewed and permitted by the Institutional Biosafety Committee (IBC) at the University of Hawaii. The Internal Review Board was also consulted and it was determined that no further review was necessary because the samples were made anonymous immediately after collecting, and they were not considered human samples due to the analysis performed being directed only on the bacterial cells. Aliquots of the same samples were used in all experiments.
Sulfite exposure to saliva samples
Saliva aliquots were exposed to freshly made, 1800 ppm (17.3 mM) sodium bisulfite (Fisher Scientific) or 3780 ppm (30 mM) anhydrous sodium sulfite (Fisher Scientific) both prepared in sterile water in independent experiments. Immediately following exposure to sulfites, aliquots of each control and matching exposed sample were centrifuged at 4,600 RCFs (7000 RPMs) for 10 minutes to pellet cells. The supernatant was discarded and the pellet brought up in an equal volume of 1X phosphate buffered saline (PBS). These samples are referred to as “time 0” (T0). The other half of each aliquot was placed in an incubator set at 36°C for 30 minutes (T30), then pelleted using the same procedure described for time zero samples, brought up in 1X PBS and stored. All samples were stored at -20°C for short term storage of 6 weeks or less, or at -80°C for longer storage. See supplemental materials for additional notes on procedure.
ATP activity in saliva samples
BacTiter-Glo™ Microbial Cell Viability Assay from Promega was used to quantify relative numbers of viable bacterial cells found in saliva samples. The Perkin Elmer Victor X3 multi-mode plate reader was used to record luminescence of all samples. Samples were assayed in triplicate using a white plate with clear bottom (View-Plate 96 TC from PerkinElmer). Lids were coated with Triton X100 as described by Brewster [29] to prevent condensation.
Blank wells were filled with sterile water to cut down on cross talk, negative controls contained 100ul of 1X PBS + 100ul BacTiter-GLO™ reagent. One hundred microliters of each treated and control (untreated) sample (3 replicates each) were tested. All samples from each individual were ATP assayed on the same day using the same Bac-titer glo reagent to limit variability between luminescence readings for more accurate comparisons of results. Samples and BacTiter-Glo™ reagent were brought to room temperature before use. Assay consisted of a 5 second orbital (0.10mm) shake, a 5-minute incubation at 25°C, followed by a 1 second read of luminescence (RLU).
Statistical analysis of ATP studies
For all statistical tests, p values < 0.05 were considered significant. Statistical errors were calculated as the standard error (SE) or standard deviation (SD). Average total RLU (relative light units) for each individual’s eight saliva samples were assessed using raw RLU data by a two-way ANOVA and paired T-Tests.
Sample preparation for DNA extraction
A total of 32 saliva samples from individual F2 was sent to Zymo Research, Irvine, CA for 16s rRNA sequencing. Sequenced samples included 8 sodium sulfite treated saliva samples at T0, and 8 untreated saliva samples serving as controls at T0. Eight sodium bisulfite treated saliva samples at T0 and the respective control samples. A 10:1 RNA/DNA shield from Zymo was added to each saliva sample to maintain samples during shipping.
DNA extraction
DNA was extracted from saliva samples using ZymoBIOMICS®-96 MagBead DNA Kit (Zymo Research, Irvine, CA). The ZymoBIOMICS® Microbial Community Standard was used as a positive control. A blank extraction control was used as the negative control.
Targeted library preparation
Bacterial 16S ribosomal RNA gene targeted sequencing was performed using the Quick-16S™ NGS Library Prep Kit (Zymo Research, Irvine, CA). Bacterial 16S primers amplify the V3-V4 region of the 16S rRNA gene. The ZymoBIOMICS® Microbial Community DNA Standard was used as a positive control. A blank library preparation was used as the negative control.
Absolute abundance quantification
Zymo Research indicates the following methods were used for absolute abundance quantification: A quantitative real-time PCR was set up with a standard curve. The standard curve was made with plasmid DNA containing one copy of the 16S gene and one copy of the fungal ITS2 region prepared in 10-fold serial dilutions. The primers used were the same as those used in Targeted Library Preparation. The equation generated by the plasmid DNA standard curve was used to calculate the number of gene copies in the reaction for each sample. The PCR input volume was used to calculate the number of gene copies per microliter in each DNA sample.
The number of genome copies per microliter DNA sample was calculated by dividing the gene copy number by an assumed number of gene copies per genome. The value used for 16S copies per genome is 4. The value used for ITS copies per genome is 200. The amount of DNA per microliter DNA sample (DNA_ng) was calculated using an assumed genome size of 4.64 x 10⁶ bp, the genome size of Escherichia coli, for 16S samples. This calculation is shown below:
Calculated Total DNA = Calculated Total Genome Copies × Assumed Genome Size (4.64 × 10⁶ bp) × Average Molecular Weight of a DNA bp (660 g/mole/bp) ÷ Avogadros Number (6.022 x 10²³/mole). (Zymo Research, Irvine, CA).
Sequencing
The final library was sequenced on Illumina® MiSeq™ with a v3 reagent kit (600 cycles). The sequencing was performed with 10% PhiX spike-in.
Bioinformatics analysis
Unique amplicon sequence variants (ASVs) were inferred from raw reads using the DADA2 pipeline as described by Callahan et al. [30]. Chimeric sequences were also removed with the DADA2 pipeline. Taxonomy assignment was performed using Uclust from Qiime v.1.9.1 with the Zymo Research Database.
Firmicutes/Bacteroidetes ratio was calculated using the number of sequences belonging to phylum Firmicutes divided by the number of sequences belonging to Bacteroidetes. To evaluate the significance of the differences between the control and treatment groups, paired t-tests were used for statistical analysis, and the results (with p-value < 0.05) shown in the figures. Alpha diversities were estimated using four indexes using R package “Vegan” [31]: including species number (richness), Chao1, Shannon index, and Inverse Simpson index. The beta diversity can be explained by the PCA (principal component analysis) plots, which was also conducted by the R package “Vegan” using the Bray-Curtis distance matrix at the ASV level. The relative abundances of ASVs in different samples were transformed and the first two principal components were plotted to show the relationships between the groups. The percentage followed in the axis shows the portion of the total variances that can be explained by the first or the second principal component. The differentially abundant taxa (at different phylogenetic levels) were identified based on the paired t-test results.
Lysozyme activity assays
Lysozyme activity initial rates were determined for all individuals untreated samples, using a Perkin Elmer Victor X3 multimode plate reader and an EnzChek™ Lysozyme Assay Kit (E-22013) from ThermoFisher Scientific at a temperature of 37°C. Black 96 well TC ViewPlates (PerkinElmer) with lids coated with Triton X100 as described by Brewster [29] to prevent condensation. Fifty microliters of saliva samples, 100ul of ENZ Check buffer, and 50ul of substrate was added to each well in triplicate.
Graphing
Results were analyzed and graphed using Originlab software.
Results
ATP assays
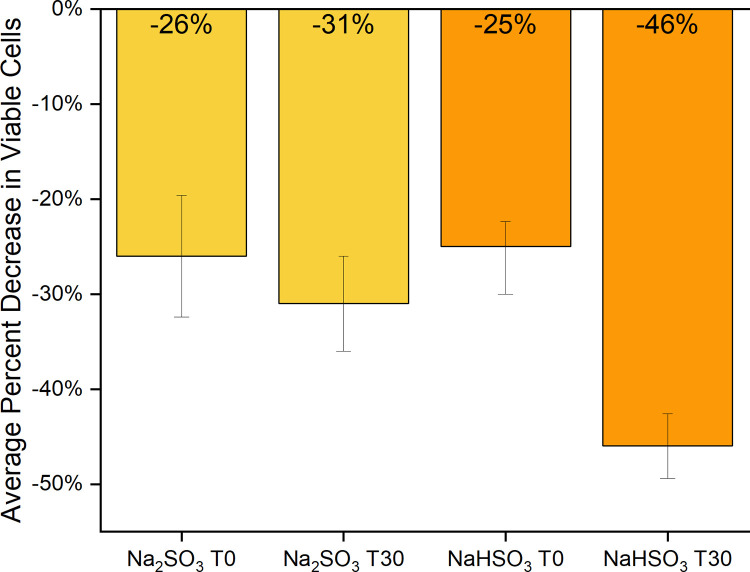
Two-way ANOVA tests with replication using raw (RLU) data indicate that there is no significant interaction between specific individuals and their reactions to sulfite treatments or between individual’s reactions to sulfite treatment due to exposure time. However, there is a significant difference in ATP levels between individual’s control and treated saliva samples, with a large variation in baseline numbers of bacteria present in each person’s mouth and a significant difference in ATP levels between sulfite treated and control samples for all individuals (Table 1, Fig 1 and S2 Appendix).
Table 1. “p-value” results of two-way ANOVA tests.
| Time 0 | Time 30 | |||||
| Individuals | Treatment | Interaction | Individuals | Treatment | Interaction | |
| SodiumSulfite | 6.38E-37 *** | 0.009 ** | 0.500 | 2.37E-31 *** | 0.035 * | 0.997 |
| SodiumBisulfite | 1.06E-28 *** | 0.002 ** | 0.121 | 2.41E-28 *** | 1.35E-05 *** | 0.065 |
Results show comparison of individual’s reactions to sulfite treatments, sulfite treatments compared to exposure time, and treated vs control samples for all saliva samples.
(* p<0.05
** p<0.01
*** p<0.001).
Fig 1. Average change in ATP activity after sulfite treatment.
Raw data (RLU) of all saliva samples (F1-F8 and M1-M2) treated with Na2SO3 or NaHSO3 compared to controls was used to determine the average % decrease of viable cells (based on ATP activity) in each at time 0 (T0) and time 30 (T30). The standard error of each test group was calculated, and evidence of observed difference was confirmed by both the paired t-test and the two-way ANOVA (Table 1).
Baseline lysozyme and comparison to number of viable cells (ATP)
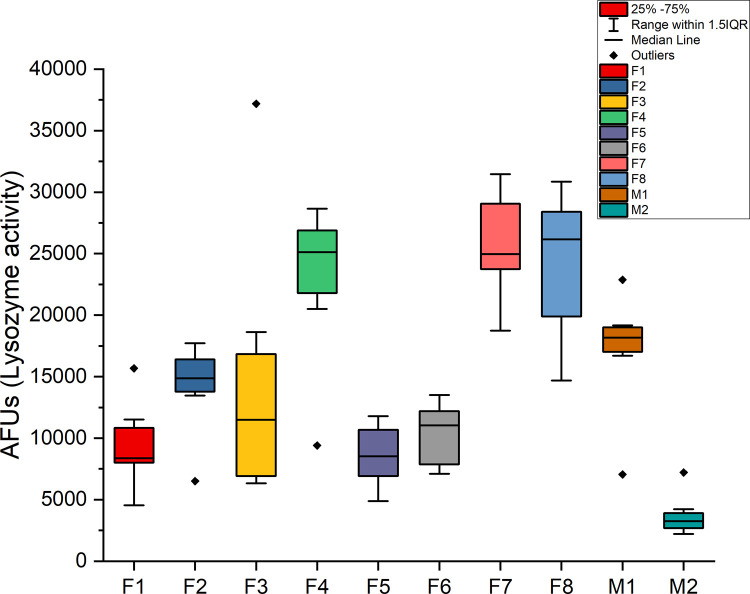
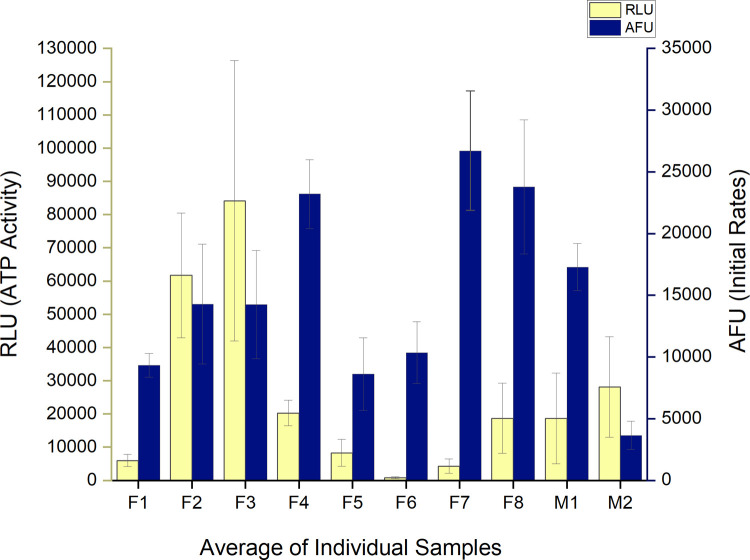
A baseline of lysozyme activity in the collected saliva samples was established over a five-week period. Activity was determined as a function of initial rates of ten individuals (Figs 2 and 3). A one-way ANOVA indicated an overall significant difference between individuals of p = 5.5 E-15. Tukey comparisons indicated in Fig 2 show each sample’s range and similarity among samples. A large variation in the average initial rates over the five weeks of collection time between all individuals was observed, ranging from +/- 76% compared to individual initial rate variations of +/- 34%. No consistent correlation between viable cells (ATP) and Lysozyme activity was observed (Fig 3).
Fig 2. Lysozyme activity in untreated saliva samples.
Untreated saliva samples from all individuals (n = 10) were assayed for initial rates of lysozyme activity. The average initial rate from replicates of 3 from each sample set/individual (n = 8) were used to determine the standard deviation and median scores.
Fig 3. Viable cells and lysozyme activity in control samples.
‘Comparison of averaged ATP activity and lysozyme initial rates in all 10 individual’s control saliva samples. Standard deviation of averaged sample sets indicated for both RLU and AFU.
Comparison of individual F2 ATP, lysozyme activity and 16s rRNA sequencing
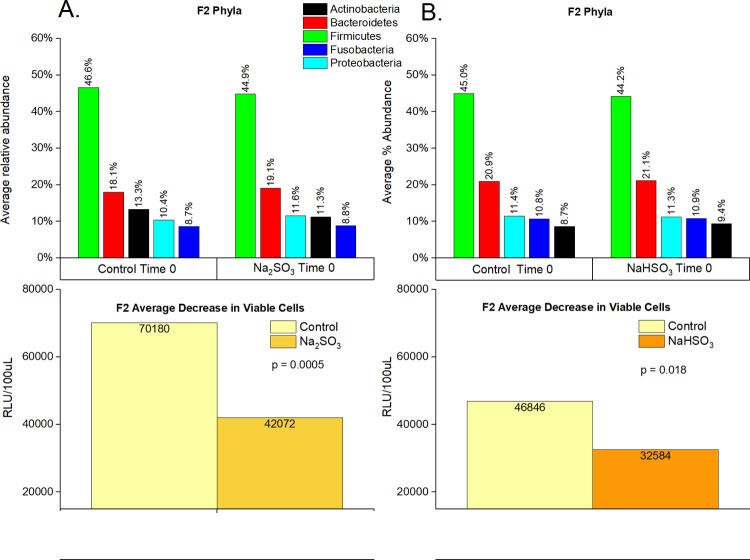
A significant decrease in viable cells based on ATP activity (RLU) in F2’s samples treated with Na2SO3 and NaHSO3 was observed, with a 40% and 30% decrease (respectively) illustrated in Fig 4A and 4B.
Fig 4. Cell viability and relative abundance of phyla in F2 samples before and after sulfite treatment.
F2 saliva samples (n = 32) were sequenced (16S rRNA) and the average percent abundance of the most predominant 5 phyla is displayed for untreated controls and sodium sulfite (A) or sodium bisulfite (B) treated samples at time 0. “p-values” were calculated using paired t-tests.
16s rRNA sequencing results
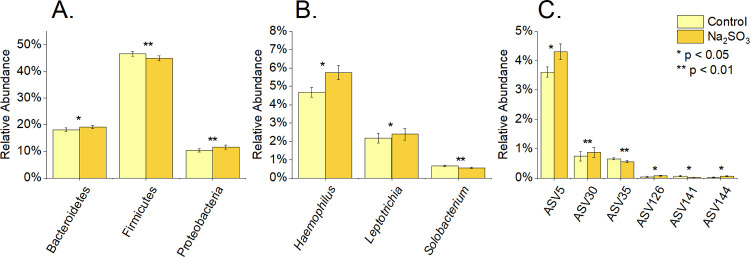
Individual “F2’s” samples indicated that Bacteroidetes, Proteobacteria and Firmicutes phyla significantly varied in relative abundance with Na2SO3 exposure (Figs 4A, 5A and 6A). However, no significant difference in the relative abundance of the top 5 phyla were observed with NaHSO3 (Figs 4B and 5B).
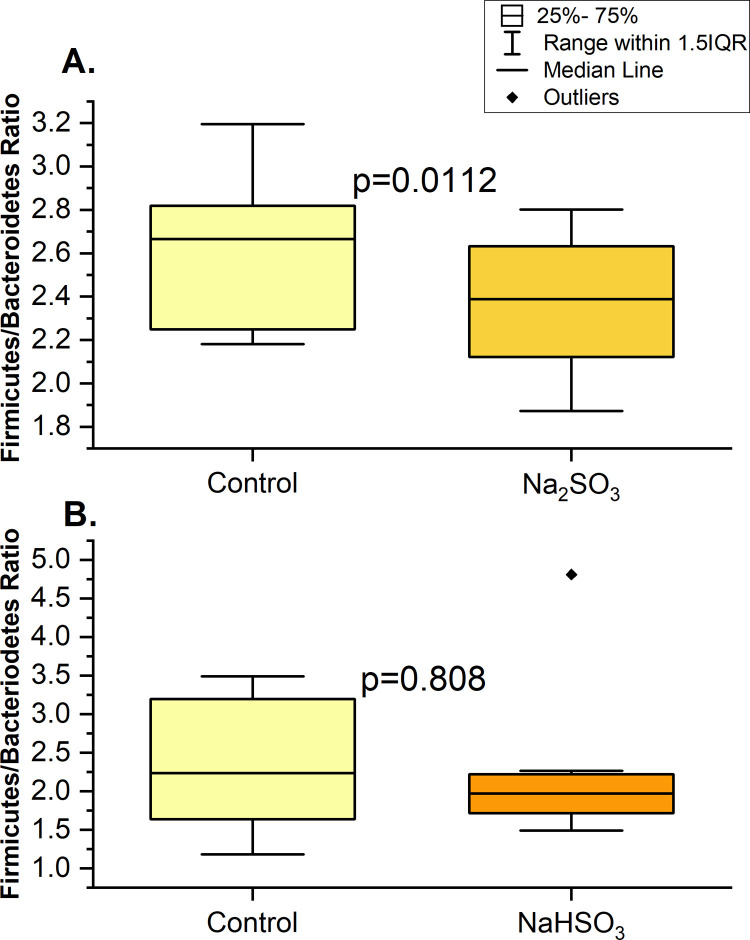
Fig 5. Ratio of firmicutes/bacteroidetes changes in F2 samples with sulfite treatments at time 0.
16S rRNA sequencing was used to determine the ratio (based on % abundance) for control and treated samples with Na2SO3 (A) or with NaHSO₃ (B) of individual F2.
Fig 6. Differentially abundant bacteria at different taxonomic levels in F2 sample, after sodium sulfite treatment at time 0.
16S rRNA sequencing was used to determine the % relative abundance of phyla (A), genus (B), and ASV (C) for control and treated samples with Na2SO3. P values were calculated using paired t-tests.
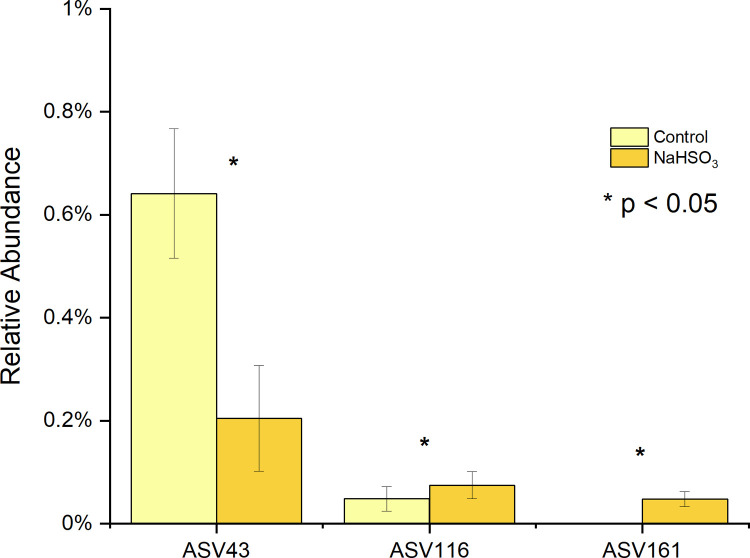
At a more detailed level, significant changes to 3 genus and 6 ASV’s (Fig 6A–6C) were also observed in the Na2SO3 treated samples and 3 ASV’s in the NaHSO3 assays also showed a significant change in relative abundance (Fig 7).
Fig 7. Differentially abundant ASVs in F2 sample after NaHSO3 treatment at time 0.
ASV43 shows a significant decrease while ASV116 and ASV161 increased significantly after the treatment.
A summary of the bacterial types at the genus and ASV level is presented in Table 2. Nine different anaerobic ASV’s exhibited significant changes in relative abundance with sulfite treatments. Four out of the five that showed an increase in abundance were Gram negative and three out of those five were sulfite reducing bacteria (SRB) or have the ability to avoid oxidative stress. Four ASV’s decreased in relative abundance with sulfite treatments. Three out of the four were Gram positive and one out of the 4 was a SRB.
Table 2. A: Bacteria species/ASVs exhibiting a significant change in relative abundance after exposure to sodium sulfite.
B: Bacteria species/ASVs exhibiting a significant change in relative abundance after exposure to sodium bisulfite.
| Species/ASV# | Haemophilus parainfluenzae ASV5 | Solobacterium moorei ASV35 | Alloprevotella rava ASV126 |
Actinomyces naeslundii ASV141
ASV144 |
Leptotrichia wadei ASV30 |
|---|---|---|---|---|---|
| Gram Stain | Negative | Positive | Negative | Positive | Negative |
| Cellular Respiration | Facultatively Anaerobic | Obligate Anaerobe | Obligate Anaerobic | Anaerobic or Microaerophilic | Anaerobe |
| Descriptive | This type of bacteria is known for its infectious abilities. [32] | Association with Halitosis [33] | Found in mouth in plaque | A is a common bacteria found in plaque. [1] | Normal oral flora |
| Relative Abundance | Increased | Decreased | Increased | ASV144 Increased ASV141 Decreased |
Increased |
| Sulfate reducing Bacteria | No but possess pathways to protect from oxidative stress [32] | No [33] | No [34] | No [1] | Yes [35] |
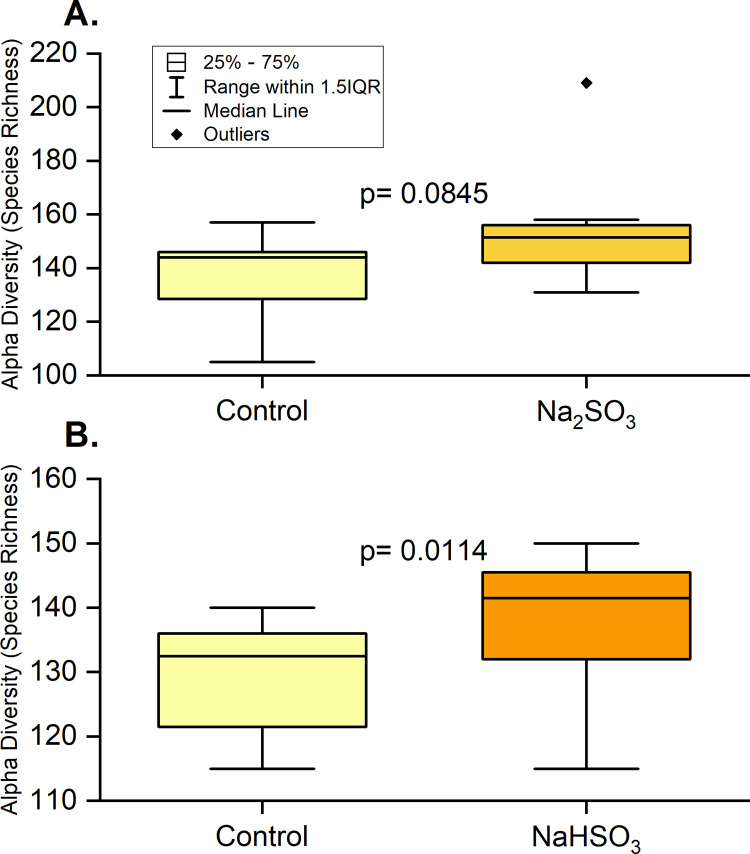
Alpha diversity measured by species richness and Chao 1 showed the same significant increase after exposure to NaHSO3 and a marginally significant increase upon exposure to Na2SO3. (Fig 8). However, no significant differences were identified with the Shannon or Inverse Simpson index.
Fig 8. Alpha diversity in F2 samples with sulfite treatment at time 0.
16S rRNA sequencing was used to determine species richness (based on relative abundance) for control and treated samples with Na2SO3 (A) and NaHSO₃ (B). A paired t-test showed that species richness increased significantly after treatment with NaHSO3 and was marginally significant after treatment with Na2SO3.
Baseline lysozyme activity for F2 samples compared to the respective number of viable cells (based on ATP activity) did not indicate a correlation of any type between these two parameters (S1 Fig).
Beta diversity
The PCA plot shows consistent changes in the oral microbial communities when comparing the control samples to the Na2SO3 treated samples of F2. As shown in Fig 9, the dissimilarity (beta-diversity) within the samples was large due to the possible micro-environment changes affected by many factors such as diet, hormonal status, etc. However, when treated with Na2SO3, the changes in the microbial community composition were towards almost the same direction, which indicates that the treatment of Na2SO3 caused consistent changes to the oral microbial community, even though their original structures were not similar.
Fig 9. Beta diversity of F2 Na₂SO₃ treated samples.
The PCA of all the ASVs from the control and Na2SO3 treated F2 samples, show consistent directions of changes in the microbial communities under the treatment of Na2SO3.
Discussion
Preservatives in food interact with the human microbiome first through the mouth and then the rest of the digestive tract. Sulfites are a common preservative added to a variety of foods and occur naturally in some fermented foods. Since being regulated as GRAS for use in food in 1958 by the US FDA, allowable amounts and applications have changed several times as it became clear that sulfites were causing moderate to severe (even fatal) health effects in some individuals [20,23,37,38] Mammals oxidize sulfite to sulfate with sulfite oxidase and some SRB use sulfate as an energy source, which may result in the production of H2S [39,40]. Both insufficient production of sulfite oxidase leading to an increase in several forms of sulfite reactive compounds, and oxidative stress from H2S on eukaryotic cells, may occur as the result of ingestion of sulfites. A recent study in rats showed that Na2SO3 (≧ 100ppm) causes death of gastric mucosal cells through oxidative stress [41]. This same study also looked at the effects of sodium sulfite (1mM) on lysozyme activity. They determined that Na2SO3 decreased the bacteriolytic activity of lysozyme in a time and dose dependent manner [41]. Other studies have shown a connection between certain types of SRB found in the colon and ulcerative colitis [42]. These studies provide evidence of mechanisms by which Na2SO3 may lead to both eukaryotic and prokaryotic cell death.
Our previous work indicated that sodium sulfite was bactericidal to three probiotic species of Lactobacillus and bacteriostatic to Streptococcus thermophilus, within 2–6 hours of exposure [24]. Sodium bisulfite was found to be bactericidal to all 4 probiotic bacteria also within 2–6 hours of exposure [24]. These studies established both the potency of these preservatives and the varying susceptibility of different types of bacteria when exposed under ideal culture conditions. The current study was conducted to evaluate the effects of these same sulfites on the mouth microbiome found in saliva to better simulate the effects of ingesting foods containing these preservatives.
ATP activity
Comparison of each individual’s control samples indicated that the viable number of cells were relatively consistent over the 5-week sampling time, which supports findings from other recent studies [2,5,10]. The most striking observations were the differences found in ATP activity (indicating viable cell counts), between controls and sulfite treated samples at both exposure times. Based on these results we can conclude that both sodium sulfite and sodium bisulfite, consistently and immediately (regardless of preservative type or sample origin) significantly reduced the number of viable bacterial cells in saliva samples. We are assuming this is a drop in the number of viable cells, but it could be partially due to sulfites interfering with ATP production, or ATP being utilized by SRB to metabolize the sulfites.
These results were also supported by our preliminary experiments on the mouth microbiome which examined the effects of sulfites on 12 saliva samples from 5 individuals over a three-month period. Very similar results of reduced ATP activity as described here were observed, with an average decrease in viable cells of 27% and 28% at time 0 for Na2SO3 and NaHSO3 respectively. Additional experiments observed changes in the microbial population in these saliva samples by recording OD600 readings over a 6.5-hour period. We observed an initial decrease in cell numbers in the treated which remained lower than controls throughout study, and an increase in cell numbers in the controls.
Lysozyme
Lysozyme activity did not vary significantly over the 5 weeks of sample collection/individual and there did not appear to be any correlation between the number of viable cells and lysozyme activity (Fig 3). If the population could be measured accurately to show the number of gram-negative vs. gram-positive bacteria present, a relationship might be found due to the greater impact of lysozyme on gram-positive cells. Significant differences in lysozyme activity were observed between individuals (Fig 2). Previous studies have corroborated our results of inter versus intra-individual lysozyme variability [43] and others have shown that lysozyme varies between individuals with respect to circadian rhythm [44].
Preliminary studies on the effects of Na2SO3 on lysozyme activity in saliva (S-lys) and on human recombinant lysozyme (HR-Lys) indicated a decreased initial rate profile of HR-Lys and to a lesser degree S-lys with sodium sulfite incubation. We hypothesize that this difference may be attributed to the rich mixture of biological components that compose salivary fluid, where sulfite may act on bacteria as well as nucleophiles and nonspecific inhibitors [45]. These early studies suggest that sodium sulfite would affect lysozyme function in human saliva and subsequently alter the mouth microbiome. However, we have yet to determine conclusively that sulfite inhibits salivary lysozyme activity and further studies are in progress. More studies are needed to look at the relationship between lysozyme activity, sulfites, and the makeup of the mouth microbiome.
16s rRNA sequencing
This study identified five major bacterial phyla (Fig 4) as the most abundant in all control and treated samples. These five phyla, Actinobacteria, Bacteroidetes, Firmicutes, Fusobacteria, and Proteobacteria, are considered the “core microbiome” in the human mouth since they have been consistently reported as the main bacteria found in both healthy and diseased conditions [1,3,16,46]. However, significant changes in the saliva microbiomes were observed, dependent on the type of sulfite exposure. Alterations of the Firmicutes/Bacteroidetes ratio, which is widely accepted to have an important influence in maintaining normal intestinal and mouth homeostasis [1,3,16], was observed with Na2SO3 but not with NaHSO3 (Fig 5). A more shifted microbial community structure (relative abundance), but only a slight increase in the species richness (p< 0.10) was observed in the Na2SO3 treated samples. However, NaHSO3 samples showed a much higher alpha-diversity (p<0.05) despite showing far fewer changes in relative abundance (Figs 6–8). These results contrast with the similar results found with both sulfites in the combined ATP assays from all individuals (Fig 1). As for beta diversity, the PCA plot (Fig 9) shows consistent changes in the oral microbial communities when comparing the control samples to the Na2SO3 treated samples, while no similar pattern was found in the NaHSO3 treated samples. These findings, along with our previous studies [24] seem to indicate a difference in the selective potency of these two types of sulfites. One possible explanation for the increase in alpha diversity with both sulfites might be due to the toxic effect on certain predominant bacterial species (thereby lowering their relative abundance) that may have then revealed the presence of other species normally present in populations too low to detect [47].
A comparison of the sequencing data to the ATP assays (Fig 4A and 4B) from individual “F2” samples, indicates a significant decrease in cell numbers with both sulfite treatments. However, a greater change was observed with Na2SO3 vs. NaHSO3. It is interesting to note that a decrease in [DNA] of treated samples from individual “F2” was observed, with an average decrease of 18% (p = 0.34) in sodium bisulfite and 56% (p = 0.05) in the sodium sulfite treated samples (S3 Appendix). While there are many factors that may lead to an observed difference in [DNA], this data supports our observation of a 30% and 40% average decrease in viable cells in respective samples.
It is well established that DNA from both, recently lysed, as well as living cells may be counted in 16S rRNA gene targeted sequencing [2]. The difference in observed changes (dependent on sulfite type), between our observed sequencing and ATP activity may indicate the quantitative change threshold of viable cells needed in order to detect significance, in this method of sequencing, effectively [47].
Conclusions
Our results show that sulfites have a clear and significant impact on some bacterium types found in the mouth. We hypothesize that sulfite susceptibility/metabolism differences allow some bacteria found in saliva to increase in numbers while others decrease. Bacteria that produce sulfur nucleotide reductase enzymes (SRB) or have other mechanisms to avoid oxidative stress, are better able to survive, while those that don’t will be more susceptible to sulfites toxic effects. The connections of H2S production from some SRB and its impact on both oral and intestinal inflammation and disease has been previously reported [39,40,42]. Susceptibility of different types of bacteria to lysozyme and the effects of sulfites on lysozyme activity may also be a factor.
To summarize, sulfite food preservatives appear to be affecting the makeup of the mouth microbiome by more than one mechanism including death by oxidative stress to non-SRB bacterial types and an energy source for SRB bacterial types.
Studies on the microbiomes found in or on the human body are complex and in constant flux due to the environment. The use of more than one cell detection method to measure changes in mixed populations of bacteria existing in the mouth is recommended for more accurate and sensitive assessments. ATP tests used to detect changes in the number of viable cells in saliva samples after exposure to either sulfite revealed a significant decrease in cells in all samples, whereas changes identified through 16s rRNA sequencing were less consistent between the samples depending on the type of sulfite tested. Future studies are indicated to include more individual’s samples for 16s rRNA sequencing to compare to ATP assays, to examine connections between diseases of the digestive process and the intake of sulfite preservatives.
Supporting information
ATP activity in F2 control samples.
(TIF)
(DOCX)
(XLSX)
(XLSX)
Acknowledgments
We would like to extend our appreciation for the helpful comments and review of the manuscript by our colleagues at UH Maui College STEM department including Tom Blamey who helped extensively with our statistical and graphing computations and retired professor Dr. Richard Allen who served as a mentor for students work and a consultant on the protein biochemistry work. We would also like to give our deep appreciation of his time for critical editing and data analysis consultations by Dr. Bret Bessac, Texas Tech University Health Sciences Center.
Data Availability
Data is available in manuscript, supplemental information and in the NCBI BioProjectdatabase https://www.ncbi.nlm.nih.gov/bioproject/PRJNA766452.
Funding Statement
SVI. PF. MG,JJ, RK, LD, FY This project was supported by grants from the National Institutes of Health (NIH), National Institute of General Medical Sciences (NIGMS), IDeA Networks of Biomedical Research Excellence (INBRE), Award number: P20GM103466. The content is solely the responsibility of the authors and do not necessarily represent the official views of the National Institutes of Health. https://www.nigms.nih.gov/research/drcb/IDeA/Pages/INBRE.aspxThe funders had no role in study design, data collection and analysis, decision to publish, or preparation of the manuscript. YD, YQ This work is partially supported by the NIH grants 5P30GM114737, 5P20GM103466, 5U54MD007601 and 5P30CA071789 https://grants.nih.gov/funding/index.htm The funders had no role in study design, data collection and analysis, decision to publish, or preparation of the manuscript.
References
- 1.Gao L., Xu T., Huang G., Jiang S., Gu Y., & Chen F. (2018). Oral microbiomes: more and more importance in oral cavity and whole body. Protein & Cell, 9(5), 488–500. doi: 10.1007/s13238-018-0548-1 Protein Cell [Internet]. 2018 [cited 2019 Apr 17];9(5):488–500. Available from: http://www.ncbi.nlm.nih.gov/pubmed/29736705. [DOI] [PMC free article] [PubMed] [Google Scholar]
- 2.Marotz C., Morton J. T., Navarro P., Coker J., Belda-Ferre P., Knight R., et al. (2021). Quantifying Live Microbial Load in Human Saliva Samples over Time Reveals Stable Composition and Dynamic Load. MSystems, 6(1). doi: 10.1128/mSystems.01182-20 [DOI] [PMC free article] [PubMed] [Google Scholar]
- 3.Verma D., Garg P. K., & Dubey A. K. (2018). Insights into the human oral microbiome. Archives of Microbiology 2018 200:4, 200(4), 525–540. doi: 10.1007/s00203-018-1505-3 [DOI] [PubMed] [Google Scholar]
- 4.Deo PN, Deshmukh R. Oral microbiome: Unveiling the fundamentals [Internet]. Vol. 23, Journal of Oral and Maxillofacial Pathology. Wolters Kluwer Medknow Publications; 2019. [cited 2021 Apr 22]. p. 122–8. Available from: https://www.ncbi.nlm.nih.gov/pmc/articles/PMC6503789/. doi: 10.4103/jomfp.JOMFP_304_18 [DOI] [PMC free article] [PubMed] [Google Scholar]
- 5.Belstrøm D, Holmstrup P, Bardow A, Kokaras A, Fiehn N-E, Paster BJ. Temporal Stability of the Salivary Microbiota in Oral Health. Burne RA, editor. PLoS One [Internet]. 2016. Jan 22 [cited 2019 Apr 15];11(1):e0147472. Available from: https://dx.plos.org/10.1371/journal.pone.0147472. doi: 10.1371/journal.pone.0147472 [DOI] [PMC free article] [PubMed] [Google Scholar]
- 6.Mandel AL, Peyrot des Gachons C, Plank KL, Alarcon S, Breslin PA. Individual differences in AMY1 gene copy number, salivary α-amylase levels, and the perception of oral starch. PLoS One. 2010. Oct 13;5(10):e13352. doi: 10.1371/journal.pone.0013352 https://pubmed.ncbi.nlm.nih.gov/20967220/. [DOI] [PMC free article] [PubMed] [Google Scholar]
- 7.Marsh P. D., Do T., Beighton D., & Devine D. A. (2016). Influence of saliva on the oral microbiota. Periodontology 2000, 70(1), 80–92. https://pubmed.ncbi.nlm.nih.gov/7227123/. [DOI] [PubMed] [Google Scholar]
- 8.Lynge Pedersen AM, Belstrøm D. The role of natural salivary defenses in maintaining a healthy oral microbiota. J Dent [Internet]. 2019;80(August 2018):S3–12. Available from: doi: 10.1016/j.jdent.2018.08.010 [DOI] [PubMed] [Google Scholar]
- 9.Ragland SA, Criss AK. From bacterial killing to immune modulation: Recent insights into the functions of lysozyme. Vol. 13, PLoS Pathogens. Public Library of Science; 2017. Available from doi: 10.1371/journal.ppat.1006512 [DOI] [PMC free article] [PubMed] [Google Scholar]
- 10.Acharya A., Chan Y., Kheur S., Jin L. J., Watt R. M., & Mattheos N. (2017). Salivary microbiome in non-oral disease: A summary of evidence and commentary. In Archives of Oral Biology (Vol. 83, pp. 169–173). Elsevier Ltd. doi: 10.1016/j.archoralbio.2017.07.019 [DOI] [PubMed] [Google Scholar]
- 11.Bescos R, Ashworth A, Cutler C, Brookes ZL, Belfield L, Rodiles A, et al. Effects of Chlorhexidine mouthwash on the oral microbiome. Sci Rep. 2020;10(1):1–8. Available from: doi: 10.1038/s41598-019-56847-4 [DOI] [PMC free article] [PubMed] [Google Scholar]
- 12.Ashworth A, Cutler C, Farnham G, Liddle L, Burleigh M, Rodiles A, et al. Dietary intake of inorganic nitrate in vegetarians and omnivores and its impact on blood pressure, resting metabolic rate and the oral microbiome. Free Radic Biol Med [Internet]. 2019;138(May):63–72. Available from: doi: 10.1016/j.freeradbiomed.2019.05.010 [DOI] [PubMed] [Google Scholar]
- 13.Yuan X, Long Y, Ji Z, Gao J, Fu T, Yan M, et al. Green Tea Liquid Consumption Alters the Human Intestinal and Oral Microbiome. Mol Nutr Food Res. 2018;62(12):1–15. Available from: doi: 10.1002/mnfr.201800178 [DOI] [PMC free article] [PubMed] [Google Scholar]
- 14.Hernandez B. Y., Zhu X., Goodman M. T., Gatewood R., Mendiola P., Quinata K., et al. (2017). Betel nut chewing, oral premalignant lesions, and the oral microbiome. PLoS ONE, 12(2). doi: 10.1371/journal.pone.0172196 [DOI] [PMC free article] [PubMed] [Google Scholar]
- 15.Mok SF, Karuthan C, Cheah YK, Ngeow WC, Rosnah Z, Yap SF, et al. The oral microbiome community variations associated with normal, potentially malignant disorders and malignant lesions of the oral cavity. Malays J Pathol. 2017. Apr;39(1):1–15. . [PubMed] [Google Scholar]
- 16.Stojanov S, Berlec A, Štrukelj B. The influence of probiotics on the firmicutes/bacteroidetes ratio in the treatment of obesity and inflammatory bowel disease. Microorganisms. 2020;8(11):1–16. doi: 10.3390/microorganisms8111715 [DOI] [PMC free article] [PubMed] [Google Scholar]
- 17.Cao Y, Liu H, Qin N, Ren X, Zhu B, Xia X. Impact of food additives on the composition and function of gut microbiota: A review. Trends Food Sci Technol [Internet]. 2020;99(March):295–310. Available from: doi: 10.1016/j.tifs.2020.03.006 [DOI] [Google Scholar]
- 18.Sugihara K, Morhardt TL, Kamada N. The Role of Dietary Nutrients in Inflammatory Bowel Disease. Front Immunol [Internet]. 2019. Jan 15 [cited 2019 Apr 15];9. Available from: https://www.frontiersin.org/article/10.3389/fimmu.2018.03183/full. doi: 10.3389/fimmu.2018.03183 [DOI] [PMC free article] [PubMed] [Google Scholar]
- 19.Langdon A, Crook N, Dantas G. The effects of antibiotics on the microbiome throughout development and alternative approaches for therapeutic modulation. Genome Med [Internet]. 2016;8(1):39. Available from: http://www.pubmedcentral.nih.gov/articlerender.fcgi?artid=4831151&tool=pmcentrez&rendertype=abstract. doi: 10.1186/s13073-016-0294-z [DOI] [PMC free article] [PubMed] [Google Scholar]
- 20.Vally H., Misso N. Adverse reactions to the sulphite additives. Gastroenterol Hepatol Bed Bench. 2012. 5(9), 16–23. Available from: https://www.ncbi.nlm.nih.gov/pmc/articles/PMC4017440/. [PMC free article] [PubMed] [Google Scholar]
- 21.Butler M. I., Cryan J. F., & Dinan T. G. (2019). Man and the Microbiome: A New Theory of Everything? Annual Review of Clinical Psychology, 15(1), 371–398. doi: 10.1146/annurev-clinpsy-050718-095432 [DOI] [PubMed] [Google Scholar]
- 22.Hrncirova L, Machova V, Trckova E, Krejsek J, Hrncir T. Food preservatives induce proteobacteria dysbiosis in human-microbiota associated Nod2-deficient mice. Microorganisms. 2019;7(10). Available from: doi: 10.3390/microorganisms7100383 [DOI] [PMC free article] [PubMed] [Google Scholar]
- 23.Leclercq C., Le Donne C., and Dr M.C.F. Toledo M.C.F., Sulfites: assessment of dietary exposure. WHO Food Addit Ser IPCS—(SAFETY evaluation of certain food additives) 2009; 60: 221–244.Available from: http://apps.who.int/iris/bitstream/10665/44063/1/9789241660600_eng.pdf. [Google Scholar]
- 24.Irwin SV, Fisher P, Graham E, Malek A, Robidoux A. Sulfites inhibit the growth of four species of beneficial gut bacteria at concentrations regarded as safe for food. PLoS One. 2017. Oct 18;12(10):e0186629. doi: 10.1371/journal.pone.0186629 ; PMCID: PMC5646858. 10.1371/journal.pone.0186629. [DOI] [PMC free article] [PubMed] [Google Scholar]
- 25.Hammes F, Goldschmidt F, Vital M, Wang Y, Egli T. Measurement and interpretation of microbial adenosine tri-phosphate (ATP) in aquatic environments. Water Res [Internet]. 2010;44(13):3915–23. Available from: doi: 10.1016/j.watres.2010.04.015 [DOI] [PubMed] [Google Scholar]
- 26.Maiden MM, Zachos MP, Waters CM. The ionophore oxyclozanide enhances tobramycin killing of Pseudomonas aeruginosa biofilms by permeabilizing cells and depolarizing the membrane potential. J Antimicrob Chemother [Internet]. 2019;74(4):894–906. Available from: https://academic.oup.com/jac/article/74/4/894/5280826. doi: 10.1093/jac/dky545 [DOI] [PMC free article] [PubMed] [Google Scholar]
- 27.Cai Y, Leck H, Lim TP, Teo J, Lee W, Hsu LY, et al. Using an adenosine triphosphate bioluminescent assay to determine effective antibiotic combinations against carbapenem-resistant gram negative bacteria within 24 hours. PLoS One [Internet]. 2015;10(10):1–15. Available from: doi: 10.1371/journal.pone.0140446 [DOI] [PMC free article] [PubMed] [Google Scholar]
- 28.Pothineni VR, Wagh D, Babar MM, Inayathullah M, Solow-Cordero D, Kim KM, et al. Identification of new drug candidates against Borrelia burgdorferi using high-throughput screening. Drug Des Devel Ther. 2016. Apr 1;10:1307–22. Available from: doi: 10.2147/DDDT.S101486 [DOI] [PMC free article] [PubMed] [Google Scholar]
- 29.Brewster JD. A simple micro-growth assay for enumerating bacteria. J Microbiol Methods. 2003;53(1):77–86. Available from: doi: 10.1016/s0167-7012(02)00226-9 [DOI] [PubMed] [Google Scholar]
- 30.Callahan BJ, McMurdie PJ, Rosen MJ, Han AW, Johnson AJ, Holmes S, (2016) DADA2: High resolution sample inference from Illumina amplicon data. Nat Methods 13(7):581–3. Available from doi: 10.1038/nmeth.3869 [DOI] [PMC free article] [PubMed] [Google Scholar]
- 31.Dixon P. (2003). Computer program review VEGAN, a package of R functions for community ecology. In Journal of Vegetation Science (Vol. 14). Opulus Press; Uppsala. http://cran.r-project.org. [Google Scholar]
- 32.Harrison A, Bakaletz LO, Munson RS. Haemophilus influenzae and oxidative stress. Front Cell Infect Microbiol. 2012;2(March):40. doi: 10.3389/fcimb.2012.00040 [DOI] [PMC free article] [PubMed] [Google Scholar]
- 33.Tanabe SI, Grenier D. Characterization of volatile sulfur compound production by Solobacterium moorei. Arch Oral Biol. 2012. Dec;57(12):1639–43. doi: 10.1016/j.archoralbio.2012.09.011 [DOI] [PubMed] [Google Scholar]
- 34.Downes J, Dewhirst FE, R Tanner AC, Wade WG, William Wade CG. IUMS Printed in Great Britain. Int J Syst Evol Microbiol [Internet]. 2013;63:1214–8. Available from: www.homd.org/taxon=302. doi: 10.1099/ijs.0.041376-0 [DOI] [PMC free article] [PubMed] [Google Scholar]
- 35.Ren W, Xun Z, Wang Z, Zhang Q, Liu X, Zheng H, et al. Tongue Coating and the Salivary Microbial Communities Vary in Children with Halitosis. Nat Publ Gr [Internet]. 2016; Available from: www.nature.com/scientificreports. doi: 10.1038/srep24481 [DOI] [PMC free article] [PubMed] [Google Scholar]
- 36.Washio J., Shimada Y., Yamada M., Sakamaki R., & Takahashi N. (2014). Effects of pH and lactate on hydrogen sulfide production by oral Veillonella spp. Applied and environmental microbiology, 80(14), 4184–4188. doi: 10.1128/AEM.00606-14 [DOI] [PMC free article] [PubMed] [Google Scholar]
- 37.Nair B, Elmore AR. Final report on the safety assessment of sodium sulfite, potassium sulfite, ammonium sulfite, sodium bisulfite, ammonium bisulfite, sodium metabisulfite and potassium metabisulfite. Int J Toxicol. 2003;22 Suppl 2:63–88. Available from https://www.ncbi.nlm.nih.gov/pubmed/14555420 [Accessed 6 February 2017]. doi: 10.1080/10915810305077x [DOI] [PubMed] [Google Scholar]
- 38.Seetaramaiah K, Smith AA, Murali R, Manavalan R. Preservatives in Food Products—Review. Int J Pharm Biol Arch. 2011;2(2):583–99. Available from: http://www.ijpba.info/ijpba/index.php/ijpba/article/viewFile/236/. [Google Scholar]
- 39.Kushkevych I, Coufalová M, Vítězová M, Rittmann SK-MR. Sulfate-Reducing Bacteria of the Oral Cavity and Their Relation with Periodontitis—Recent Advances. J Clin Med. 2020. Jul 23;9(8):2347. Available from: doi: 10.3390/jcm9082347 [DOI] [PMC free article] [PubMed] [Google Scholar]
- 40.Kushkevych I, Cejnar J, Treml J, Dordević D, Kollar P, Vítězová M. Recent Advances in Metabolic Pathways of Sulfate Reduction in Intestinal Bacteria. Vol. 9, Cells. NLM (Medline); 2020. Available from: doi: 10.3390/cells9030698 [DOI] [PMC free article] [PubMed] [Google Scholar]
- 41.Oshimo M., Nakashima F., Kai K., Matsui H., Shibata T., & Akagawa M. (2021). Sodium sulfite causes gastric mucosal cell death by inducing oxidative stress. Free Radical Research. https://pubmed.ncbi.nlm.nih.gov/7227123/. doi: 10.1080/10715762.2021.1937620 [DOI] [PubMed] [Google Scholar]
- 42.Coutinho CMLM, Coutinho-Silva R, Zinkevich V, Pearce CB, Ojcius DM, Beech I. Sulphate-reducing bacteria from ulcerative colitis patients induce apoptosis of gastrointestinal epithelial cells. Microb Pathog. 2017;112:126–34. doi: 10.1016/j.micpath.2017.09.054 [DOI] [PubMed] [Google Scholar]
- 43.Neyraud E, Palicki O, Schwartz C, Nicklaus S, Feron G. Variability of human saliva composition: possible relationships with fat perception and liking. Arch Oral Biol. 2012. May;57(5):556–66. doi: 10.1016/j.archoralbio.2011.09.016 Epub 2011 Oct 22. . [DOI] [PubMed] [Google Scholar]
- 44.Richter J, Král V, Zukov I, Subrt P, Rahm J. Circadian changes of the SIgA, lysozyme, albumin and copper content of saliva. Czech Med. 1980;3(4):249–54. [PubMed] [Google Scholar]
- 45.Neta P, Huie RE. Free-radical chemistry of sulfite. Environ Health Perspect [Internet]. 1985;VOL. 64:209–17. Available from: doi: 10.1289/ehp.8564209 [DOI] [PMC free article] [PubMed] [Google Scholar]
- 46.Pushalkar S., Ji X., Li Y., Estilo C., Yegnanarayana R., Singh B., et al. (2012). Comparison of oral microbiota in tumor and non-tumor tissues of patients with oral squamous cell carcinoma. BMC Microbiology, 12(144). doi: 10.1186/1471-2180-12-144 [DOI] [PMC free article] [PubMed] [Google Scholar]
- 47.Caruso V, Song X, Asquith M, Karstens L. Performance of Microbiome Sequence Inference Methods in Environments with Varying Biomass. mSystems [Internet]. 2019. Feb 26 [cited 2021 Sep 2];4(1). Available from: doi: 10.1128/mSystems.00163-18 [DOI] [PMC free article] [PubMed] [Google Scholar]


