

Abstract
Autonomic nerves control organ function through the sympathetic and parasympathetic branches, which have opposite effects. In the bone marrow, sympathetic (adrenergic) nerves promote hematopoiesis; however, how parasympathetic (cholinergic) signals modulate haematopoiesis is unclear. Here we show that B lymphocytes were an important source of acetylcholine, a neurotransmitter of the parasympathetic nervous system which reduced hematopoiesis. Single cell RNA sequencing identified 9 clusters of cells that expressed the acetylcholine receptor Chrna7 in the bone marrow stem cell niche, including endothelial and mesenchymal stromal cells. Deletion of B cell-derived acetylcholine resulted in the differential expression of various genes, including Cxcl12 in LepR+ stromal cells. Pharmacologic inhibition of acetylcholine signaling increased the systemic supply of inflammatory myeloid cells in mice and patients with cardiovascular disease.
The autonomic nervous system (ANS) directs the involuntary functions of most organs. Typically, the sympathetic and parasympathetic branches of ANS exert opposing influences to meet the physiologic needs of either preparing the organism for various challenges or modulating recovery and sustenance. Beyond its functions in health, the ANS profoundly influences disease1, including hypertension2, heart failure3 and arrhythmias4. In these particular cases, sympathetic tone prevails, leading to vasoconstriction, fluid retention, cardiac hypertrophy and heart failure. Crosstalk between the ANS and the immune system is relevant for cardiovascular and other diseases and could be mediated by leukocyte sensing of neurotransmitters via specific adrenergic (sympathetic) and cholinergic (parasympathetic) receptor subtypes5. The cholinergic α7 nicotinic receptor (Chrna7), which is expressed not only by neurons, endothelial cells6 and fibroblasts7 but also leukocytes such as macrophages8 senses the parasympathetic neurotransmitter acetylcholine. In neurons and muscle cells, signalling through Chrna7 opens calcium channels and depolarizes the postsynaptic cell7, while leukocytes respond by suppressing cytokine and antibody production8,9. Adrenergic signaling synchronizes the production and migration of blood cells with circadian rhythms through sympathetic nerve fiber release of noradrenaline, which interacts with β3 adrenergic receptors expressed by hematopoietic niche cells10. However, how peripheral cholinergic signaling affects blood cell production is not known11. We report here that bone marrow lymphocytes signal via acetylcholine to hematopoietic niche cells, thus curtailing immune cell production in steady state and their supply in disease.
Results
Acetylcholine reduces circulating leukocytes in mice and humans
To explore if cholinergic signaling influences hematopoiesis, we retrospectively assessed leukocyte counts in patients undergoing treatment with donepezil. This drug is prescribed for Alzheimer’s disease and increases the availability of acetylcholine by inhibiting acetylcholine esterase, an enzyme that degrades acetylcholine. The initial cohort comprised patients from the Mass General Brigham hospital who took either a 5mg or 10mg daily dose of donepezil between Jan 1, 2009 and Dec 31, 2018 (n=9,491). Patients were entered in the analysis if they had valid leukocyte counts within one month prior to starting donepezil and 3 months post-initiation of treatment (5mg, n = 996; 10mg, n = 821). Control samples were obtained from the same patients 2–8 weeks apart in the year prior to starting donepezil (n = 870). Paired leukocyte counts closest to 4 weeks apart were chosen for analysis. Administration of donepezil was associated with a significant dose-dependent decrease in the number of leukocytes compared to paired control samples obtained without treatment (Figure 1a), indicating that acetylcholine affects the supply of white blood cells. Treatment with donepezil also associated with decreased red blood cell counts and increased platelet counts compared to paired control samples obtained without treatment (Extended Data Figure 1a). To explore the causality of the association between donepezil and leukocyte counts, we treated wild-type C57BL/6 mice with pyridostigmine bromide (PB), an acetylcholine esterase inhibitor. In the blood, treatment with 10mg/kg PB per day for 4 weeks reduced the number of CD45+ leukocytes, including CD11b+Ly6Chi monocytes and CD19+ B cells, compared to saline treated controls, while Ly6G+ neutrophils, CD3+ T cells, CD41+CD61+ platelets and CD71+Ter119+ erythrocytes were unchanged (Figure 1b, c). Analyzing hematopoiesis in these mice indicated that compared to saline-treated controls, PB treatment reduced colony forming unit formation (CFU-C in the blood and CFU-GM in the bone marrow, Figure 1d, e). Flow cytometry comparison to saline treated mice indicated that PB treatment lowered the number of Lin−Sca+C-kit+CD150+CD48− LSK (hereafter SLAM LSK) and Lin−C-kit+Sca1−CD16/32intCD34+ common myeloid progenitors (hereafter CMP) in the femur, while this trend did not reach significance for Lin−Sca+C-kit+ LSK (hereafter LSK, Figure 1f-h). We assessed SLAM LSK proliferation by flow cytometric staining for BrdU incorporation, which was decreased in PB treated mice when compared to saline controls, while proliferation was unchanged in LSK and CMP (Figure 1i). Four weeks of PB treatment did not alter the numbers of C-kit+CD105+CD71+ erythrocyte progenitors, CD41+ megakaryocyte progenitors or C-kitloSca1loIL7Ra+ common lymphocyte progenitors compared to saline-treated controls (Figure 1j). In the bone marrow, PB reduced the number of CD3+ T cells and CD71+Ter119+ erythrocytes compared to saline controls while trends for CD11b+CD115+Ly6Chi monocytes, Ly6G+ neutrophils, CD19+ B cells and CD41+CD61+ platelets did not reach statistical significance (Figure 1k, l). These data indicate that acetylcholine esterase inhibition, which augments acetylcholine levels, reduces hematopoiesis.
Fig. 1 |. Acetylcholine curbs steady-state hematopoiesis.

a. Leukocyte counts (WBC) in 2,687 patients who received either no (n=870), 5mg (n=996) or 10mg (n=821) donepezil daily. Mean change of white blood cell counts (WBC) between 4 weeks before and 3 months after treatment onset. P = 0.0128 for no donepezil group vs. 5mg donepezil group, P = 0.0001 for no donepezil group vs. 10mg donepezil group and P = 0.0191 for 5mg donepezil group vs. 10mg donepezil group. One-way ANOVA with Sidak’s post hoc test. Box shows 25th, 50th and 75th percentile without whiskers or outliers, blue dot represents mean.
b. Circulating leukocytes in C57BL/6 mice 4 weeks after saline or pyridostigmine treatment. P = 0.0066 for leukocytes, P = 0.0062 for monocytes, P = 0.0044 for Ly6Chigh monocytes, P = 0.0021 for B cells. Two independent experiments, n = 10 saline, n = 8 mice pyridostigmine group, two-tailed Mann-Whitney test.
c. Circulating RBC and platelets 4 weeks after saline or pyridostigmine treatment. One experiment, n = 7 saline, n = 7 mice pyridostigmine group, two-tailed Mann-Whitney test.
d. Circulating hematopoietic stem and progenitor cells (HSPC) measured by c.f.u. assay. P = 0.0134. Two independent experiments, n = 11 saline, n = 8 mice pyridostigmine group, two-tailed Student’s t-test.
e. C.f.u. assay of bone marrow mononuclear cells (BMNC) for granulocyte and macrophage progenitors (GM). P = 0.0074. Two independent experiments, n = 11 saline, n = 8 mice pyridostigmine, two-tailed Student’s t-test.
f. Flow cytometry plots for HSPC.
g. Flow cytometry plots for BrdU incorporation.
h. Bone marrow HSPC enumeration by flow cytometry. P = 0.0038 for SLAM LSK, P = 0.0346 for CMP. Two independent experiments, n = 11 saline, n = 7 mice pyridostigmine group, two-tailed Mann-Whitney test.
i. Bone marrow HSPC proliferation analyzed by BrdU incorporation using flow cytometry. P = 0.0365 for SLAM LSK. Two independent experiments, n = 11 saline, n = 6 mice pyridostigmine, two-tailed Mann-Whitney test.
j. Bone marrow megakaryocyte-erythrocyte progenitors (MEP), erythrocyte progenitors, megakaryocyte progenitors and common lymphoid progenitors (CLP) using flow cytometry. One experiment, n = 9 saline, n = 10 mice pyridostigmine, two-tailed Mann-Whitney test.
k. Leukocytes in femur assessed by flow cytometry. P = 0.008 for T cells. Two independent experiments, n = 11 saline, n = 8 mice pyridostigmine, two-tailed Student’s t-test.
l. Platelets and erythrocytes in femur assessed by flow cytometry. P = 0.0284 for erythrocytes. One experiment, n = 7 each group, two-tailed Student’s t-test.
Data are mean ± SEM with individual values for data distribution, *P<0.05 and **P<0.01.
Chat+ B cells produce acetylcholine in the bone marrow
To investigate whether acetylcholine production occurs in the bone marrow, we used ChatGFP mice, which express green fluorescent protein (GFP) under the promotor for choline acetyltransferase (Chat), an enzyme essential for the synthesis of acetylcholine5. ChatGFP mice enable the detection of cholinergic neurons as elongated GFP+ cells12. While cholinergic nerves innervate the bone mass13, it has been reported they might be absent from the hematopoietic marrow14. We detected GFP+ nerve fibers in the cortical areas of femur bones of ChatGFP mice but did not observe GFP+ nerve fibers in the marrow (Extended Data Figure 1b, Supplementary Videos 1, 2). Instead, we detected round GFP+ cells adjacent to the marrow vasculature (Figure 2a, b). Because the shape and mean diameter of 7.9±0.29µm of the GFP+ cells resembled that of leukocytes, and leukocytes express Chat15–17, we used flow cytometry to profile GFP+ cells in the bone marrow. CD19+B220+ B lymphocytes were the most abundant GFP+ cells (Figure 2c-d, Extended Data Figure 2a-e). GFP expression was also detected in a fraction of bone marrow CD4+ T cells (Extended Data Figure 2d). All other leukocytes, hematopoietic stem and progenitor cells (HSPC) and non-hematopoietic bone marrow cells, such as stromal mesenchymal and endothelial cells, did not exhibit GFP+ signal (Extended Data Figure 2e-h). Quantitative real-time PCR in sorted bone marrow cells indicated that Chat mRNA expression in CD19+GFP+ B cells was 11-fold higher than in CD19+GFP− B cells and absent in stromal cells (Extended Data Figure 2i). Confocal microscopy of the skull and femur bone marrow detected the coexpression of GFP with the B cell marker B220 in ChatGFP mice (Figure 2b, Extended Data Figure 2j, k). Intracellular flow cytometry staining indicated that human bone marrow also contained mature CD19+ CD20+ B cells that expressed choline acetyltransferase (Figure 2e). Because in cholinergic nerve fibers acetylcholine typically localizes in small vesicles18, we used electron microscopy to compare CD19+B220+GFP− and CD19+B220+GFP+ B cells sorted from the bone marrow of ChatGFP mice. Vesicles of similar shape and size as acetylcholine-containing vesicles in the neuromuscular junction18 were more numerous in GFP+ B cells compared to GFP− B cells (Figure 2f), suggesting that B cells may store acetylcholine within intracellular vesicles. RNA sequencing indicated that only two genes, Sirpα and Ki-67 (false discovery rate < 0.05), were differentially expressed between CD19+B220+GFP− and CD19+B220+GFP+ B cells sorted from the bone marrow of ChatGFP mice (Figure 2g, h). Gene set enrichment analysis indicated that GFP+ B cells proliferated more than GFP− B cells (Figure 2i), in accordance with their increased expression of Ki-67, and as confirmed by flow cytometric cell cycle analysis (Figure 2j, Extended Data Figure 2l, m).
Fig. 2 |. Acetylcholine is produced by bone marrow B lymphocytes.

a. Confocal microscopy of the femur of ChatGFP mice. Bone structure is outlined by Osteosense-750 staining, endothelial cells by CD31/Sca-1. Arrows indicate GFP+ cells. Experiment was repeated 4 independent times with similar result. Left scale bar 60, right 30µm.
b. Intravital microscopy of the skull in ChatGFP mice. Endothelial cells are labeled by CD31/Sca-1 and B cells by B220 antibody. Arrow indicates a GFP+ B cell. The experiment was repeated 2 independent times with a similar result. Scale bar, 10µm.
c. Flow cytometry quantification of GFP+ B cells in the bone marrow of ChatGFP mice. C57BL/6 mice were used for defining gates. One independent experiment, n = 3 mice.
d. Upper, relative GFP+ cell abundance in femur of ChatGFP mice assessed by flow cytometry. Up to four independent experiments, n = 12 mice for mature B cells; n = 7 for immature B cells, pro B cells, pre B cells and pre-pro B cells; n = 5 mice for CD4+ T cells and CD8+ T cells; n = 3 mice for macrophages, NK cells, Ly6Clow monocytes, Ly6Chigh monocytes, LK cells, neutrophils, LSK cells and LK cells. Lower, absolute GFP+ cell abundance in femur of ChatGFP mice by flow cytometry. Four independent experiments, n = 7 mice for mature B cells; n = 5 for CD4+ T cells and CD8+ T cells; n = 3 for immature B cells, pro B cells, pre B cells, pre-pro B cells, macrophages, NK cells, Ly6Clow monocytes, Ly6Chigh monocytes, LK cells, neutrophils, LSK cells and LK cells.
e. Flow cytometry of human bone marrow. The experiment was performed once.
f. Left, electron microscopy of FACS-sorted GFP− and GFP+ B cells from the bone marrow of ChatGFP mice. Arrows indicate intracellular vesicles. Right, quantification of vesicles within the Golgi and non-Golgi region. 1 region of interest (ROI) per cell was analyzed for the Golgi region and 3 ROI per cell for the non-Golgi region. P = 0.0328 for Golgi, P = 0.0011 for non-Golgi. Data are mean ± SEM, n = 4 mice (Golgi region, 52 GFP+ cells, 53 GFP− cells; non-Golgi region: GFP+ 156 cells, 159 GFP− cells), two-tailed Mann-Whitney test.
g. Flow cytometry plots of GFP+ and GFP− mature B cells isolated from the femur of ChatGFP mice for bulk RNA sequencing.
h. Differentially expressed genes in GFP+ and GFP− mature B cells by bulk RNA sequencing. Annotated genes are significantly differentially expressed (FDR<0.05).
i. Gene set enrichment analysis (gene sets “HALLMARK_G2M_CHECKPOINT” and “HALLMARK_E2F_TARGETS”) of GFP+ and GFP− mature B cells.
j. Left, flow cytometry plots for cell cycle analysis of GFP+ and GFP− B cells in femur of ChatGFP mice. Right, cell cycle analysis by flow cytometry. P = 0.0286. n = 4 mice per group, two-tailed Mann-Whitney test.
k. CD45.1 and CD45.2 ChatGFP mice underwent parabiosis for 16 weeks. Left, flow cytometry dot plots blood chimerism in CD45.1 parabiont. Right, percentage of CD45.1+ and CD45.2+ mature B cells in circulation of CD45.1 parabiont. n = 7 mice per group, two-tailed Mann-Whitney test.
l. Left, flow cytometry plots of GFP expression by circulating B cells in CD45.1 parabiont.
Right, percentage of circulating GFP+ B cells of all B cells in the CD45.1 and CD45.2 ChatGFP parabionts. Two independent experiments, n = 7 mice per group, two-tailed Mann-Whitney test.
m. Left, flow cytometry plots of GFP expression by mature B cells in the bone marrow of CD45.1 parabionts. Right, percentage of GFP+ B cells of all B cells in bone marrow of CD45.1 and ChatGFP CD45.2 parabionts. Two independent experiments, n = 7 mice per group, two-tailed Mann-Whitney test. Data are mean ± SEM with individual values for data distribution, *P<0.05 and **P<0.01.
B220+GFP+ B cells were detected in the blood of ChatGFP mice (Extended Data Figure 2n, o), consistent with prior reports16. To examine whether GFP+ B cells migrate from the blood to the bone marrow, we joined the circulation of CD45.2 ChatGFP and CD45.1 mice in parabiosis. A complete equilibrium of B220+ B cells was detected in the blood after 16 weeks of parabiosis (Figure 2k). We found parabiont-derived CD45.2+GFP+ B cells in the blood of CD45.1 mice at levels comparable to those in ChatGFP mice (Figure 2l). A similar CD45.2+GFP+ B cell chimerism in the bone marrow of both parabionts (Figure 2m) indicated that circulating GFP+ B cells equilibrated with their counterparts in the bone marrow. Taken together, these data indicated that B cells were the primary source of acetylcholine in the bone marrow.
B cell-derived acetylcholine curbs steady-state hematopoiesis
To test the functional importance of B cell-derived acetylcholine in the bone marrow, we generated Cd19CreChatfl/fl mice, in which choline acetyltransferase, essential for producing acetylcholine5, was conditionally deleted in B cells. Mass spectrometry performed on whole bone marrow indicated there was a 3.6-fold reduction in the amount of acetylcholine in the bone marrow of Cd19CreChatfl/fl compared to Chatfl/fl littermate controls, while the abundance of noradrenaline was similar (Figure 3a). The number of CD45+ leukocytes, in particular the number of Ly6Chi and Ly6Clo monocytes, Ly6G+ neutrophils and B220+ B cells, was increased in the blood of Cd19CreChatfl/fl mice compared to Chatfl/fl mice while the number of T cells, erythrocytes and platelets was similar in Cd19CreChatfl/fl and Chatfl/fl mice (Figure 3b-d), suggesting that specific leukocyte lineages were affected. There was no difference in body weight, blood pressure and heart rate between Cd19CreChatfl/fl and Chatfl/fl mice (Extended Data Figure 3a).
Fig. 3 |. Acetylcholine curbs steady-state hematopoiesis.
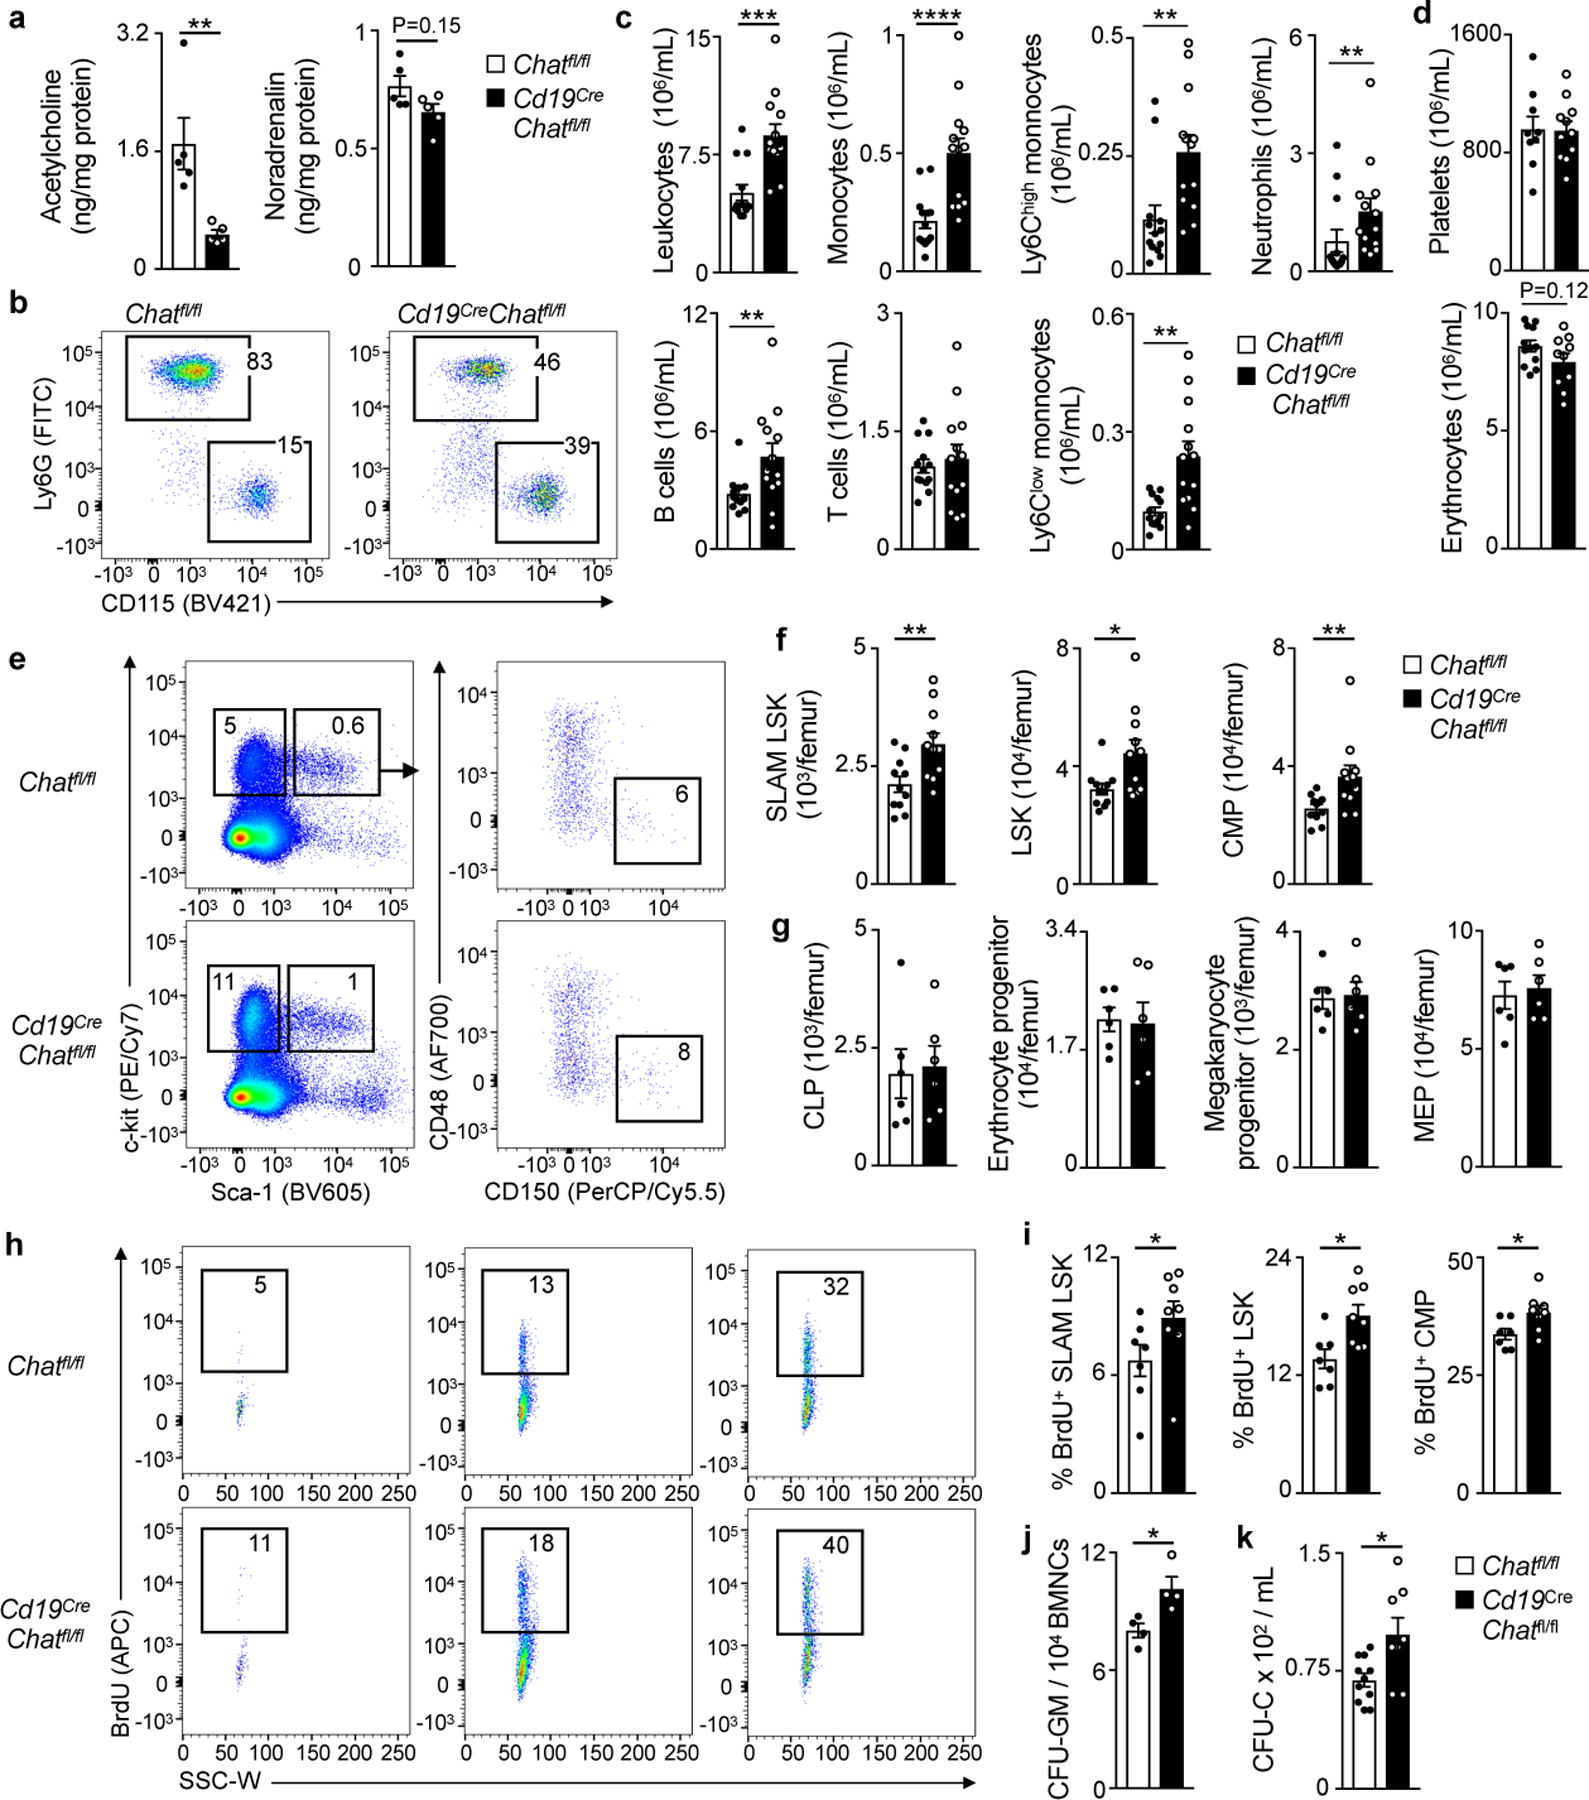
a. Bone marrow acetylcholine and noradrenaline in naive Chatfl/fl or Cd19CreChatfl/fl mice measured by mass spectrometry. P = 0.0079 for the acetylcholine. n = 5 mice per group, two-tailed Mann-Whitney test.
b. Flow cytometry plots for circulating myeloid cells.
c. Leukocytes in blood measured by flow cytometry. P = 0.0001 for leukocytes, P = 0.0001 for monocytes, P = 0.0023 for Ly6Chigh monocytes, P = 0.0012 for Ly6Clow monocytes, P = 0.0086 for B cells. Three independent experiments, n = 13 mice, two-tailed Mann-Whitney test.
d. Platelets and erythrocytes in circulation measured by flow cytometry. Three independent experiments, erythrocytes: n = 10 Chatfl/fl, n = 8 Cd19CreChatfl/fl mice; platelets: n = 9 mice per group, two-tailed Student’s t-test.
e. Flow cytometry plots for HSPC.
f. Bone marrow HSPC enumeration using flow cytometry. P = 0.0267 for LSK, P = 0.015 for SLAM LSK, P = 0.0052 for CMP. Three independent experiments, n = 11 mice per group, two-tailed Mann-Whitney test.
h. Flow cytometry plots for BrdU incorporation.
i. Bone marrow HSPC proliferation analyzed by BrdU incorporation using flow cytometry. P = 0.0289 for LSK, P = 0.0315 for SLAM LSK, P = 0.0193 for CMP. Two independent experiments, n = 7 Chatfl/fl and n = 8 Cd19CreChatfl/fl mice, two-tailed Mann-Whitney test.
j. C.f.u. assay of bone marrow mononuclear cells (BMNC) for granulocytes and macrophage progenitors (GM). P = 0.0286. n = 4 mice per group, two-tailed Mann-Whitney test.
k. Circulating HSPC measured by c.f.u. assay in blood. P = 0.0188. Two independent experiments, n = 11 Chatfl/fl and n = 8 Cd19CreChatfl/fl mice, two-tailed Student’s t-test.
Data are mean ± SEM with individual values for data distribution, *P<0.05, **P<0.01 and ***P<0.001.
The number of haematopoietic progenitors, including SLAM LSK, which can give rise to all blood cells19, LSK, which contain SLAM LSK but also downstream progenitors with reduced repopulation potential, and CMP, which give rise to all myeloid cells, was higher in Cd19CreChatfl/fl compared to Chatfl/fl bone marrow, while the number of lymphoid, erythroid and platelet progenitors were similar in Cd19CreChatfl/fl and Chatfl/fl mice (Figure 3e-g). Next, we measured the proliferation of SLAM LSK, LSK and CMP isolated from Cd19CreChatfl/fl and Chatfl/fl bone marrow using flow cytometric quantification of BrdU incorporation. SLAM LSK, LSK and CMP from Cd19CreChatfl/fl mice proliferated more compared to their Chatfl/lf counterparts (Figure 3h, i). In addition, colony-forming assays indicated that the CFU-GM capacity of Cd19CreChatfl/fl whole bone marrow was higher than that of Chatfl/fl bone marrow (Figure 3j), indicating increased myelopoiesis in absence of acetylcholine from B cells. Cell cycle analysis using flow cytometry also indicated that more SLAM LSK and LSK actively cycled in Cd19CreChatfl/lf compared to Chatfl/fl controls (Extended Data Figure 3b). Transplantation of limiting dilutions ranging from 1 to 500 SLAM LSK sorted from Cd19CreChatfl/fl or Chatfl/fl mice into lethally-irradiated C57BL/6 recipients showed that functional HSC frequencies were trending lower in Cd19CreChatfl/fl compared to Chatfl/fl mice, although this did not reach statistical significance (Extended Data Figure 3c, d). These results indicated that B cell-derived acetylcholine reduced the proliferation of HSPC.
We then assayed CFU of whole blood, comparing Cd19CreChatfl/fl mice with Chatfl/fl mice, to quantify HSPC release from hematopoietic tissues. The number of CFU-C were higher in Cd19CreChatfl/fl mice than Chatfl/fl mice (Figure 3k) indicating that Chat expression in B cells promoted HSPC retention in the marrow. When we compared extravasation of intravenously injected Evans blue into the bone marrow of Cd19CreChatfl/fl and Chatfl/fl mice, we observed increased vascular permeability in Cd19CreChatfl/fl mice (Extended Data Figure 3e), which could support increased cell release into the blood in the absence of B cell-derived acetylcholine.
Because acetylcholine signaling between lymphocytes and macrophages in the spleen has an anti-inflammatory role8,20, we examined the contribution of the spleen to the increase in the number of leukocytes in Cd19CreChatfl/fl mice. The protein level of IL-4, IL-12, IL-13, MCP1, MCP5, TPO, CCL5 and TMFRI in the spleen, blood or bone marrow was similar in Cd19CreChatfl/fl and Chatfl/fl mice (Extended Data Fig. 4a) while the splenic number of SLAM LSK, LSK, CMP, neutrophils and monocytes was reduced in Cd19CreChatfl/fl compared to Chatfl/fl mice (Extended Data Fig. 4b, c). Vascular permeability was increased in the spleen in Cd19CreChatfl/fl mice compared to Chatfl/fl mice (Extended Data Fig. 4d), suggesting decreased immune cell retention in the spleen. Splenectomy did not affect the amounts of IL-4, IL-12, IL-13, MCP1, MCP5, TPO, CCL5 and TNFRI protein in the bone marrow of Chatfl/fl or Cd19CreChatfl/fl mice when compared to sham-operated Chatfl/fl or Cd19CreChatfl/fl mice (Extended Data Fig. 5a). Bone marrow hematopoiesis in Cd19CreChatfl/fl mice was increased when compared to Chatfl/fl in both, splenectomised and sham-operated mice (Extended Data Fig. 5b-e). Together, these data indicated that B cell-derived acetylcholine modulated steady-state hematopoiesis and this effect was independent of long-distance signaling between splenic B cells and the bone marrow.
Chrna7+ bone marrow stromal cells sense acetylcholine
Given the relevance of the acetylcholine receptor Chrna7 in cardiovascular disease and hematopoiesis21, we next examined Chrna7−/− mice, in which we found higher levels of circulating Ly6Chi monocytes, Ly6G+ neutrophils and CD71+Ter119+ erythrocytes but unchanged platelet counts when compared to C57BL/6 wild-type controls (Figure 4a). By flow cytometry, we found higher bone marrow numbers of SLAM LSK, LSK, and CMP but similar numbers of C-kit+Sca1−CD34− megakaryocyte-erythrocyte progenitors, CD41+ megakaryocyte progenitors, C-kit+CD105+Cd71+ erythrocyte progenitors and C-kitloSca1loIL7Ra+ CLP in Chrna7−/− mice compared to wild type controls (Figure 4b-d). We next performed colony-forming units (CFU-C and CFU-GM) in the blood and bone marrow, which showed more numerous colonies in Chrna7−/− mice compared to wild-type controls (Figure 4e, f). Assessing proliferation with intracellular staining for BrdU incorporation, we documented elevated SLAM LSK proliferation in Chrna7−/− compared to C57BL/6 wild-type mice (Figure 4g). Next, we transplanted wild-type C57BL/6 whole bone marrow cells into lethally-irradiated Chrna7−/− or wild-type C57BL/6 control mice. Sixteen weeks after transplantation, SLAM LSK numbers and BrdU incorporation were higher in Chrna7−/− recipients compared to wild-type recipients (Figure 4h, i). At the same time point, we found higher numbers of CD45+ leukocytes, CD11b+CD115+ monocytes and Ly6G+ neutrophils in the blood of Chrna7−/− recipients compared to wild-type recipients (Figure 4j). These data indicated that acetylcholine influenced hematopoiesis through signaling to stromal niche cells.
Fig. 4 |. Chrna7+ receptor curbs steady-state hematopoiesis.

a. Blood leukocytes, erythrocytes and platelets measured by flow cytometry or blood counter. P = 0.0270 for neutrophils, P = 0.0407 for Ly6Chigh monocytes, P = 0.0476 for erythrocytes. Three independent experiments, n = 12 C57BL/6 and n = 14 Chrna7−/− mice, two-tailed Mann-Whitney test.
b. Flow cytometry plots for HSPC.
c. Bone marrow HSPC enumeration using flow cytometry. P = 0.0056 for LSK, P = 0.0411 for SLAM LSK, P = 0.0004 for CMP. Two independent experiments, n = 10 C57BL/6, n = 9 Chrna7−/− mice, two-tailed Student’s t-test.
d. Enumeration of bone marrow megakaryocyte-erythrocyte progenitors (MEP), erythrocyte progenitors, megakaryocyte progenitor and common lymphoid progenitors (CLP) using flow cytometry. n = 5 mice per group, two-tailed Mann-Whitney test.
e. Circulating HSPC by c.f.u. assay in blood. P = 0.0026. Two independent experiments, n = 9 C57BL/6, n = 11 Chrna7−/− mice, two-tailed Student’s t-test.
f. C.f.u. assay of bone marrow mononuclear cells (BMNC) for granulocyte and macrophage progenitors (GM). P = 0.0187. Two independent experiments, n = 9 mice per group, two-tailed Student’s t-test.
g. Upper, flow cytometry plots for BrdU incorporation. Lower, bone marrow HSPC proliferation by BrdU flow cytometry. P = 0.0321. Two independent experiments, n = 9 C57BL/6, n = 7 mice Chrna7−/− mice, two-tailed Student’s t-test.
h. Lethally irradiated C57BL/6 and Chrna7−/− mice received wild type bone marrow and were analyzed 16 weeks later. Left, flow cytometry plots for HSPC. Right, bone marrow HSPC enumeration using flow cytometry. P = 0.0469. Three independent experiments, n = 10 C57BL/6 recipients, n = 11 Chrna7−/− recipients, two-tailed Student’s t test.
i. Left, flow cytometry plots for BrdU incorporation. Right, bone marrow HSPC proliferation by BrdU flow cytometry. P = 0.0469. Three independent experiments, n = 9 mice per group, two-tailed Student’s t test.
j. Left, flow cytometry plots for blood myeloid cells. Right, blood leukocytes. P = 0.0003 for leukocytes, P = 0.0327 for monocytes, P = 0.01 for neutrophils. Three independent experiments, n = 10 mice per group, two-tailed Student’s t test.
Data are mean ± SEM with individual values for data distribution, *P<0.05, **P<0.01 and ***P<0.001.
Based on public RNA-seq data sets, Chrna7 is expressed prominently in bone marrow stromal cells (Extended Data Figure 6a)22. Using flow cytometry on the femur in ChatGFP mice, we detected Chrna7 protein expression in mature GFP+B220+ B cells and in GFP+CD19+IgM+ immature B cells (Extended Data Figure 6b). Flow cytometric staining for Chrna7 in bone marrow of wild-type C57BL/6 revealed low protein expression in Ly6G+ neutrophils, Ly6Chi monocytes, NK1.1+ NK cells, CD4+ T cells, CD8+ T cells, SLAM LSK, LSK, CMP and GMP (Extended Data Figure 6c-f). To identify the bone marrow stromal cells that respond to B cell-derived acetylcholine, we performed single-cell RNA sequencing on sorted Ter119−CD45−Chrna7+ bone marrow cells from Chatfl/fl and Cd19CreChatfl/fl mice (Figure 5a, b). In the combined Chatfl/fl and Cd19CreChatfl/fl data set, we identified 11 separate cell clusters based on their gene expression (Extended Data 7a): four arteriolar endothelial cell clusters, one sinusoidal endothelial cell cluster, one arterial endothelial cell cluster, one fibroblast cluster, one mesenchymal stromal cell cluster, one pericyte cluster, one osteoblast cluster, one chondrocyte cluster and one cluster of neuron-like cells (Figure 5b). The relative distribution of clusters was similar between Chatfl/fl and Cd19CreChatfl/fl mice (Figure 5c). Flow cytometry and confocal imaging in C57BL/6 wild-type mice confirmed the expression of Chrna7 in all cell subsets identified by scRNA-seq, and showed that Chrna7 staining associated with CD106+ sinusoidal and Sca1+ arteriolar endothelial cells, CD90+ and leptin receptor+ mesenchymal stromal cells (LepR+ MSC) (Figure 5d), the endomucin+ vasculature (Figure 5e) and Sca1+ peri-arteriolar cells (Figure 5f). Confocal microscopy of the femur in ChatGFP mice identified Chrna7+ cells in close proximity to GFP+ cells (Figure 5g). These data indicate that most stromal niche cells in the hematopoietic niche may sense acetylcholine via Chrna7.
Fig. 5 |. Chrna7+ receptor expression by hematopoietic niche cells.

a. Flow cytometry plots of Chrna7+ bone marrow stromal cells.
b. Chrna7+ bone marrow stromal cells were FACS-purified from steady-state Chatfl/fl or Cd19CreChatfl/fl mice and subjected to scRNA-seq. Experiments were performed in duplicate, 2 mice were pooled for each sequencing replicate (4 mice per group). Uniform manifold approximation and projection (UMAP) plot of Chrna7+ bone marrow stromal cell clusters pooled post-hoc from Chatfl/fl and Cd19Cre Chatfl/fl steady-state mice (15,590 non-hematopoietic cells). Cell identities were inferred from known marker gene expression (Extended Data Figure 7). Hematopoietic cells were gated out using key marker genes.
c. Pie charts showing the proportion of Chrna7+ niche cells in Chatfl/fl or Cd19CreChatfl/fl mice. Data are mean, experiments were performed in duplicate, 2 mice were pooled for each sequencing replicate (4 mice per group).
d. Flow cytometry plots and histograms to identify Chrna7+ bone marrow stromal cells. Multiple samples were concatenated to create flow cytometry plots.
e, Immunofluorescence image of a C57BL/6 mouse femur. Arrow heads indicate endomucin+ cells and arrows Chrna7+ cells. Upper scale bar, 1 mm, middle 20 µm, bottom 30 µm.
f. Confocal microscopy of a C57BL/6 mouse femur. Section was stained with Sca1 and Chrna7. Scale bar, 40 µm.
g. Left, immunofluorescence image of a ChatGFP mouse femur. Section was stained for Chrna7 and with DAPI. Arrow heads indicate GFP+ cells and arrows Chrna7+ cells. Scale bar, 12 µm Right, distance between GFP+ and Chrna7+ cells in immunofluorescence images of ChatGFP mouse femurs. Each data point represents analysis from 1 field of view (FOV) and 3 FOV were analyzed per mouse. Data are mean ± SEM with individual values for data distribution, two independent experiments, n = 3 mice per group. Significance between 5 µm distance to all other distances was calculated using a one-way ANOVA with Sidak’s post hoc test. Data are mean ± SEM with individual values for data distribution, ****P<0.0001
Acetylcholine sensing by Chrna7+ stromal cells
Pseudobulk analysis of scRNA-seq in Cd19CreChatfl/fl and Chatfl/fl mice (n=4 mice per group, see Methods) identified between 2 and 46 genes that were differentially expressed (FDR<0.05) in 9 out of the 12 Chrna7+ niche cell clusters (Figure 6a). LepR+ MSC expressed less Cxcl12 and Angpt1, two hematopoietic niche factors that maintain HSPC23–25, in Cd19CreChatfl/fl mice compared to Chatfl/fl mice (Figure 6b). Protein expression of Cxcl12 and Angpt1 measured by ELISA in the bone marrow was lower in Cd19CreChatfl/fl mice and in Chrna7−/− mice compared to Chatfl/fl or C57BL/6 controls, respectively (Figure 6c, d). To test the functional relevance of decreased Cxcl12 in Cd19CreChatfl/fl, we treated these mice, and Chatfl/fl controls, with either AMD3100, which competes with Cxcl12 for the receptor Cxcr4, or with saline. As expected, blood CFU-C and CD45+ leukocytes increased in Chatfl/fl mice treated with AMD3100 when compared to Chatfl/fl mice treated with saline (Extended Data Figure 7b, c). The increase of blood CFU-C and CD45+ leukocytes elicited by AMD3100 was lower in Cd19CreChatfl/fl than in Chatfl/fl controls (Extended Data Figure 7b, c), suggesting that the reduced Cxcl12 expression in the Cd19CreChatfl/fl HSC niche was functionally relevant.
Fig. 6 |. Effects of B cell-specific Chat deletion on bone marrow stromal cells.

a. Differentially expressed genes in Chrna7+ bone marrow stromal cell clusters of Chatfl/fl and Cd19CreChatfl/fl mice assessed by differential expression analysis (Methods) for scRNA-seq. Annotated genes are significantly differentially expressed (FDR<0.05). Plots were adjusted for optimal visualization of the majority of genes and therefore do not include all differentially expressed genes. Experiments were performed in duplicate, 2 mice were pooled for each sequencing replicate (4 mice per group).
b. Differentially expressed genes in cluster 6 (LepR+ MSC) in Chatfl/fl and Cd19CreChatfl/fl mice, assessed by scRNA-seq. Quasi-likelihood F-test based on the generalized linear model implementation of edgeR. P = 0.0002 for Angpt1 and P = 0.000017 for Cxcl12. Experiments were performed in duplicate, 2 mice were pooled for each sequencing replicate (4 mice per group). Dots represent an individual cell. Box indicates 25% percentile and median.
c. Bone marrow protein ELISA in Cd19CreChatfl/fl or Chatfl/fl littermates. P = 0.0097 for Cxcl12, P = 0.0415 for Angpt1. Two independent experiments, n = 12 Chatfl/fl, n = 6 Cd19CreChatfl/fl mice, two-tailed Mann-Whitney test.
d. Bone marrow protein ELISA in Chrna7−/− mice. P = 0.0008 for Cxcl12, P = 0.0459 for Angpt1. Two independent experiments, n = 15 C57BL/6, n = 11 Chrna7−/− mice, two-tailed Mann-Whitney test.
e. Gene set enrichment analysis (gene sets ZHOU INFLAMMATORY RESPONSE LPS UP, HALLMARK TNFA SIGNALING VIA NFKB and HALLMARK INFLAMMATORY RESPONSE) of Chrna7+ bone marrow stromal cell clusters from Chatfl/fl and Cd19CreChatfl/fl mice by scRNA-seq.
f. Neutrophils and monocytes in circulation of Chrna7fl/fl or NestinCreChrna7fl/fl mice. P = 0.0433 for neutrophils, P = 0.0097 for monocytes. n = 10 mice per group, two-tailed Student’s t-test.
g. Upper, circulating HSPC measured by c.f.u. assay. P = 0.0411. Two independent experiments, n = 8 Chrna7fl/fl, n = 9 NestincreChrna7fl/fl mice, two-tailed Student’s t-test. Lower, C.f.u. assay of bone marrow mononuclear cells (BMNC) for granulocytes and macrophage progenitors (GM). P = 0.0431. Two independent experiments n = 8 Chrna7fl/fl, n = 9 NestincreChrna7fl/fl mice, two-tailed Student’s t-test.
h. Left, flow cytometry plots for HSPC and BrdU incorporation. Right, bone marrow HSPC enumeration and proliferation analyzed by BrdU incorporation using flow cytometry. P = 0.0218 for frequency, P = 0.0413 for BrdU. Two independent experiments, frequency: n = 9 per group and BrdU n = 10 mice per group, two-tailed Student’s t-test.
Data are mean ± SEM with individual values for data distribution, *P<0.05, **P<0.01, ***P<0.001 and ****P<0.0001
In the LepR+ MSC cluster, expression of the extracellular matrix components Col2a1, Col11a1 and Saa3 was increased in Cd19CreChatfl/fl mice when compared to Chatfl/fl mice (Figure 6a). Gene set enrichment analysis supported the transition to inflammatory cell phenotypes in Cd19CreChatfl/fl mice (Figure 6e). For instance, the Hallmark gene set ‘TNF signaling through NF-κB’ was enriched in the arteriolar endothelial cell cluster of Cd19CreChatfl/fl mice compared to Chatfl/fl (Figure 6e). However, TNF protein amount was similar in the bone marrow of Cd19CreChatfl/fl and Chatfl/fl mice (Extended Data Figure 7d), indicating that arteriolar endothelial cells may respond to circulating TNF. To test the relevance of acetylcholine binding to Chrna7 on bone marrow niche cells, we bred Chrna7fl/fl with NestinCre mice, which express Cre in stromal bone marrow cells26. LepR+ MSCs from NestinCreChrna7fl/fl mice were assayed by flow cytometry which showed reduced expression of Chrna7 compared to Chrna7fl/fl mice (Extended Data Figure 7e). NestinCreChrna7fl/fl mice had increased numbers of circulating Ly6G+ neutrophils and CD11b+CD115+ monocytes (Figure 6f) and higher CFU in the marrow and blood (Figure 6g) compared to Chrna7fl/fl mice. We recorded increased numbers of and BrdU incorporation into SLAM LSK in the bone marrow of NestinCreChrna7fl/fl mice compared to Chrna7fl/fl control mice (Figure 6h). Taken together, these data indicated that B cell-derived acetylcholine influences the phenotypes of various hematopoietic niche cells, ultimately reducing steady-state hematopoiesis.
B cell-derived acetylcholine protects against atherosclerosis
Next we investigated whether B cell-derived acetylcholine modulates atherosclerosis and myocardial infarction in mice. Atherosclerosis was induced in Cd19CreChatfl/fl and in Chatfl/fl controls by adeno-associated virus PCSK9 delivery in conjunction with atherogenic diet for 12 weeks, i.e. both cohorts developed atherosclerosis. We detected increased numbers of CD11b+CD115+ monocytes in the blood of Cd19CreChatfl/fl mice compared to Chatfl/fl mice (Figure 7a, b). Compared to Chatfl/fl mice, Cd19CreChatfl/fl had increased SLAM LSK and CMP in the femur, as well as higher CFU-GM (Figure 7c-e). CFU-C increased in the blood of Cd19CreChatfl/fl mice compared to Chatfl/fl mice (Figure 7f). Examining atherosclerotic lesions by flow cytometry, we found higher numbers of CD11b+ myeloid cells, Ly6G+ neutrophils, Ly6Chigh monocytes and F4/80+ macrophages in the aorta of Cd19CreChatfl/fl mice compared to Chatfl/fl mice (Figure 7g, h). Histology of the aortic root documented increased accumulation of CD68+ macrophages and increased lesion size in Cd19CreChatfl/fl mice compared to Chatfl/fl controls (Figure 7i). Blood cholesterol was similar in Cd19CreChatfl/fl and Chatfl/fl mice (Extended Data Figure 8a). Following atherosclerosis induction in ChatGFP mice using a similar protocol, histology indicated that a few GFP+B220+ B cells were present in atherosclerotic plaques of ChatGFP mice that were less numerous compared to the bone marrow of the same mice (Extended Data Figure 8b-d), indicating myeloid cell recruitment may also have been affected by acetylcholine-producing B lymphocytes in the atherosclerotic plaques.
Fig. 7 |. B cell-derived acetylcholine protects against cardiovascular disease.
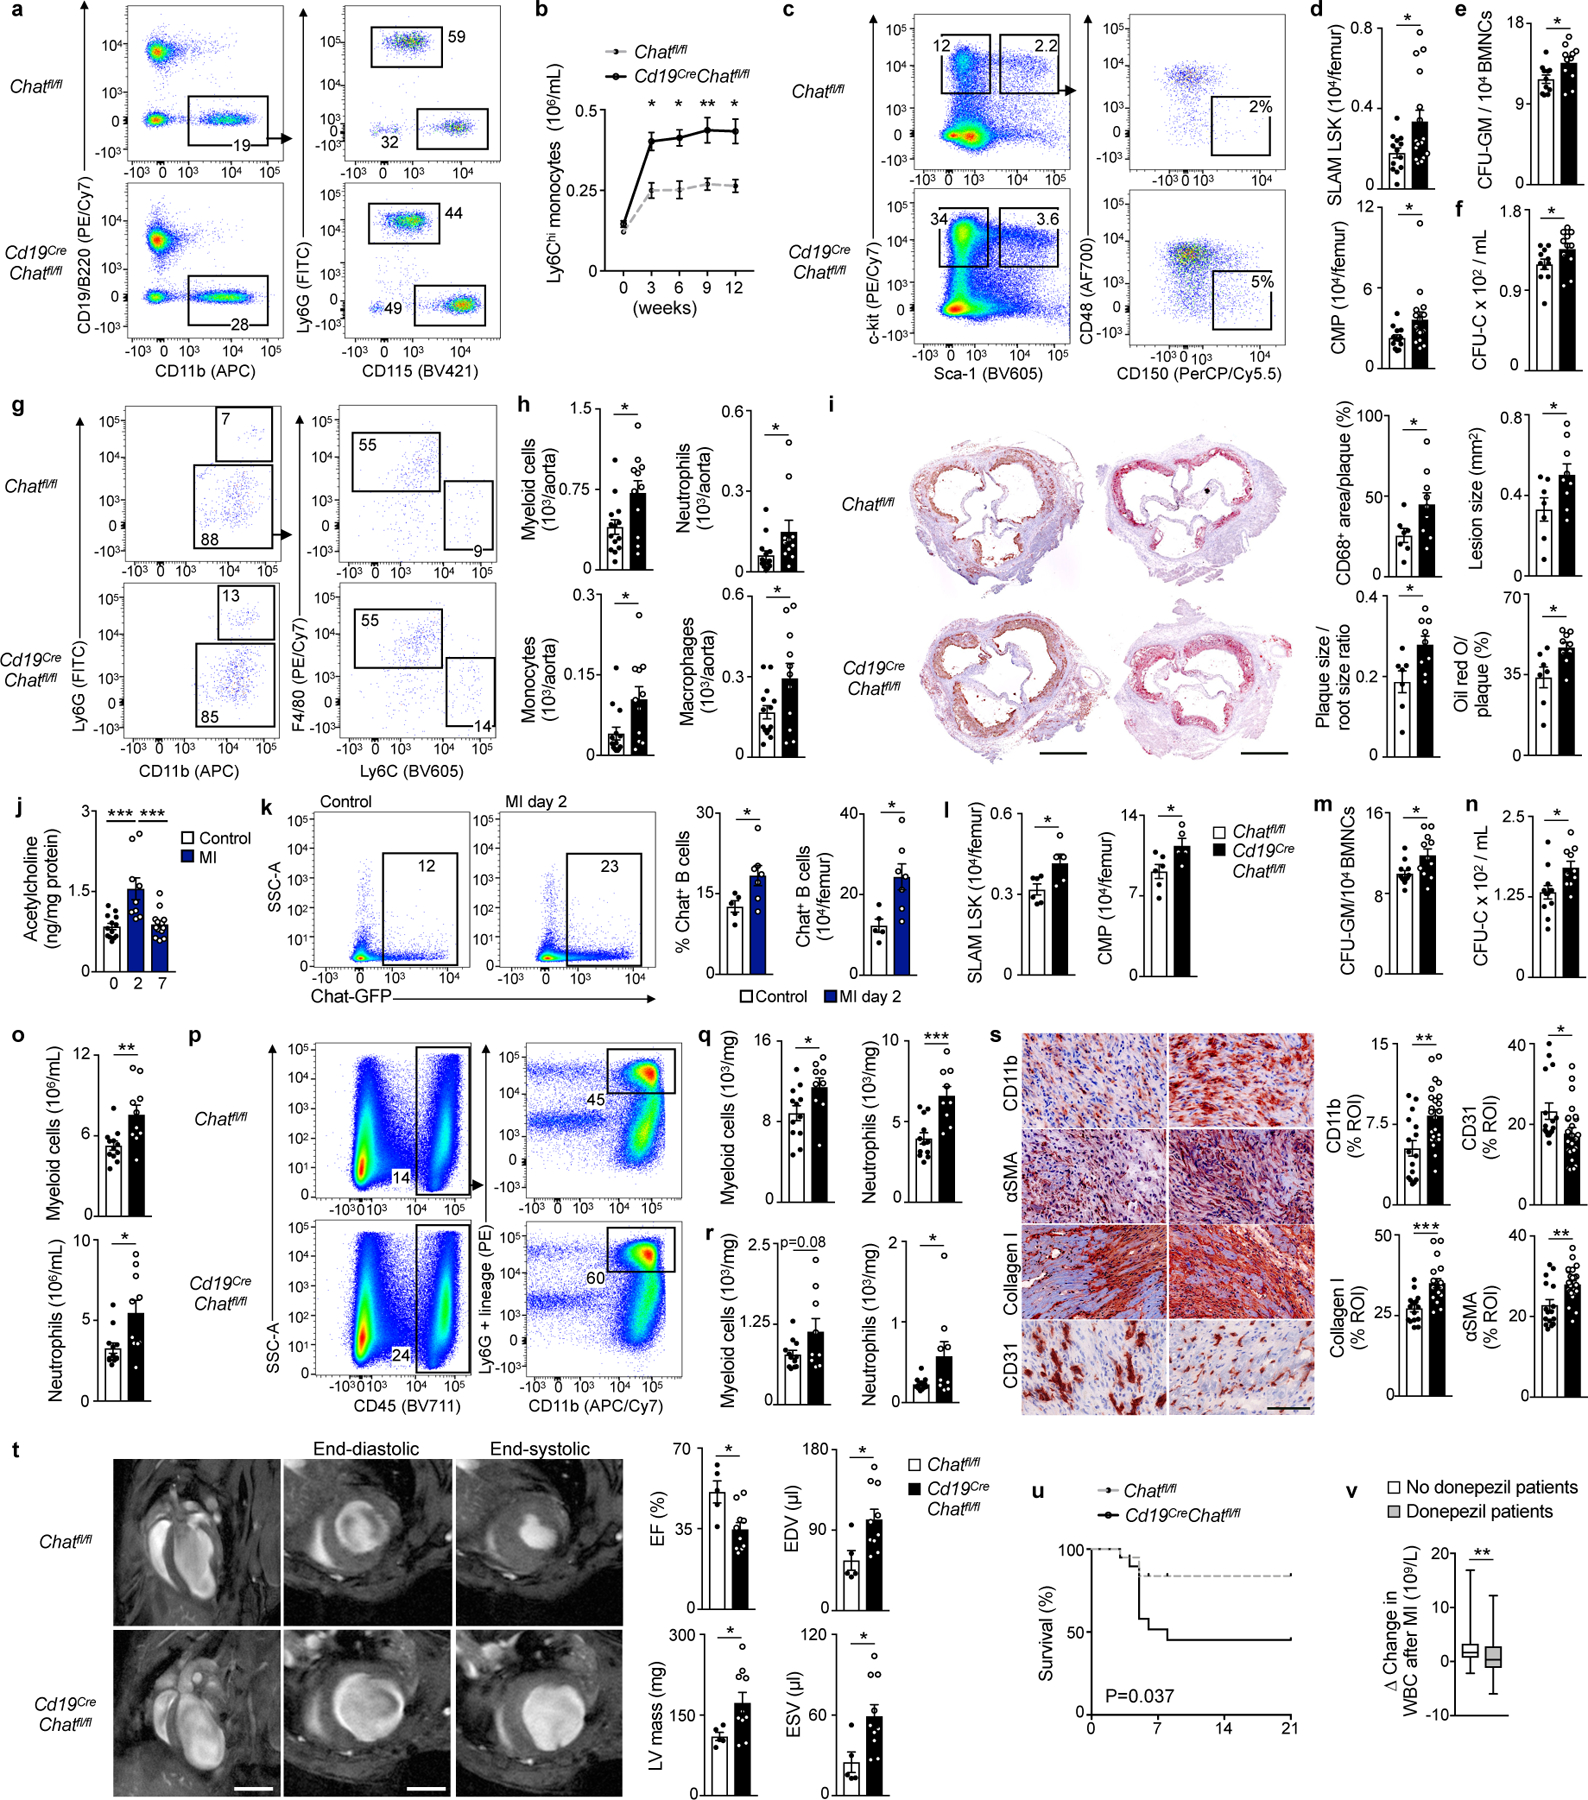
a. Cd19CreChatfl/fl mice and their Chatfl/fl littermates were injected with AAV-PCSK9-virus and fed a high-cholesterol diet for 12 weeks. Mice were bled every 3 weeks and harvested 12 weeks later for analysis. Flow cytometry plots for circulating monocytes and neutrophils.
b. Ly6Chigh monocytes in circulation. P = 0.0470 for 3 weeks, P = 0.0261 for 6 weeks, P = 0.0079 for 9 weeks and P = 0.0189 for 12 weeks. n = 11 mice per group, two-way ANOVA with Sidak’s post hoc test.
c. Flow cytometry plots for HSPC in bone marrow.
d. Bone marrow HSPC by flow cytometry. P = 0.0250 for SLAM LSK, P = 0.0461 for CMP. Three independent experiments, n = 13 Chatfl/fl, n = 16 Cd19CreChatfl/fl mice, two-tailed Student’s t-test.
e. C.f.u. assay of bone marrow mononuclear cells (BMNC) for granulocyte and macrophage progenitors (GM). P = 0.0291. Two independent experiments, n = 11 mice per group, two-tailed Student’s t-test.
f. Circulating HSPC measured by c.f.u. assay in blood. P = 0.041. Two independent experiments, n = 11 mice per group, two-tailed Student’s t-test.
g. Flow cytometry plots for neutrophils, monocytes and macrophages in the aorta.
h. Myeloid cells in the aorta by flow cytometry. P = 0.038 for myeloid cells, P = 0.015 for neutrophils. Three independent experiments, n = 14 Chatfl/fl, n = 11 per Cd19CreChatfl/fl mice, two-tailed Mann-Whitney test.
i. CD68+ macrophages in aortic roots. P = 0.0466. Three independent experiments, n = 7 Chatfl/fl, n = 9 Cd19CreChatfl/fl mice, two-tailed Student’s t-test. Right, Oil red O (ORO) for plaque size to aortic root size ratio and ORO+ area within plaque. P = 0.0475 for lesion size, P = 0.0165 for plaque size to aortic root size ratio and P = 0.0159 for ORO positive area within plaque. Three independent experiments, n = 7 Chatfl/fl, n = 9 per Cd19CreChatfl/fl mice, two-tailed Student’s t-test.
j. Bone marrow of C57BL/6 mice underwent mass spectrometry analysis for acetylcholine at baseline, 2 days (d) after MI and 7 d after MI. P = 0.0002 for baseline vs. 2 d post MI, P = 0.0003 for 2 d post MI vs. 7 d post MI. Three independent experiments for baseline and 7 d post MI and two independent experiments for 2 d post MI, n = 13 mice baseline group, n = 9 mice 2 d post MI, n = 14 mice 7 d post MI, one-way ANOVA with Sidak’s post hoc test.
k. ChatGFP mice were subjected to MI and underwent bone marrow flow cytometry 2 d after MI. Left, flow cytometry plots for GFP expression in mature bone marrow B cells. Right, percentage and enumeration of mature GFP+ B cells in bone marrow, measured by flow cytometry. P = 0.0480 for percentage and P = 0.0177 for enumeration of GFP+ B cells. Two independent experiments, n = 5 mice baseline, n = 7 mice 2 d post MI, two-tailed Mann-Whitney test.
l. Bone marrow HSPC enumeration 3 d after MI. C57BL/6 mice were used as control. P = 0.030 for SLAM LSK and P = 0.034 for CMP. n = 6 control, n = 5 Cd19CreChatfl/fl mice, two-tailed Student’s t-test.
m. C.f.u. assay of bone marrow mononuclear cells (BMNC) for granulocyte and macrophage progenitors (GM) 3 d after MI. P = 0.015. Two independent experiments, n = 12 control C57BL/6, n = 11 Cd19CreChatfl/fl mice, two-tailed Student’s t-test.
n. Circulating HSPC measured by c.f.u. assay 3 d after MI. P = 0.0145. Two independent experiments, n = 12 control C57BL/6, n = 10 Cd19CreChatfl/fl mice, two-tailed Student’s t-test.
o. Myeloid cells and neutrophils in circulation 3 d after MI. P = 0.0053 myeloid cells and P = 0.0109 for neutrophils. Two independent experiments, n = 12 control C57BL/6, n = 10 Cd19CreChatfl/fl mice, two-tailed Student’s t-test.
p. Flow cytometry plots of myeloid cells in the infarct and remote myocardium 3 d after MI.
q. Myeloid cell and neutrophil numbers in the infarct 3d after MI. P = 0.0366 for myeloid cells and P = 0.0006 for neutrophils. Two independent experiments, n = 12 control C57BL/6, n = 9 Cd19CreChatfl/fl mice, two-tailed Student’s t-test.
r. Myeloid cell and neutrophil numbers in the remote myocardium 3d after MI. P = 0.0405 for neutrophils. Two independent experiments, n = 12 control C57BL/6, n = 9 Cd19CreChatfl/fl mice, two-tailed Student’s t-test.
s. Immunohistochemical staining of CD11b+ myeloid cells, collagen I, α-smooth muscle actin+ myofibroblasts and CD31+ vessels in the border zone 7d after MI. Bar graphs show percentage of positive staining per region of interest (ROI). Each data point represents a ROI and 4 ROI were analyzed per mouse. P = 0.0018 for CD11b, P = 0.0002 for collagen I, P = 0.0017 for αSMA, P = 0.0274 for CD31. Two independent experiments, CD11b, αSMA and CD31: n = 4 m Chatfl/fl, n = 6 Cd19CreChatfl/fl mice; collagen I: n = 4 Chatfl/fl, n = 5 Cd19CreChatfl/fl mice, two-tailed Student’s t-test.
t. Left, MRI long and short axis views 21 d after MI. Right, ejection fraction (EF), end-diastolic volume (EDV), end-systolic volume (ESV) and mass of the left ventricle (LV) 21 d after MI.
P = 0.0098 for EF, P = 0.0452 for LV mass, P = 0.0231 for EDV and P = 0.0235 for ESV. Two independent experiments, n = 5 Chatfl/fl, n = 10 Cd19CreChatfl/fl mice, two-tailed Student’s t-test.
u. Survival after MI. P = 0.037. Two independent experiments, n = 9 Chatfl/fl, n = 11 Cd19CreChatfl/fl mice, Mantel–Cox log-rank test.
v. MI patients received either no donepezil (n = 70) or at least 5mg of donepezil (n = 70) daily. Mean change in white blood cell count (WBC) between 4 weeks before and 2–4 d after MI. P = 0.0071. Data are displayed in boxes (indicating quartiles) and whiskers (minimum to maximum).
Data are mean ± SEM with individual values for data distribution if not otherwise specified, *P<0.05, **P<0.01 and ***P<0.01.
Next, we induced acute myocardial infarction (MI) by coronary ligation in C57BL/6 mice, which increased the amount of bone marrow acetylcholine 2 days later, as measured by mass spectrometry, compared to naive controls (Figure 7j). On day 2 post-coronary ligation, a time when HSPC proliferation post-MI peaks27, the number of GFP+CD19+ B cells in the bone marrow of ChatGFP mice was increased compared to naive ChatGFP controls (Figure 7k). We then compared the hematopoietic response to MI in Cd19CreChatfl/fl to Chatfl/fl controls with MI. On day 3 after MI, the number of SLAM LSK, CMP and CFU-GM was higher in Cd19CreChatfl/fl than in Chatfl/fl mice (Figure 7l, m), leading to higher numbers of blood CFU-C (Figure 7n), CD11b+ myeloid cells and Ly6G+ neutrophils in the blood and myocardium (Figure 7o-r). Histological analysis of heart tissue on day 7 after MI indicated elevated accumulation of CD11b+ myeloid cells in the infarcts of Cd19CreChatfl/fl mice, along with more fibrosis and reduced CD31+ endothelial cells, compared to Chatfl/fl with MI (Figure 7s). The infarcted hearts of Cd19CreChatfl/fl mice had increased left ventricular remodeling and lower ejection fraction compared to Chatfl/fl controls, and Cd19CreChatfl/fl mice had reduced survival at day 21 post-MI (Figure 7t, u). Splenic hematopoiesis was assessed by colony forming assays and flow cytometry on day 6 after MI in Cd19CreChatfl/fl mice and compared to Chatfl/lf mice post-MI. We found increased CFU-C, SLAM HSC, LSK, CMP and GMP in Cd19CreChatfl/fl mice compared to Chatfl/lf mice post-MI, while splenic numbers of CD45+ leukocytes and CD11b+ myeloid cells were unchanged (Extended Data Figure 9a-d). Splenectomy 3 weeks prior MI did not blunt the increased bone marrow emergency hematopoiesis in Cd19CreChatfl/fl mice compared to Chatfl/fl mice post-MI, as SLAM HSC and CMP expanded more in Cd19CreChatfl/fl mice than in Chatfl/lf mice post-MI, no matter whether they had underwent splenectomy or not, with a similar constellation for CD11b+ myeloid cells and Ly6G+ neutrophils in the blood and infarct tissue (Extended Data Figure 9e-i).
Finally, to explore whether cholinergic signaling may influence leukocyte numbers in patients with acute myocardial infarction, we retrospectively surveyed this parameter in MI patients undergoing donepezil treatment (n= 70) or not (n= 70). Both cohorts were matched based on age, sex and peak troponin T 48 h post-MI, a biomarker for infarct size. Patients taking donepezil during acute MI showed a lower increase in blood leukocytes on days 2–4 post-MI (Figure 7v). In agreement with this clinical association, we observed that treatment with the acetylcholine esterase inhibitor PB for 28 days prior to coronary ligation reduced emergency hematopoiesis in C57BL/6 mice after MI when compared to mice with MI that were treated with saline. Specifically, 3 days after MI, PB reduced SLAM LSK, CMP, GMP, MDP and CFU-GM in the femur when compared to saline treated controls with MI (Extended Data Figure 10a-c). Likewise, PB treated mice had fewer blood CFU-C (Extended Data Figure 10d). CD45+ leukocytes, Ly6G+ neutrophils and CD11b+CD115+ monocytes decreased in the blood and infarct when compared to saline treated mice 3 days after MI (Extended Data Figure 10e-i). Histological analysis on day 3 after MI indicated reduced CD11b+ cells and less collagen deposition in infarcts of PB-treated mice when compared to saline-treated mice with MI (Extended Data Figure 10j). Administration of PB did not affect mouse survival at day 7 post-MI (Extended Data Figure 10k). These data indicate that B cell-derived acetylcholine reduces cardiovascular inflammation and disease severity via regulating immune cell production.
Discussion
Here we show that B cell-derived acetylcholine curbs steady-state hematopoiesis. We found increased numbers of leukocytes in humans and mice treated with acetylcholine esterase inhibitors, in mice with B cell-specific deletion of the enzyme Chat (which is essential for producing acetylcholine), in chimeric mice with a deletion of Chrna7 (a receptor for acetylcholine) in non-hematopoietic cells and in NestinCreChrna7fl/fl mice, in which Chrna7 was deleted in stromal niche cells. The decreased expression of Cxcl12 in mesenchymal stromal cells in Cd19CreChatfl/fl mice suggested that acetylcholine mediates this effect by regulating the expression of hematopoietic factors that constrain leukocyte production. Cd19CreChatfl/fl mice with atherosclerosis or post-MI heart failure had reduced cardiovascular inflammation and better disease outcomes.
Other cells and mechanisms may contribute to the effect of acetylcholine on systemic leukocyte numbers. T lymphocytes, the second most abundant GFP+ population in the bone marrow of ChatGFP mice, may be the source17 of the residual acetylcholine detected in the Cd19CreChatfl/fl bone marrow. Non-B cell-derived acetylcholine, perhaps produced in the central nervous system, could account for the slight increase in erythrocytes in Chrna7−/− mice compared to C57BL/6 controls, which was not observed in Cd19CreChatfl/fl mice. Bone marrow endothelial cells in NestinCreChrna7fl/fl mice still expressed the acetylcholine receptor; thus, endothelial and other niche cell clusters that responded heterogeneously with altered gene expression in Cd19CreChatfl/fl mice may regulate hematopoiesis beyond the phenotype observed in NestinCreChrna7fl/fl mice.
We detected increased numbers and cell cycle activity of SLAM LSK, phenotypically the most upstream hematopoietic progenitors19, in Cd19CreChatfl/fl mice. Limiting dilution experiments indicated a non-significant trend towards lower frequencies of functional hematopoietic stem cells in Cd19CreChatfl/fl mice compared to Chatfl/fl controls. Reduced repopulation in transplantation, higher proliferation and a myeloid bias are reminiscent of aging, during which HSC proliferate more, expand in numbers and exhaust28–30. Thus, the effects of B cell-derived acetylcholine could be interpreted as countering premature HSC aging.
The inherent migratory capabilities of B cells, as indicated by our parabiosis experiments, imply that B cells can accumulate in various locations flexibly. Such behaviour may support the local dynamic adaption of hematopoietic activity. In addition, B cells are well equipped to interact with other immune cells and likely sense circulating danger signals, including cytokines and other immune cues. These properties may facilitate fine-tuning of hematopoiesis during disturbed homeostasis.
Our data in mice and patients with cardiovascular disease indicate that the effect of cholinergic signalling on hematopoiesis may represent a therapeutic opportunity. Targets associated with this pathway may be relevant for any leukocyte-related conditions, inflammatory or not. Because we observed that B cell-derived acetylcholine altered the proliferation of haematopoietic progenitors, our findings may have relevance for clinical bone marrow transplantation. Our results indicate a role for B lymphocytes in the cholinergic control of hematopoiesis to support the resolution of inflammatory responses through effects on the bone marrow niche. The role of cholinergic signalling in acute (myocardial infarction) and chronic (atherosclerosis) pathology has therapeutic implications, as supported by the human data.
Methods
Patient data
Human data were collected retrospectively from two cohorts at Massachusetts General Brigham using the Partners Healthcare Patient Data Registry. In cohort 1, the average patient age was 83 years for all 3 groups. The percentage of male patients was 41% in the no donepezil, 45% in the 5mg donepezil and 42% in the 10mg donepezil group. Cohort 2 consisted of patients who had an MI between January-01–2018 and December-31–2018 and were not taking donepezil at the time (N=5,181) and all patients taking donepezil who subsequently had an MI during treatment between January-01–2009 and December-31–2018 (N = 1,778). Patients were retained if they had a WBC in the 24 hours prior to MI, a positive troponin-t and a WBC 2–4 days post MI. The non-donepezil cohort was matched to the donepezil cohort (N = 70) by age, sex and maximum troponin-t in the 48 hours post MI. In cohort 2, the average patient age was 80 years for the no donepezil group and 81 years for the donepezil group. The percentage of male patients was 57% in both groups. The study protocol was approved by the Institutional Review Boards (protocol number 2005P000660).
Mice
Wild type (C57BL/6J, 000664); ChatGFP (B6.Cg-Tg(RP23–268L19-EGFP)2Mik/J, 007902); CD45.1 (B6.SJL-PtprcaPepcb/BoyJ, 002014); Chrna7−/− (B6.129S7-Chrna7tm1Bay/J, 003232); Cd19Cre (B6.129P2(C)-Cd19tm1(cre)Cgn/J, JAX, 006785); Chatfl/fl mice (B6,129-Chattm1Jrs/J, JAX, 016920); NestinCre mice (B6.Cg-Tg(Nes-cre)1Kln/J, JAX, 003771) and Chrna7fl/fl mice (B6(Cg)-Chrna7tm1.1Ehs/YakelJ, JAX, 026965) mice were purchased from the Jackson Laboratory. For atherosclerosis experiments, mice received AAV-PCSK9 (Addgene plasmid 58376; http://n2t.net/addgene:58376; RRID: Addgene_58376) and a high-fat diet (D12108C, Research Diets) for 12 weeks. Mice were randomized to experimental and procedural groups and analyzed in a blinded fashion where appropriate. All mice were housed in separate cages in a pathogen-free environment of the Massachusetts General Hospital animal facility and maintained on a 12-hour light/dark cycle with a room temperature of 22 ± 1°C. Experiments were approved by the Institutional Animal Care and Use Committee (2005N000306).
Surgery
To induce myocardial infarction, mice were intubated and ventilated with 2% isoflurane. The left coronary artery was permanently ligated with an 8–0 suture. Pyridostigmine bromide (P9797–1G, Sigma-Aldrich) or saline was administered via a mini pump (2006, Alzet) at 10mg kg−1 per day. For parabiosis surgery, a longitudinal skin incision was performed from above the elbow to below the knee joint. The olecranon and knee joints were joined. For splenectomy, the abdominal cavity was opened through a midline laparotomy incision. The splenic vein and artery were ligated and the spleen was removed. The abdominal wall and skin were closed in layers using 7.0 suture. Animals were given buprenorphine (0.1 mg kg−1 subcutaneously) 30 min before surgery and every 12 hours for the first 72 hours after implantation surgery.
Cxcr4 inhibition assay
Mice were injected subcutaneously with a 5 mg kg−1 of AMD3100 (A5602, Sigma-Aldrich) or saline. Peripheral blood was harvested 4 hours later.
Tissue processing
Before organ collection, mice were perfused with 20 ml ice-cold PBS. The epiphysis of the femurs and tibiae were opened, flushed with FACS buffer and filtered through a 40 μm cell strainer. Marrow was collected by flushing the plug out of the bones. The supernatant was removed and digested with collagenase IV (Sigma-Aldrich, C5138); dispase (Gibco by Life Technology, 17105–041) and DNase I (Thermo Scientific, 90083). Aortas were excised, minced and enzymatically digested with collagenase I (C0130), collagenase XI (C7657), DNase I (D5319) and hyaluronidase (H3506, all Sigma-Aldrich).
Flow cytometry of human bone marrow samples
Bone marrow from human donors (70001.2, STEMCELL Technologies) was stained with LIVE/DEAD Fixable Aqua Dead Cell (L-34966, Thermo Scientific); CD16-BV421 (302038, clone 3G8, BioLegend); CD14-BV421 (367144, clone 63D3, BioLegend); CD3-BV421 (317344, clone OKT3, BioLegend); CD66b-BV421 (305112, clone G10F5, BioLegend); CD19-APC/Cy7 (302218, clone HIB19, BioLegend); CD34-FITC (343604, clone 516, BioLegend); CD20-PE/Cy7 (302312, clone 2H7, BioLegend) and Chat-PE (ab224000, clone EPR13024, Abcam).
Flow cytometry of mouse samples
Hematopoietic cells were stained with biotin-conjugated anti-mouse lineage antibodies CD3 (100304, clone 145–2C11, BioLegend); CD4 (100404, clone GK1.5, BioLegend); CD8a (100704, clone 53–6.7, BioLegend); CD49b (108904, clone DX5, BioLegend); CD90.2 (105304, clone 30-H12, BioLegend); CD19 (115503, clone 6D5, BioLegend); B220 (103204, clone RA3–6B2, BioLegend); NK1.1 (108704, clone PK136, BioLegend); TER119 (116204, clone TER-119, BioLegend); CD11b (101204, clone M1/70, BioLegend); CD11c (117304, clone N418, BioLegend); Gr1 (108404, clone RB6–8C5, BioLegend), and LIVE/DEAD Fixable Aqua Dead Cell Stain (L-34966, Life Technologies); CD34-FITC (553733, clone RAM34, BD Biosciences); CD135-PE (135306, clone A2F10, BioLegend); CD150-PerCP/Cy5.5 (115922, clone TC15–12F12.2, BioLegend); c-kit-PE/Cy7 (105814, clone 2B8, BioLegend); CD48-AF700 (103426, clone HM48–1, BioLegend); CD115-BV421 (135513, clone AFS98, BioLegend); Sca-1-BV605 (108133, clone D7, BioLegend); CD16/32-BV711 (101337, clone 93, BioLegend) and Streptavidin-APC/Cy7 (405208, BioLegend); CD34-FITC (553733, clone RAM34, BD Biosciences); CXCR4-PE (146506, clone L276F12, BioLegend); CD105-PerCP/Cy5.5 (120416, clone MJ7/18, BioLegend); c-kit-PE/Cy7 (105814, clone 2B8, BioLegend), CD41-APC (133914, clone MWReg30, BioLegend); CD48-AF700 (103426, clone HM48–1, BioLegend); CD71-BV421 (113813, RI7217, BioLegend); Sca-1-BV605 (108133, clone D7, BioLegend) and CD16/32-BV711 (101337, clone 93, BioLegend) and Streptavidin-APC/Cy7 (405208, BioLegend); CD34-FITC (553733, clone RAM34, BD Biosciences); CD135-PE (135306, clone A2F10, BioLegend); CD150-PerCP/Cy5.5 (115922, clone TC15–12F12.2, BioLegend); c-kit-PE/Cy7 (105814, clone 2B8, BioLegend); CD90-APC (140312, clone 53–2.1, BioLegend); CD48-AF700 (103426, clone HM48–1, BioLegend); IL7Rα-BV421 (135024, clone A7R34, BioLegend); Sca-1-BV605 (108133, clone D7, BioLegend); CD16/32-BV711 (101337, clone 93, BioLegend) and Streptavidin-APC/Cy7 (405208, BioLegend). BrdU was intraperitoneally injected 24 hours before harvest, and cells were stained with BrdU-APC (552598, BD Biosciences).
Leukocytes were stained with antibodies B220-PE (103208, clone RA3–6B2, BioLegend); CD49b-PE (108908, clone DX5, BioLegend); CD90.2-PE (140308, clone 53–2.1, BioLegend); Ly6G-PE (551461, clone 1A8, BD Biosciences); NK1.1-PE (108708, clone PK136, BioLegend); Ter119-PE (116208, clone TER-119, BioLegend); CD103-PE (121406, clone 2E7, BioLegend); Ly6C-FITC (128006, clone HK1.4, BioLegend); F4/80-PE/Cy7 (123114, clone BM8, BioLegend); CD45-BV711 (103147, clone 30-F11, BioLegend) and CD11b-APC/Cy7 (101226, clone M1/70, BioLegend); CD3-PE (100206, 17A2, BioLegend); CD19-PE (152408, clone 1D3/CD19, BioLegend); F4/80-PE/Cy7 (123114, clone BM8, BioLegend); Ly6C-BV605 (128035, clone HK1.4, BioLegend). CD19-PE/Cy7 (115520, clone 6D5, BioLegend); B220-PE/Cy7 (103222, clone RA3–6B2, BioLegend); CD115-BV421 (135513, clone AFS98, BioLegend); CD11b-APC (101212, clone M1/70, BioLegend); CD45-AF700 (103127, clone 30-F11, BioLegend); NK1.1-APC/Cy7 (108730, clone PK136, BioLegend) and LIVE/DEAD Fixable Aqua Dead Cell Stain (L-34966, Life Technologies). Platelets and red blood cells were stained with CD61-FITC (104306, clone 2C.G2, BioLegend), CD3-PE (100206, clone 17A2, BioLegend); CD71-BV421 (113813, clone RI7217, BioLegend); CD41-APC (133914, clone MWReg30, BioLegend); Ter119-APC/Cy7 (116223, clone TER-119, BioLegend).
For B cell progenitor analysis, cells were stained with IgM-BV421 (406517, clone RMM-1, BioLegend); CD4-PE (116006, clone RM4–4, BioLegend); CD8-PE (100708, clone 53–6.7, BioLegend); CD90.2-PE (140308, clone 53–2.1, BioLegend); NK1.1-PE (108708, clone PK136, BioLegend); CD11b-PE (101208, clone M1/70, BioLegend); CD115-PE (135506, clone AFS98, BioLegend); CD11c-PE (117308, clone N418, BioLegend); CD93-PerCP/Cy5.5 (136512, clone AA4.1, BioLegend); B220-PeCy7 (103222, clone RA3–6B2, BioLegend); CD24-BV605 (101827, clone M1/69, BioLegend); CD43-APC (143208, clone S11, BioLegend); IgD-AF700 (405730, clone 11–26c.2a, BioLegend) and CD19-BV711 (115555, clone 6D5, BioLegend). To assess cell cycle, cells were stained with Ki-67-APC (17–5698-82, clone SolA15, Thermo Fisher Scientific). For bone marrow stromal cell analysis, cells were stained with Chrna7-APC (ANC-007-FR, polyclonal, Alomone labs); CD31-BUV737 (565097, clone MEC 13.3, BD Biosciences); CD45-APC/Cy7 (103116, clone 30-F11, BioLegend); Ter119- APC/Cy7 (560509, clone TER-119, BD Biosciences); CD106-BV711 (740675, clone 429, BD Biosciences); Sca1-BV421 (108128, clone D7, BioLegend); CD90-BV785 (105331, clone 30-H12, BioLegend); CD51-PE (104106, clone RMV-7, BioLegend); LeptinR-biotin-conjugated (BAF497, clone polyclonal, R&D systems); Streptavidin-BV650 (405232, BioLegend) and 7-AAD-PerCP (420404, BD Biosciences). Data were acquired on an BD FACSAria™ III and LSRII flow cytometer with FACS Diva 6.1 software (BD Biosciences). Flow cytometry data were analyzed with FlowJo 10 software (BD, Franklin Lakes, NJ, USA). CD45+ cell depletion was done prior to cell sorting using microbeads (130–052-301, Miltenyi Biotech).
Colony-forming unit assay
Colony-forming unit assays were performed according to protocols provided by STEMCELL Technology. 1,5 × 10⁵ bone marrow cells were plated with colony-forming unit assay medium (M3534, STEMCELL Technologies). 100µl whole blood were plated into two 35 mm cell culture dishes prepared with colony-forming units assays medium (M3434, STEMCELL Technologies). 1 × 10⁶ splenocytes were plated into two 35 mm cell culture dishes prepared with colony-forming units assays medium (M3434, STEMCELL Technologies).
Bone marrow transplantation
Mice were lethally irradiated (single dose of 9.5 Gy) and received 3×10⁶ BMC. For the limiting dilution assays, 1, 5, 10, 30, 60, 250 and 500 HSC were transplanted together with CD45.1 bone marrow. Four months later, multi-lineage blood chimerism was assessed and a chimerism of 0.1% or higher was used to determine responders. L-Calc (StemCell Technologies Inc.) and ELDA software were used to calculate HSC frequency.
Vascular permeability assay
Vascular permeability was assessed after injecting 20 mg kg−1 Evans blue intravenously. Bone marrow was suspended in 200 µl formamide, minced and homogenized. Spleens were minced, plunged and filtered through a 40 μm cell strainer. Absorption was measured at 620nm and 740nm (Tecan, Switzerland).
ELISA
Femur supernatant was collected and subjected to ELISA for quantification of Cxcl12 (ab100741, Abcam), Angpt1 (LS-F2956, LifeSpan BioSciences) and Tnfα (MTA00B, R&D Systems) according to the manufacturer’s protocol.
Miliplex cytokine array
Cytokines were analyzed with a cytokine antibody array C1 (AAM-CYT-1–8, RayBiotech) according to the manufacturer’s instructions. Tissue samples were incubated on membranes overnight, incubated with an biotinylated antibody cocktail, followed by HRP–streptavidin incubation. Detection buffer was added to develop a chemiluminescent signal and signal intensity was measured on a LI-COR reader.
RNA isolation and real-time PCR
RNA isolation was performed using a RNeasy Plus Micro Kit (74034, Qiagen). High-Capacity RNA-to-cDNA Kit (4387406, ThermoFisher Scientific) was used for reverse transcription. TaqMan Fast Universal PCR Master Mix (4352042, ThermoFisher Scientific) and primers for Chat (Mm01221882_m1, FAM-MGB, Thermo Fisher Scientific) and Gapdh (4352339E, VIC/MGB probe, Thermo Fisher Scientific) were used to quantify target genes. Gene expression was measured by 7500 Real Time PCR system (Applied Biosystems) and target gene expression was normalized to Gapdh.
Bulk RNA Sequencing
RNA extraction was done with the RNeasy Plus Micro Kit (74034, Qiagen). RNA quality was assessed with the RNA 6000 Pico assay kit (5067–1513, Agilent Technologies) using the Agilent Bioanalyzer (5067–4626, Agilent Technologies). Sequencing-ready cDNA libraries were prepared using the NEBNext® Ultra™ II Directional RNA Library Prep with Sample Purification Beads (E7765S, New England BioLabs) and NEBNext® Ultra™ II RNA Library Prep Kit for Illumina® (E7420, New England BioLabs). The libraries were quantified by qPCR using KAPA Library Quantification kit.
Singe cell RNA sequencing
Ter119−CD45−Chrna7+ bone marrow cells were FACS purified and subjected to single cell RNA sequencing using the 10X Genomics Chromium system (1000092, 10X Genomics). Experiments were performed in duplicate, 2 mice were pooled for each sequencing replicate. Single-cell suspensions were prepared in accordance to the 10X Genomics user guide. Amplified cDNA was used to construct Illumina sequencing libraries. Constructed libraries were validated and quantified with the High Sensitivity DNA chip and by real-time qPCR, and subsequently sequenced on an Illumina NextSeq 500 in high-output mode. A total of 5,531 and 10,059 Chrna7+ bone marrow stromal cells were sequenced from Chatfl/fl and Cd19CreChatfl/fl mice, respectively.
Confocal imaging
Bone sections were stained with Chrna7 (ANC-007, Alomone Labs) and Sca1 (122502, clone E13–161.7, Biolegend); secondary antibodies anti-rat 488 (20027, Biotium) and anti-rabbit 555 (20038, Biotium). Imaging was performed on a Leica TCS SP8 confocal microscope. For confocal microscopy of the femur in ChatGFP mice, OsteoSense 750EX (NEV10053EX, 4 nmol per mouse, PerkinElmer) was administered i.v. to outline bone architecture, CD31-PE (102508, clone MEC13.3, 15 μg per mouse, BioLegend) and Sca1-PE (12–5981-83, clone D7, 15 μg per mouse, eBioscience) to outline vasculature and B220-APC (103212, clone RA3–6B2, 15 μg per mouse, BioLegend) to identify B cells. B220 isotype antibodies (400512, clone RTK2758, 15 μg per mouse, BioLegend) were used for control stainings. For selected experiments, the femur was optically cleared by incubating the fixed femur in a RapiClear (SunJin Lab) solution and imaged using a confocal microscope (IV100 Olympus).
Histology
Aortic roots and hearts were embedded in optimum cutting temperature compound (4583, Sakura Finetek). Frozen sections were incubated in Oil Red O (O0625, MilliporeSigma) in propylene glycol solution (P355, Fisher Chemical) and counterstained with Harris Hematoxylin (HHS32, MilliporeSigma). Immunohistochemical staining used CD68 (137002, clone FA-11, BioLegend); CD11b (557397, clone M1/70, BD Biosciences); alpha smooth muscle Actin (ab5694, Abcam) and Collagen I (ab21286, Abcam) followed by biotinylated secondary antibodies and VECTASTAIN ABC Kit (PK6100, Vector Laboratories). Femurs were decalcified in 0.5M EDTA (BM-711, Boston BioProducts) for 4 days. Heat-induced antigen retrieval was performed using Retrievagen A (pH6.0) (550524, BD Biosciences). The primary antibodies Chrna7 (NBP1–52375, Novus Biologicals) and Endomucin (ab106100, clone V.7C7.1, Abcam) were used. A biotinylated anti-Goat IgG antibody (BA-5000, dilution 1:100) followed by streptavidin-DyLight 594 (SA5594,1:600 dilution, both Vector Laboratories) were used to detect Cholinergic Receptor Nicotinic Alpha 7, and AF488 anti-Rat IgG secondary antibody (A-11006, Thermo Fisher Scientific) was applied to identify endothelial cells. Anti-GFP antibody (ab13970, Abcam) and AF488 anti-Chicken IgY secondary antibody (A-11039, Thermo Fisher Scientific) were used to detect ChatGFP; B220 (14–0542-85, eBioscience) to detect B cells. Images were captured on a NanoZoomer 2.0RS (Hamamatsu, Shizuoka, Japan) and analyzed using ImageJ 1.51s software (National Institutes of Health).
Intravital microscopy
Intravital microscopy of the calvarium was performed in ChatGFP mice using a confocal microscope (IV100 Olympus) and IV10-ASW 01.01.00.05 software (Olympus, Tokyo, Japan). OsteoSense 750EX (NEV10053EX, 4 nmol per mouse, PerkinElmer) was administered to outline bone architecture, CD31-PE (102508, clone MEC13.3, 15 μg per mouse, BioLegend) and Sca1-PE (12–5981-83, clone D7, 15 μg per mouse, eBioscience) was injected i.v. to outline vasculature and B220-APC (103212, clone RA3–6B2, 15 μg per mouse, BioLegend) to identify B cells.
Electron microscopy
Cell pellets were resuspended in 4.0% glutaraldehyde fixative, made with 0.1M sodium cacodylate buffer (pH 7.4, Electron Microscopy Sciences, Hatfield, PA), post-fixed in 1.0% osmium tetroxide in cacodylate buffer and embedded in 2% agarose. Agarose blocks were embedded in Eponate resin and allowed to polymerize. Sections were cut using a Leica EM UC7 ultramicrotome, collected onto formvar-coated grids, stained with 2% uranyl acetate and Reynold’s lead citrate and examined in a JEOL JEM 1011 transmission electron microscope at 80 kV.
Cardiac magnetic resonance imaging (MRI)
MRI was acquired on a Bruker 4.7 Tesla PhamaScan (Billerica, MA) using a cine fast low-angle shot sequence with intraGate motion compensation and the following parameters: echo time, 2.945 ms; repetition time, 10.0 ms; flip angle, 18 degrees; oversampling, 250; frames, 16; matrix, 200 × 200 × 1 and voxel size, 0.150 × 0.150 × 1 mm. The data were analyzed with Horos software (v1.1.7, https://horosproject.org).
Mass spectrometry
Norepinephrine (NE) and acetylcholine (ACh) in bone marrow samples were quantified using a UPLC-MS/MS assay. ACh-d4 and NE-d6 were added as standards. UPLC-MS/MS analysis was performed on a Xevo TQ-S micro triple quadrupole mass spectrometer with ACQUITY UPLC H-Class system (Waters, MA). NE separation was achieved on an Acquity UPLC HSS PFP column with a binary gradient. ACh separation was achieved using Acquity UPLC BEH HILIC column with a binary gradient. Three multiple-reaction monitoring transitions were set up for each analyte: one for quantification (ACh 146→87; NE 152→107), one for confirmation (ACh 146→43; NE 152→79) and one for the internal standard (ACh-d4 150→91; NE-d6 158→139). Peak integration, calibration and quantification were performed using TargetLynx quantification application manager software (v4.1, Waters, MA).
Data analysis of bulk RNA sequencing
The RNA sequencing reads were preprocessed with Cutadapt (v2.6)31 to remove the adapter sequences. Transcript quantification was performed with Salmon (v0.14.2)32 and summarized for gene-level analysis with tximport (v1.14.2)33 using the mouse transcriptome and genome annotations from Ensembl database mouse reference genome GRCm38.p6 release 9834. Differential gene expression was analyzed with quasi-likelihood F-test based on the generalized linear model implementation of edgeR (v3.30.3)35. Gene set enrichment analysis was performed with the Preranked tool of GSEA (v4.1.0)36 using the gene set collections in the molecular signatures database MSigdB release 7.137. The metric, -log10 (p-value) x log2 (fold change), obtained from the differential gene expression analysis was used to rank the genes, with the “classic” option for the enrichment score.
Data analysis of single cell RNA sequencing
Raw sequencing reads were processed with Cell Ranger (v4.0.0 pipeline, 10X Genomics) into a unique molecular identifier (UMI) – cell barcode count matrix for each sample. The R package Seurat v3.2.038 was used for analyses. Quality-control metrics were used to only retain cells with no less than 500 UMIs and 300 detected genes, with no more than 20% of the detected genes in the cell being mitochondrial genes. Very rarely-expressed genes that were not detected in more than 10 cells among all samples were filtered out. Count normalization and the detection of highly variable genes were carried out for each sample with the SCTransform workflow, followed by an integration workflow which identified shared cell states present across all samples. The integrated data were then used to perform further analysis, including dimensional reduction (with UMAP) and cell-clustering (with a graph-based approach). Niche cell clusters were identified based on characteristic signature gene expression in accordance with previously published work39. For each cluster, pseudobulk differential gene expression analysis was performed by aggregating the cells and the raw counts to the sample level, followed by differential expression analysis comparing groups with a quasi-likelihood F-test based on the generalized linear model implementation of edgeR (v3.30.3)35.
Statistical analysis
Statistical analyses were performed using GraphPad Prism (v7.0c GraphPad Software, San Diego, CA, USA). Data are presented as mean ± standard error of mean. Figure legends indicate the sample size of each individual data set and the statistical test used to calculate significance. Normality of data was tested using a D’Agostino-Pearson omnibus normality test. To compare two unpaired groups, the two-tailed Student’s t-test was used for normally distributed data and the two-tailed Mann-Whitney test for non-normally distributed data. To compare two paired groups, the paired t-test was used for normally distributed data. To compare three groups, the one-way ANOVA with post-hoc Tukey’s multiple comparisons test was used for normally distributed data. To compare two groups with analysis at different time points, a two-way ANOVA with Sidak’s post hoc test was used. For survival after MI, the Mantel–Cox log-rank test was performed. Statistical outliers were identified using the robust regression followed by outlier identification test (GraphPad Software) and excluded. Differences in raw values among groups were considered significant if P < 0.05. P values denote as *P < 0.05; **P < 0.01; ***P < 0.001; ****P < 0.0001; NS, not significant with P > 0.05.
Reporting summary
Further information on research design is available in the Nature Research Reporting Summary linked to this paper.
Data availability
The bulk and single cell RNA sequencing data have been deposited in NCBI’s Gene Expression Omnibus database under GEO Series accession numbers GSE148863 and GSE157885 respectively.
Extended Data
Extended Data Fig. 1. Acetylcholine and hematopoiesis.

a. 2,687 patients received either no donepezil (n=870), 5mg (n=996) or 10mg (n=821) donepezil daily. Mean change in circulating white red blood cell counts (RBC) and platelets between 4 weeks before and 3 months after treatment. RBC: P = 0.0453 for no donepezil group vs. 10mg donepezil group. Platelets: P = 0.0001 for no donepezil group vs. 10mg donepezil group and P = 0.0001 for 5mg donepezil group vs. 10mg donepezil group. One-way ANOVA with Sidak’s post hoc test. Box shows 25th, 50th and 75th percentile but no whiskers or outliers. Blue dot represents the mean.
b. Immunofluorescence image of a naive ChatGFP mouse femur. Section was stained with DAPI (blue; cell nucleus). Arrows indicate ChatGFP-positive nerves outside the bone marrow. The experiment was repeated two independent times with a similar result. Scale bar upper panel, 1mm. All other panels, scale bar, 70 µm.
Data are mean ± SEM with individual values for data distribution, *P<0.05, and ****P<0.0001
Extended Data Fig. 2. Bone marrow acetylcholine is produced by mature B cells.

a. Flow cytometry for Chat-GFP expression in mature B cells and B cell progenitors in the bone marrow of ChatGFP mice.
b. Flow cytometry gating for Chat-GFP expression by mature B cells in the bone marrow of ChatGFP mice and C57BL/6 mice.
c. Flow cytometry plots of GFP+ B-2 cells in the bone marrow of ChatGFP mice.
d-h. Flow cytometry plots of GFP expression by bone marrow cells in ChatGFP mice.
i. Chat mRNA levels assessed in ChatGFP mice by qPCR in FACS-isolated mature GFP+ and GFP− B cells, CD45−/Ter119− niche cells, MSC, arteriolar endothelial cells (aECs) and sinusoidal EC (sEC). P = 0.0001 for ChatGFP+ B cell group vs. ChatGFP- B cell group. n = 11 mice per ChatGFP+ B cell group and n = 10 mice per ChatGFP- B cell group, two-tailed Student’s t-test.
j. Intravital microscopy of the skull obtained in a ChatGFP mouse. Endothelial cells are labeled by injecting CD31/Sca-1 and B cells by B220. Arrows indicate GFP+ B220+ B cells. The experiment was repeated three independent times with a similar result. Scale bar, 10 µm.
k. Confocal microscopy of the femur in ChatGFP mice (green). Endothelial cells are labeled by injecting CD31/ Sca-1 (blue). B220 control staining was performed using an isotype antibody (red). The experiment was performed once. Scale bar, 15 µm.
l. Flow cytometry dot plots of cell cycle analysis of immature B cells in bone marrow of ChatGFP mice.
m. Quantification of immature B cells in S/M/G2 cell cycle phase. P = 0.0040. n = 3 mice per group, two-tailed Student’s t-test.
n. Flow cytometry plots of ChatGFP expression by circulating mature B cells in blood of ChatGFP mice.
o. Percentage and numbers of GFP+ B cells in blood of ChatGFP mice. P = 0.0006 for percentage and P = 0.0023 for numbers of GFP+ B cells. Two independent experiments, n = 7 mice per group, two-tailed Mann-Whitney test.
Data are mean ± SEM with individual values for data distribution, **P<0.01, ***P<0.001 and ****P<0.0001
Extended Data Fig. 3. Bone marrow acetylcholine preserves SLAM LSK stemness by reducing proliferation.

a. Bodyweight of Cd19CreChatfl/fl or their Chatfl/fl mice in steady-state. n = 8 mice per group, two-tailed Student’s t-test. Blood pressure in Cd19CreChatfl/fl or their Chatfl/fl mice in steady-state for 5 consecutive times and each individual measurement value is plotted. n = 8 mice per group, two-tailed Student’s t-test. Heart rate of Cd19CreChatfl/fl or Chatfl/fl mice. n = 8 mice per group, two-tailed Student’s t-test.
b. Cell cycle of HPSCs was analyzed by flow cytomery in Cd19CreChatfl/fl or Chatfl/fl mice. Left, flow cytometry plots for cell cycle analysis of LSK and SLAM LSK. Right, cell cycle analysis of LSK and SLAM LSK by flow cytometry. SLAM LSK: P = 0.021 for G0-phase, P = 0.034 for G1-phase and P = 0.038 for S/G2/M-phase. LSK: P = 0.0002 for G0-phase, P = 0.0012 for G1-phase and P = 0.0003 for S/G2/M-phase. SLAM LSK: n = 8 mice per group, LSK: n = 7 Chatfl/fl, n = 8 Cd19CreChatfl/fl mice, two-tailed Student’s t-test.
c. Limiting dilution assay. SLAM LSK from Cd19CreChatfl/fl or Chatfl/fl mice were FACS sorted and mixed with 3×10⁵ BMNC from CD45.1 mice. Cell dilutions were transplanted into lethally irradiated CD45.1 recipients. Multilineage blood chimerism of 0.1% served as a cut-off to determine responders.
d. Left table lists dilution steps, numbers of mice analyzed 4 months after transfer, and number of responders. Right table indicates HSC frequencies and 95% confidence interval (P=0.452 for difference in frequency).
e. Cd19CreChatfl/fl or Chatfl/fl mice were injected with Evans blue (20mg/kg; i.v.) and tibias were harvested 4 hours thereafter. Vascular permeability by Evans blue quantification in the tibia. P = 0.0487. n = 7 Chatfl/fl, n = 6 Cd19CreChatfl/fl mice, two-tailed Student’s t-test.
Data are mean ± SEM, n.s. P>0.05, *P<0.05, **P<0.01 and ***P<0.001.
Extended Data Fig. 4. B cell-derived acetylcholine effects in the spleen.

a. Membranes of the cytokine antibody array of the spleen, serum and bone marrow of naive Cd19CreChatfl/fl mice or their Chatfl/fl littermates. Membranes represent two independently performed experiments per group.
b. Left, flow cytometry for splenic HSPC. Right, splenic HSPC enumeration in naive Cd19CreChatfl/fl or Chatfl/fl mice. P = 0.036 for SLAM LSK, P = 0.040 for LSK. n = 7 mice per group, two-tailed Student’s t-test.
c. Leukocytes in spleen. P = 0.017 for monocytes, P = 0.038 for neutrophils. n = 7 mice per group, two-tailed Mann-Whitney test.
d. Vascular permeability was analyzed by Evans blue extraction and quantification in the spleen of Cd19CreChatfl/fl mice or Chatfl/fl mice. P = 0.0455. n = 5 mice per group, two-tailed Student’s t-test.
Data are mean ± SEM with individual values for data distribution, *P<0.05.
Extended Data Fig. 5. Splenectomy and hematopoiesis.

a. Cd19CreChatfl/fl mice or their Chatfl/fl littermates underwent splenectomy or sham-operation and the bone marrow was harvested 4 weeks later for flow cytometry and cytokine/chemokine antibody array analysis. Membranes of the cytokine/chemokine antibody array of the bone marrow supernatant of splenectomized or sham-operated Cd19CreChatfl/fl mice or their Chatfl/fl littermates. Membranes represent two independently performed experiments per group.
b. Flow cytometry plots for HSPC in the femur.
c. Bone marrow HSPC enumeration in the femur. SLAM LSK: P = 0.0040 for sham, P = 0.0051 for splenectomy, GMP: P = 0.0003 for sham, P = 0.0108 for splenectomy, CMP: P = 0.0071 for sham, P = 0.0037 for splenectomy. Two independent experiments, n = 8 Chatfl/fl mice, sham Cd19CreChatfl/fl mice and splenectomy Chatfl/fl mice; n = 9 splenectomy Cd19CreChatfl/fl mice, two-tailed Student’s t-test.
d. Flow cytometry plots for BrdU incorporation.
e. Bone marrow HSPC proliferation analyzed by BrdU incorporation using flow cytometry.
SLAM LSK: P = 0.0012 for sham, P = 0.0068 for splenectomy, GMP: P = 0.0034 for sham, P = 0.019 for splenectomy. Two independent experiments, n = 6 sham Chatfl/fl mice, n = 8 sham Cd19CreChatfl/fl mice, n = 7 splenectomy Chatfl/fl mice; n = 10 splenectomy Cd19CreChatfl/fl mice, two-tailed Student’s t-test.
Data are mean ± SEM with individual values for data distribution, *P<0.05, **P<0.01 and ***P<0.001
Extended Data Fig. 6. Chrna7+ expression by bone marrow cells.

a. Acetylcholine receptor mRNA levels in bone marrow MSCs, ECs and osteolineage cells. Deposited data from reference22. n.d., not detectable. Data are mean ± SEM with individual values for data distribution.
b. Flow cytometry plots for Chrna7 expression on GFP+ immature and mature B cells in the bone marrow of ChatGFP mice.
c-f. Flow cytometry plots for Chrna7 expression on leukocytes in the bone marrow of C57BL/6 mice.
Extended Data Fig. 7. Chrna7+ bone marrow stromal cells.

a. Dot plot of signature gene expression in Chrna7+ bone marrow cell clusters assessed by single cell RNA sequencing. Chrna7+ bone marrow stromal cells were pooled post-hoc from Chatfl/fl and Cd19Cre Chatfl/fl steady-state mice (15,590 non-hematopoietic cells; n = 8 mice). Color indicates z-score of average gene expression (red, high; blue, low), circle size indicates percent of cells expressing the gene.
b. Cd19CreChatfl/fl mice or their Chatfl/fl littermates were treated with AMD3100 (5 mg/kg; s.c.) or vehicle and blood was collected 4h after treatment for colony forming unit (c.f.u.) and flow cytometry analysis. Circulating c.f.u. assay expressed as fold change over vehicle-treated mice of same genotype. P = 0.0047. n = 7 mice per Chatfl/fl group and n = 6 per Cd19CreChatfl/fl group, two-tailed Mann-Whitney test.
c. Blood leukocytes expressed as fold change over vehicle-treated mice of same genotype. P = 0.0024. n = 7 mice per Chatfl/fl group and n = 6 per Cd19CreChatfl/fl group, two-tailed Mann-Whitney test.
d. Bone marrow supernatant was harvested from naive Cd19CreChatfl/fl mice or their Chatfl/fl littermates and Tnfα protein was analyzed by ELISA. P = 0.0024. n = 7 mice per Chatfl/fl group and n = 6 per Cd19CreChatfl/fl group, two-tailed Mann-Whitney test. e. Left, flow cytometry plots for gating of CD31+ endothelial cells (ECs) and LepR+ MSCs in the bone marrow. Right, flow cytometry histogram plots of Chrna7 expression on ECs (left) and LepR+ MSCs (right). Numbers in the histogram represent the mean fluorescence intensity of 3 mice per group. Bar graphs represent the percentage of Chrna7+ cells among ECs or LepR+ MSCs. Gates were set using an Chrna7 isotype control antibody. P = 0.0076 for LepR+ MSCs. n = 3 mice per group, two-tailed Student’s t test.
Data are mean ± SEM with individual values for data distribution, *P<0.05 and **P<0.01.
Extended Data Fig. 8. B cell-derived acetylcholine in mice with atherosclerosis.

a. Cd19CreChatfl/fl mice or their Chatfl/fl littermates were intravenously injected with an adeno-associated virus 2/8 encoding hPCSK9 and fed a high-fat diet (HFD) for 12 weeks. Serum cholesterol levels after 12 weeks of HDF. Two independent experiments, n = 6 mice per Chatfl/fl group and n = 8 per Cd19CreChatfl/fl group, two-tailed Mann-Whitney test.
b. Aortic roots were harvested from ChatGFP mice with atherosclerosis for flow cytometry and histology analysis. GFP+ B cell abundance in the femur and aorta of ChatGFP mice assessed by flow cytometry. P = 0.0038 absolute number data and P = 0.0094 for relative frequency data. n = 4 mice per group, two-tailed Student’s t test.
c. Immunofluorescence image of the aortic roots in ChatGFP mice (green). Sections were stained with B220 (red) and DAPI (blue). The experiment was performed with 4 independent mice, which all showed a similar result. Scale bar, 200µm.
d. Higher magnification images of areas indicated in e. Arrow heads indicate ChatGFP-positive nerve fiber, arrows indicate B220+ B cells. The experiment was performed with 4 independent mice, which all showed a similar result. Scale bar in panel 1, 10µm, all other panels 20µm.
Data are mean ± SEM with individual values for data distribution, **P<0.01.
Extended Data Fig. 9. Splenic hematopoiesis after MI is curbed by B-cell derived acetylcholine.

a. Cd19CreChatfl/fl and Chatfl/fl mice were subjected to myocardial infarction (MI) and harvested 6 days later. HSPC in the spleen 6d after MI measured by c.f.u. assay. P = 0.0325. n = 5 mice per group, two-tailed Student’s t-test.
b. Flow cytometry plots for splenic HSPC 6d after MI.
c. Splenic HSPC enumeration 6d after MI. P = 0.047 for SLAM LSK, P = 0.0140 for LSK, P = 0.020 for CMP and P = 0.011 for GMP. n = 5 mice per group, two-tailed Student’s t-test.
d. Leukocytes in spleen 6d after MI. n = 5 mice per group, two-tailed Student’s t-test.
e. Cd19CreChatfl/fl and Chatfl/fl mice underwent splenectomy. 3 weeks after surgery, mice were subjected to MI and harvested 3 days later for flow cytometry. C57BL/6 mice were used as controls in the no splenectomy group. Flow cytometry plots for HSPC in the bone marrow 3 d after MI in splenectomized mice.
f. Bone marrow HSPC enumeration. Two independent experiments, SLAM LSK: P = 0.030 for no splenectomy, P = 0.014 for splenectomy. CMP: P = 0.0095 for no splenectomy, P = 0.048 for splenectomy. SLAM LSK: n = 6 no splenectomy Chatfl/fl mice, n = 5 no splenectomy Cd19CreChatfl/fl mice, n = 8 splenectomy Chatfl/fl mice, n = 7 splenectomy Cd19CreChatfl/fl mice. CMP: n = 7 no splenectomy Chatfl/fl mice, n = 6 no splenectomy Cd19CreChatfl/fl mice, n = 8 splenectomy Chatfl/fl mice, n = 7 splenectomy Cd19Cre Chatfl/fl mice, two-tailed Student’s t-test.
g. Myeloid cells and neutrophils in circulation 3 d after MI. Myeloid cells: P = 0.0053 for no splenectomy, P = 0.0009 for splenectomy. Neutrophils: P = 0.011 for no splenectomy, P = 0.016 for splenectomy. Two independent experiments, n = 12 no splenectomy Chatfl/fl mice, n = 10 no splenectomy Cd19CreChatfl/fl mice, n = 8 splenectomy Chatfl/fl mice, n = 7 no splenectomy Cd19CreChatfl/fl mice, two-tailed Student’s t-test.
h. Flow cytometry plots of myeloid cells in the infarct myocardium 3 d after MI in splenectomized mice.
i. Myeloid cell and neutrophil numbers in the infarct myocardium 3 d after MI.
Myeloid cells: P = 0.037 for no splenectomy, P = 0.027 for splenectomy. Neutrophils: P = 0.0006 for no splenectomy, P = 0.041 for splenectomy. Two independent experiments, n = 12 no splenectomy Chatfl/fl mice, n = 9 no splenectomy Cd19CreChatfl/fl mice, n = 8 splenectomy Chatfl/fl mice, n = 7 no splenectomy Cd19CreChatfl/fl mice, two-tailed Student’s t-test.
Data are mean ± SEM with individual values for data distribution, *P<0.05, **P<0.01 and ***P<0.001.
Extended Data Fig. 10. Acetylcholinesterase inhibitor contains hematopoiesis and inflammation after MI.

a. C57BL/6 mice receiving either saline or pyridostigmine for 4 weeks were subjected to myocardial infarction (MI) and assayed 3 days after MI. Flow cytometry plots for HSPC.
b. Bone marrow HSPC, CMP, GMP and MDP enumeration using flow cytometry. P = 0.019 for SLAM LSK, P = 0.039 for CMP, P = 0.0059 for GMP and P = 0.0057 for MDP. Two independent experiments, n = 12 saline and n = 11 mice pyridostigmine, two-tailed Student’s t-test.
c. C.f.u. assay of bone marrow mononuclear cells (BMNCs) for granulocytes and macrophages progenitors (GMs). P = 0.040. n = 5 saline, n = 4 mice pyridostigmine group, two-tailed Mann-Whitney test.
d. Circulating HSPC measured by c.f.u. assay. P = 0.0159. n = 5 saline, n = 4 mice pyridostigmine, two-tailed Mann-Whitney test.
e. Flow cytometry plots for circulating myeloid cells.
f. Leukocyte subsets in circulation. P = 0.0015 for leukocytes, P = 0.026 for monocytes, P = 0.046 for Ly6high monocytes and P = 0.026 for neutrophils. Two independent experiments, n = 13 saline, n = 11 pyridostigmine mice, two-tailed Student’s t-test.
g. Flow cytometry plots of myeloid cells in the infarct myocardium 3 days after MI.
h. Myeloid cell numbers in the infarct myocardium 3 days after MI. P = 0.0093 for myeloid cells, P = 0.0056 for neutrophils, P = 0.0460 for monocytes and P = 0.0140 for macrophages. Two independent experiments, n = 13 saline, n = 11 pyridostigmine mice, two-tailed Student’s t-test.
i. Myeloid cell numbers in the remote myocardium 3 days after MI. P = 0.049 for macrophages. Two independent experiments, n = 13 saline, n = 11 pyridostigmine mice, two-tailed Student’s t-test.
i. C57BL/6 mice receiving either saline or pyridostigmine for 4 weeks were subjected to MI and harvested 7 days after MI. Immunohistochemical staining and quantification of CD11b+ myeloid cells, collagen I, α-smooth muscle actin+ myofibroblasts and CD31+ vessels in the infarct border zone 7d after MI. Bar graphs show percentage of positive staining per region of interest (ROI). Each data point represents a ROI and 4 ROI were analyzed per mouse. P = 0.023 for CD11b and P = 0.0041 for collagen I. Two independent experiments, n = 4 saline, n = 3 pyridostigmine mice, two-tailed Student’s t-test.
k. Survival after MI. P = 0.697. Two independent experiments, n = 9 saline, n = 10 pyridostigmine mice, Mantel–Cox log-rank test.
Data are mean ± SEM with individual values for data distribution, *P<0.05 and **P<0.01.
Supplementary Material
Acknowledgements
We thank M. Handley, D. Daly, J. Kauffman, P. Sen, G. Lima, J. Choi and E. Surette of the HSCI-CRM Flow Cytometry Core Facility, Massachusetts General Hospital, for their assistance with cell sorting; the Bioanalytics Core at the Diabetes and Obesity Center, Christina Lee Brown Envirome Institute, University of Louisville, for mass spectrometry analysis; the BPF Next-Gen Sequencing Core Facility at Harvard Medical School for their expertise and instrument availability in support of this work and the Partners Healthcare Research Patient Data Registry group for facilitating use of their database. We thank Kaley Joyes, PhD, for editing the article. Figures were designed using Servier Medical Art (http://www.servier.com).
Funding:
This work was supported in part by the National Institutes of Health grants HL142494, NS108419, HL139598, HL125428, HL155097, HL149647, T32HL076136 and the MGH Research Scholar program. M.J. Schloss and D. Rohde were funded by Deutsche Forschungsgemeinschaft (SCHL 2221/1–1 and RO5071/1–1). M. Hulsmans was supported by an American Heart Association Career Development Award (19CDA34490005). C.S. McAlpine was funded by NIH K99HL151750 and a Canadian Institutes of Health Research Banting Fellowship. J.M. Higgins and B.H. Foy were supported by a grant from the One Brave Idea Initiative. G. Santos-Masson was funded by the Fundação Lemann. The University of Louisville Diabetes and Obesity Center was supported by NIH P30 GM127607 and user fees. The Microscopy Core facility of the Massachusetts General Hospital (MGH) Program in Membrane Biology receives support from Boston Area Diabetes and Endocrinology Research Center grant DK57521 and Center for the Study of Inflammatory Bowel Disease grant DK43351.
Footnotes
Competing interest declarations
M.N. has received funds or material research support from Alnylam, Biotronik, CSL Behring, GlycoMimetics, GSK, Medtronic, Novartis and Pfizer, as well as consulting fees from Biogen, Gimv, IFM Therapeutics, Molecular Imaging, Sigilon and Verseau Therapeutics. The other author declares no competing interests.
References
- 1.Lahiri MK, Kannankeril PJ & Goldberger JJ Assessment of autonomic function in cardiovascular disease: physiological basis and prognostic implications. J Am Coll Cardiol 51, 1725–1733 (2008). [DOI] [PubMed] [Google Scholar]
- 2.Mancia G & Grassi G The autonomic nervous system and hypertension. Circulation research 114, 1804–1814 (2014). [DOI] [PubMed] [Google Scholar]
- 3.Florea VG & Cohn JN The autonomic nervous system and heart failure. Circulation research 114, 1815–1826 (2014). [DOI] [PubMed] [Google Scholar]
- 4.Herring N, Kalla M & Paterson DJ The autonomic nervous system and cardiac arrhythmias: current concepts and emerging therapies. Nature Reviews Cardiology 1–20 (2019). [DOI] [PubMed]
- 5.Fujii T et al. Physiological functions of the cholinergic system in immune cells. J Pharmacol Sci 134, 1–21 (2017). [DOI] [PubMed] [Google Scholar]
- 6.Heeschen C et al. Nicotine stimulates angiogenesis and promotes tumor growth and atherosclerosis. Nature medicine 7, 833–839 (2001). [DOI] [PubMed] [Google Scholar]
- 7.Corradi J & Bouzat C Understanding the bases of function and modulation of α7 nicotinic receptors: implications for drug discovery. Molecular pharmacology 90, 288–299 (2016). [DOI] [PubMed] [Google Scholar]
- 8.Wang H et al. Nicotinic acetylcholine receptor α7 subunit is an essential regulator of inflammation. Nature 421, 384–388 (2003). [DOI] [PubMed] [Google Scholar]
- 9.Tracey KJ The inflammatory reflex. Nature 420, 853–859 (2002). [DOI] [PubMed] [Google Scholar]
- 10.Katayama Y et al. Signals from the sympathetic nervous system regulate hematopoietic stem cell egress from bone marrow. Cell 124, 407–421 (2006). [DOI] [PubMed] [Google Scholar]
- 11.Maryanovich M, Takeishi S & Frenette PS Neural Regulation of Bone and Bone Marrow. Cold Spring Harb Perspect Med 8, (2018). [DOI] [PMC free article] [PubMed] [Google Scholar]
- 12.Chang RB, Strochlic DE, Williams EK, Umans BD & Liberles SD Vagal Sensory Neuron Subtypes that Differentially Control Breathing. Cell 161, 622–633 (2015). [DOI] [PMC free article] [PubMed] [Google Scholar]
- 13.Artico M et al. Noradrenergic and cholinergic innervation of the bone marrow. Int J Mol Med 10, 77–80 (2002). [PubMed] [Google Scholar]
- 14.Santisteban MM, Zubcevic J, Baekey DM & Raizada MK Dysfunctional brain-bone marrow communication: a paradigm shift in the pathophysiology of hypertension. Curr Hypertens Rep 15, 377–389 (2013). [DOI] [PMC free article] [PubMed] [Google Scholar]
- 15.Jiang W et al. Acetylcholine-producing NK cells attenuate CNS inflammation via modulation of infiltrating monocytes/macrophages. Proceedings of the National Academy of Sciences 114, E6202–E6211 (2017). [DOI] [PMC free article] [PubMed] [Google Scholar]
- 16.Reardon C et al. Lymphocyte-derived ACh regulates local innate but not adaptive immunity. Proceedings of the National Academy of Sciences 110, 1410–1415 (2013). [DOI] [PMC free article] [PubMed] [Google Scholar]
- 17.Rosas-Ballina M et al. Acetylcholine-synthesizing T cells relay neural signals in a vagus nerve circuit. Science 334, 98–101 (2011). [DOI] [PMC free article] [PubMed] [Google Scholar]
- 18.Hirsch NP Neuromuscular junction in health and disease. Br J Anaesth 99, 132–138 (2007). [DOI] [PubMed] [Google Scholar]
- 19.Kiel MJ et al. SLAM family receptors distinguish hematopoietic stem and progenitor cells and reveal endothelial niches for stem cells. Cell 121, 1109–1121 (2005). [DOI] [PubMed] [Google Scholar]
- 20.Rosas-Ballina M et al. Splenic nerve is required for cholinergic antiinflammatory pathway control of TNF in endotoxemia. Proc Natl Acad Sci U S A 105, 11008–11013 (2008). [DOI] [PMC free article] [PubMed] [Google Scholar]
- 21.Costantini TW et al. Uniquely human CHRFAM7A gene increases the hematopoietic stem cell reservoir in mice and amplifies their inflammatory response. Proc Natl Acad Sci U S A 116, 7932–7940 (2019). [DOI] [PMC free article] [PubMed] [Google Scholar]
- 22.Tikhonova AN et al. The bone marrow microenvironment at single-cell resolution. Nature 569, 222–228 (2019). [DOI] [PMC free article] [PubMed] [Google Scholar]
- 23.Ding L & Morrison SJ Haematopoietic stem cells and early lymphoid progenitors occupy distinct bone marrow niches. Nature 495, 231–235 (2013). [DOI] [PMC free article] [PubMed] [Google Scholar]
- 24.Tzeng YS et al. Loss of Cxcl12/Sdf-1 in adult mice decreases the quiescent state of hematopoietic stem/progenitor cells and alters the pattern of hematopoietic regeneration after myelosuppression. Blood 117, 429–439 (2011). [DOI] [PubMed] [Google Scholar]
- 25.Arai F et al. Tie2/angiopoietin-1 signaling regulates hematopoietic stem cell quiescence in the bone marrow niche. Cell 118, 149–161 (2004). [DOI] [PubMed] [Google Scholar]
- 26.Ding L, Saunders TL, Enikolopov G & Morrison SJ Endothelial and perivascular cells maintain haematopoietic stem cells. Nature 481, 457–462 (2012). [DOI] [PMC free article] [PubMed] [Google Scholar]
- 27.Dutta P et al. Myocardial Infarction Activates CCR2(+) Hematopoietic Stem and Progenitor Cells. Cell Stem Cell 16, 477–487 (2015). [DOI] [PMC free article] [PubMed] [Google Scholar]
- 28.Beerman I et al. Functionally distinct hematopoietic stem cells modulate hematopoietic lineage potential during aging by a mechanism of clonal expansion. Proc Natl Acad Sci U S A 107, 5465–5470 (2010). [DOI] [PMC free article] [PubMed] [Google Scholar]
- 29.Bernitz JM, Kim HS, MacArthur B, Sieburg H & Moore K Hematopoietic Stem Cells Count and Remember Self-Renewal Divisions. Cell 167, 1296–1309.e10 (2016). [DOI] [PMC free article] [PubMed] [Google Scholar]
- 30.Dykstra B, Olthof S, Schreuder J, Ritsema M & de Haan G Clonal analysis reveals multiple functional defects of aged murine hematopoietic stem cells. J Exp Med 208, 2691–2703 (2011). [DOI] [PMC free article] [PubMed] [Google Scholar]
- 31.Martin M Cutadapt removes adapter sequences from high-throughput sequencing reads. EMBnet. journal 17, 10–12 (2011). [Google Scholar]
- 32.Patro R, Duggal G, Love MI, Irizarry RA & Kingsford C Salmon provides fast and bias-aware quantification of transcript expression. Nature methods 14, 417 (2017). [DOI] [PMC free article] [PubMed] [Google Scholar]
- 33.Soneson C, Love MI & Robinson MD Differential analyses for RNA-seq: transcript-level estimates improve gene-level inferences. F1000Res 4, 1521 (2015). [DOI] [PMC free article] [PubMed] [Google Scholar]
- 34.Cunningham F et al. Ensembl 2019. Nucleic Acids Res 47, D745–D751 (2019). [DOI] [PMC free article] [PubMed] [Google Scholar]
- 35.McCarthy DJ, Chen Y & Smyth GK Differential expression analysis of multifactor RNA-Seq experiments with respect to biological variation. Nucleic Acids Res 40, 4288–4297 (2012). [DOI] [PMC free article] [PubMed] [Google Scholar]
- 36.Mootha VK et al. PGC-1alpha-responsive genes involved in oxidative phosphorylation are coordinately downregulated in human diabetes. Nat Genet 34, 267–273 (2003). [DOI] [PubMed] [Google Scholar]
- 37.Subramanian A et al. Gene set enrichment analysis: a knowledge-based approach for interpreting genome-wide expression profiles. Proc Natl Acad Sci U S A 102, 15545–15550 (2005). [DOI] [PMC free article] [PubMed] [Google Scholar]
- 38.Butler A, Hoffman P, Smibert P, Papalexi E & Satija R Integrating single-cell transcriptomic data across different conditions, technologies, and species. Nat Biotechnol 36, 411–420 (2018). [DOI] [PMC free article] [PubMed] [Google Scholar]
- 39.Baryawno N et al. A Cellular Taxonomy of the Bone Marrow Stroma in Homeostasis and Leukemia. Cell 177, 1915–1932.e16 (2019). [DOI] [PMC free article] [PubMed] [Google Scholar]
Associated Data
This section collects any data citations, data availability statements, or supplementary materials included in this article.
Supplementary Materials
Data Availability Statement
The bulk and single cell RNA sequencing data have been deposited in NCBI’s Gene Expression Omnibus database under GEO Series accession numbers GSE148863 and GSE157885 respectively.