

Abstract
Identifying the genetic determinants of inter-individual variation in lipid species (lipidome) may provide deeper understanding and additional insight into the mechanistic effect of complex lipidomic pathways in CVD risk and progression beyond simple traditional lipids. Previous studies have been largely population based and thus only powered to discover associations with common genetic variants. Founder populations represent a powerful resource to accelerate discovery of previously unknown biology associated with rare population alleles that have risen to higher frequency due to genetic drift. We performed a genome-wide association scan of 355 lipid species in 650 individuals from the Amish founder population including 127 lipid species not previously tested. To the best of our knowledge, we report for the first time the lipid species associated with two rare-population but Amish-enriched lipid variants: APOB_rs5742904 and APOC3_rs76353203. We also identified novel associations for 3 rare-population Amish-enriched loci with several sphingolipids and with proposed potential functional/causal variant in each locus including GLTPD2_rs536055318, CERS5_rs771033566, and AKNA_rs531892793. We replicated 7 previously known common loci including novel associations with two sterols: androstenediol with UGT locus and estriol with SLC22A8/A24 locus. Our results show the double power of founder populations and detailed lipidome to discover novel trait-associated variants.
Subject terms: Genetics, Biomarkers
A GWAS of 355 lipid species in the Old Order Amish founder population reveals associations between Amish-enriched loci and several sphingolipids.
Introduction
Cardiovascular disease is the leading cause of death worldwide1. Besides the well-known role of traditional lipids (total [TC], low-density lipoprotein [LDL], and high-density lipoprotein [HDL] cholesterol and triglycerides [TG]) in CVD risk and progression, molecular lipid species (lipidome) were also found to be an independent contributors2. Previous studies identified ceramides as a key player in atherogenesis3, found variable effects of phospholipids and TG species on CVD based on the degree of saturation4–7, and was able to improve risk prediction by adding lipid species6,8. Identifying the genetic determinants of inter-individual variation in lipidome may provide deeper understanding beyond traditional lipids, and may lead to additional insight into the mechanistic effect of lipid variants and their role in CVD risk and progression2. Previous studies tested lipidome genetic determinants either as a small part of large metabolite studies or in a small number of candidate lipid species (full list of studies available in Hagenbeek9), with the exception of a published study that performed a focused lipidome genome-wide association scan (GWAS) for 141 lipid species in 2181 Finnish individuals. Here, we performed a GWAS in 650 individuals from the Old Order Amish (OOA) founder population using an expanded number of 355 lipid species from 14 classes that included 127 not previously tested for genetic association. Founder populations can facilitate the identification of previously unknown disease associations with variants that are enriched to a higher frequency through genetic drift. Multiple examples have been recently reported of highly enriched variants with large effect sizes associated with complex diseases and traits in homogenous populations in Iceland10, Sardinia11, Greenland12, Samoa13 and OOA14–21. While such drifted variants are often rare or absent in the general population, their associations can inform biological mechanisms and therapeutic targets relevant to all humans. The population-based Genetics of Lipid Lowering Drugs and Diet Network (GOLDN) study22–25 was used for replication and fine mapping, and publicly available association results databases from several large biobanks were used to look up the top results. We identified five rare-population but Amish-enriched loci, three of which are novel, and replicated 7 previously known common loci including two loci with novel trait associations. These results demonstrate the power of detailed lipidome profiling in a founder population to identify novel rare variants enriched through genetic drift to accelerate lipid loci discovery and substantially advance our understanding of the genetic role in lipid biology.
Results
Additive and dominant heritability
The narrow sense heritability, defined as the ratio of additive variance to phenotypic variance, was estimated for each lipid species and traditional lipid using a mixed model with pedigree kinship covariance matrix. We also tested if dominance variance contributes to lipidome genetic architecture by comparing the additive model to a model that included a dominance and additive effect using a likelihood ratio test. No lipid species or traditional lipid showed significant dominant variance after Bonferroni correction, indicating that the lipidomic genetic architecture is primarily additive.
The full list of heritability estimates of the 355 lipid species measured in 650 individuals from the Old Order Amish (OOA) founder population (Supplementary Data 1) with and without adjustment for 4 Amish-enriched large effect lipid variants (APOB_rs574290415, APOC3_rs7635320314, B4GALT1_rs55156468321, TIMD4_rs89895600320) (4 variants) is provided in Supplementary Data 2. Figure 1a shows that the heritabilities range between 0 and 0.7, with significant attenuation when adjusting for the 4 variants as they account for a significant proportion of the phenotypic variance. The (near-) zero estimates reflect potential lack of genetic contribution to the lipid species. The histogram suggests a bi-modal distribution with second mode near 0.55 driven mainly by sphingolipids including ceramides (Cer), sphingomyelins (SM) and glycosphingolipids (GlcCer). Figure 1b shows heritability estimates for each lipidome class with and without 4 variants adjustment. Each class has non-zero median heritability, and most classes show considerable variability. The highest heritability was reported for GlcCer (0.35 – 0.69) while acylcarnitines (ACT) was the lowest (0.01 - 0.22). Consistent with previous reports26–28, we found sphingolipids to have higher heritability than glycerolipids. The contribution of the 4 variants varied across class. The classes with the biggest difference were cholesteryl ester (CE), Cer, GlcCer, SM and phosphatidylethanolamine (PE) primarily driven by the LDL-increasing APOB_rs5742904 variant. Many classes showed little change in median or variation, including triglycerides (TAG), where the overall impact of APOC3_rs76353203 null variant on heritability was small. The difference between the two variants can be explained by their different impact on traditional lipids: APOC3_rs76353203 accounts for ~3% of the TG variance (h2 = 0.398 vs 0.368 adjusted) whereas APOB_rs5742904 accounts for ~18% of LDL-C variance (h2 = 0.68 vs 0.5 adjusted).
Fig. 1. Heritability of the lipid species.
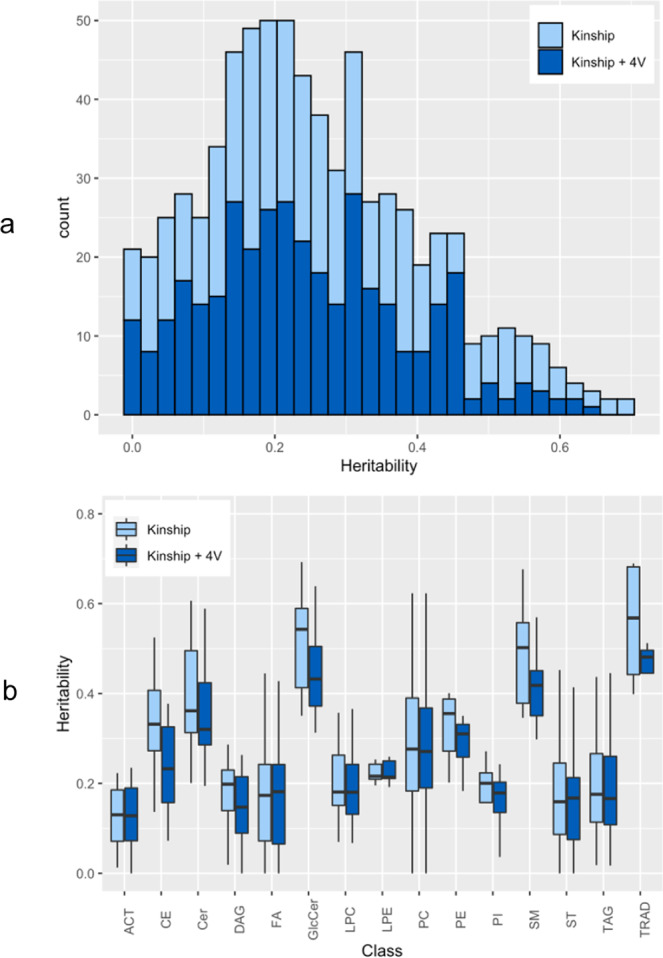
a Histogram showing the heritability distribution for all lipid species. b Box plot for the heritability by class. Heritabilities presented as unadjusted and adjusted for 4 Amish-enriched lipid variants (APOB_rs574290415, APOC3_rs7635320314, B4GALT1_rs55156468321, TIMD4_rs89895600320). The upper, center, and lower line of the boxplot indicates third quartile (Q3), median, first quartile (Q1), respectively. The upper and lower whisker of the boxplot indicates Q3 + 1.5 * interquartile range (IQR) and Q1 − 1.5 * IQR. Outliers are suppressed from the plot for readability. ACT Acylcarnitine, CE Cholesteryl ester, Cer Ceramide, DAG Diglycerides, FA Fatty acids, GlcCer Glycosphingolipids, LPC Lysophosphatidylcholines, LPE Lysophosphatidylethanolamines, PC Phosphatidylcholines, PE Phosphatidylethanolamine, PI Phosphatidylinositol, SM Sphingomyelin, TAG Triglycerides, ST Sterols, TRAD Traditional lipids.
Genetic contribution of traditional lipids to lipidome
To estimate the genetic contribution of previously identified traditional lipid GWAS variants to lipidome variance, a SNP genetic relationship matrix (SNP GRM) was constructed using the variants and included with the kinship matrix in the mixed model for joint variance estimation. The impact of SNP GRM on the heritability estimates in the joint model compared to baseline heritability with no SNP GRM is shown in Fig. 2. In general, known lipid GWAS variants had a small contribution to the genetic variation which vary between classes and by lipid SNP GRM within class. The greater the contribution of the SNP GRM to lipidome class variance, the lower the residual heritability estimates. For example, between lipid SNP GRM variability is small within sterols but significant within Lysophosphatidylcholines (LPC) and within Lysophosphatidylethanolamines (LPE). HDL and TG associated variants almost explain no variance of SM while LDL and TC associated variants explain over 15% of SM, which agrees with the role of SM and cholesterol in the structure of plasma membranes. TG associated variants explain a larger proportion of TAG than other lipid associated variants, as expected.
Fig. 2. Contribution of previously identified lipid GWAS variants to lpidomics variance.

Heritability estimates using adjusted kinship separately (Adjusted for 4 Amish-enriched lipid variants (APOB_rs574290415, APOC3_rs7635320314, B4GALT1_rs55156468321, TIMD4_rs89895600320) and then jointly with a SNP GRM for each traditional lipid. Analysis restricted to 194 lipid species with baseline significant heritability (Kinship + 4 V heritability p-value < 0.01). The upper, center, and lower line of the boxplot indicates third quartile (Q3), median, first quartile (Q1), respectively. The upper and lower whisker of the boxplot indicates Q3 + 1.5 * interquartile range (IQR) and Q1 − 1.5 * IQR. Outliers are suppressed from the plot for readability. ACT Acylcarnitine, CE Cholesteryl ester, Cer Ceramide, DAG Diglycerides, FA Fatty acids, GlcCer Glycosphingolipids, LPC Lysophosphatidylcholines, LPE Lysophosphatidylethanolamines, PC Phosphatidylcholines, PE Phosphatidylethanolamine, PI Phosphatidylinositol, SM Sphingomyelin, TAG Triglycerides, ST Sterols.
Genetic and phenotype correlation
Pairwise genetic and phenotypic correlation for 355 lipid species and 4 traditional lipids combined are shown in Supplementary Data 3 and Supplementary Fig. 1 (heatmap). In general, genetic and phenotypic correlation were lower between classes than within classes. SMs, TAGs, and diglycerides (DAGs) exhibited the strongest within class correlation, and as expected the strongest between class correlation was found for TAGs with DAGs. While TAGs exhibited the strongest within class correlation, we found that the correlation between TAG pairs where both species have > = 54 carbons and > = 4 double bonds were significantly stronger and less variable (p < 2.2E-16) than correlation between pairs where one or both species have <54 carbons and <4 double bonds (Supplementary Fig. 2). The phenotypic correlations have both smaller median values and less variance than genetic correlations even with larger number of pairs due to phenotypic correlations having greater precision since there is no maximum likelihood estimation required.
The correlation with traditional lipids were also generally limited, with the exception of TAGs and DAGs that had the strongest positive genetic correlations with traditional TG, and the strongest negative correlation with HDL. These results are in line with a previous finding26 and explain the limited contribution of traditional lipid genetics to the lipid species (Fig. 1b). This limited overlap highlights the value that lipid species would contribute to understanding CVD risk factors beyond traditional lipids8.
Lipidome contribution to traditional lipids
Understanding the relative contribution of each lipid species to traditional lipid and the interplay between components will help us to gain insight into their architecture. The estimated proportion of each traditional lipid variance explained by kinship and each lipidome class are shown in Supplementary Fig. 3. The lipidome class was included in the mixed model by constructing covariance matrix between the species in the class (see Methods). All classes explained a significant proportion of lipid variation with different magnitudes (Supplementary Data 4). For example, while PC was the most statistically significant class for HDL and LDL, it was the 2nd for TC and the 3rd for TG. Not surprisingly, the most significant class across all lipids is TAG with TG. The least significant class on average was acylcarnitines (ACT).
We also performed a sequential analysis to determine which lipidome classes jointly with the kinship explain the greatest amount of variance of each traditional lipid. Supplementary Data 5 shows the decomposition with the class, remaining unexplained heritability, and residual error variance estimates. HDL maxed out at 3 classes, LDL and TC at 5 classes and TG at 4 classes. Compared to the single class model in Supplementary Data 4 the magnitude and precision of the estimates in the multi-class models may differ due to potential correlation between classes. The heritability estimates in the multi-class are reduced to less than 0.16 as more of the additive variance is accounted for by additional lipidome classes. The decomposition differs by lipid. TG is primarily composed of TAG (34%) with DAG and PC, accounting for ~ 5%, while the 3 other lipids have at least two classes with high proportions. LDL has the lowest residual variance at 20% indicating the phenotypic architecture of LDL may be more influenced by lipidome than other lipids. Overall, the variance component analyses show that lipidome classes contribute a significant portion of the variance of traditional lipids but there remains 10-15% heritability unexplained by lipidome, which again indicate the differences in genetic architecture.
GWAS results
We performed a GWAS for 355 lipid species with ~8 million genetic variants in 639 Amish individuals with both phenotype and genotype information. We identified 12 significantly associated signals (p < 4.5E-10, using 5E-08/110, based on the first 110 principal components explaining > 95% of the variance in the 355 lipid species), five were Amish-enriched rare-population variants, three of which have not been previously reported, and seven were common variants that were previously associated with lipid species (Table 1, Figs. 3 and 4).
Table 1.
Genomic loci significantly associated with lipid species.
| SNP | Position | A1/A2 | A2_Freq_Amish | A2_Freq_Eur | Top associated trait | Effecta | P-value | Gene | Type | GOLDN effecta | GOLDN P-value |
|---|---|---|---|---|---|---|---|---|---|---|---|
| Rare-population Amish-enriched loc | |||||||||||
| rs5742904 | 2:21006288 | C/T | 0.0634 | 0.0004 | SM(d34:1) | 1.22 | 7.89E-25 | APOB | missense | - | - |
| rs7863920 | 9:115987317 | G/A | 0.0433 | 0.0169 | GlcCer(d42:2) | −1.14 | 6.22E-18 | LINC00474 | intergenic | - | - |
| rs76353203 | 11:116830637 | C/T | 0.0219 | 0.0008 | PE(36:2) | −1.45 | 6.29E-13 | APOC3 | nonsense | - | - |
| rs147698408 | 12:50001009 | T/C | 0.0447 | 0.0159 | SM(d32:2) | −1.06 | 1.79E-14 | RACGAP1 | intronic | - | - |
| rs536055318 | 17:4790207 | G/A | 0.0762 | 0.0014 | SM(d40:0) | −0.76 | 1.14E-12 | GLTPD2 | missense | - | - |
| Common known loci | |||||||||||
| rs887829 | 2:233759924 | C/T | 0.4194 | 0.3272 | androstenediol | 0.44 | 1.23E-15 | UGT1A,3,10 | intronic | −0.02 | 7.25E-01 |
| rs3778167 | 6:11033235 | T/C | 0.2771 | 0.4233 | PC(42:5) | −0.40 | 3.65E-10 | ELOVL2 | intronic | −0.24 | 3.78E-06 |
| rs174578 | 11:61838027 | T/A | 0.2515 | 0.3552 | PC(37:4) | −0.78 | 6.33E-36 | FADS2 | intronic | −0.43 | 2.32E-14 |
| rs184061227 | 11:63073643 | A/G | 0.0555 | 0.0714 | estriol | 0.98 | 1.05E-15 | SLC22A24 | intergenic | −0.22 | 2.70E-02 |
| rs10468017 | 15:58386313 | C/T | 0.2621 | 0.2869 | PE(36:4) | 0.48 | 7.32E-15 | LIPC | intergenic | 0.28 | 2.76E-07 |
| rs1321940 | 20:12979237 | A/G | 0.5239 | 0.6014 | Cer(d43:1) | −0.69 | 3.37E-32 | LOC101929486 | intergenic | −0.45 | 2.95E-19 |
| rs360525 | 20:13020644 | G/A | 0.0728 | 0.1240 | Cer(d43:1) | 0.86 | 5.34E-15 | SPTLC3 | intronic | 0.19 | 7.58E-03 |
A1: Non-coded allele
A2: Effect allele
A2_freq: Effect allele frequency
aEffect size in standard deviation units
Position: Variant position according to hg38
In bold: Novel locus, or novel trait in a known locus
Cer: Ceramide
GlcCer: Glycosphingolipids
PC: Phosphatidylcholines
PE: Phosphatidylethanolamine
SM: Sphingomyelin
Fig. 3. Lipidomic association results.

a Manhattan plot for the association results of all 355 lipid species in 639 Amish subjects. Amish-enriched loci denoted in red, previously known signals denoted in blue and previously known signals with novel trait association and/or novel variant in known loci in green. Blue line marks a genome-wide suggestive threshold (5.0E-08) and red line marks a genome-wide significant threshold (4.5E-10). b GWAS results for all significantly associated lipid species in Amish-enriched loci. c GWAS results for all significantly associated lipid species in previously known loci. All p-values based on t-test using additive genetic model. CE Cholesteryl ester, Cer Ceramide, GlcCer Glycosphingolipids, PC Phosphatidylcholines, PE Phosphatidylethanolamine, SM Sphingomyelin.
Fig. 4. Rare-population but Amish-enriched loci.

Locus zoom for 5 loci in a, chromosome 2 with SM(d34:1) b, chromosome 9 with GlcCer(d42:2) c, chromosome 11 with PE(36:2) d, chromosome 12 with SM(d32:2) and e, chromosome 17 with SM(d40:0). All p-values based on t-test using additive genetic model. GlcCer Glycosphingolipids, PE Phosphatidylethanolamine, SM Sphingomyelin.
The genetic architecture of the Amish is characterized by long runs of homozygosity as a result of founder effects29, so the Amish-enriched associated loci are usually long haplotypes with many variants in strong LD, making it difficult to statistically separate variants to identify the potential causal variant. All results with p < 5E-08 are listed in Supplementary Data 6.
Rare-general population but Amish-enriched loci
The most interesting finding among the five Amish-enriched loci is a rare population missense variant rs536055318 (A263T) (MAF = 0.07 vs 0.001 in the general European population) in an active transcription start site (aTSS) within the promoter region of the glycolipid transfer protein domain containing 2 (GLTPD2) gene on chromosome 17 that was strongly associated with lower level of SM(d40:0) (p = 1.1E-12) and suggestively associated with SM(d36:0, d38:0). To the best of our knowledge, these 3 SMs have never been previously interrogated for genetic association. Another independent African enriched variant (rs73339979) downstream of GLTPD2 was previously associated with lower total and LDL cholesterol30. Also, a Finnish-enriched GLTPD2 intronic variant (rs79202680) was recently associated with lower level of several SMs and reduced atherosclerosis26.
The second interesting Amish-enriched but rare-population finding (MAF = 0.04 vs 0.01) was on a 5 Mb long haplotype on the short arm of chromosome 12 that was significantly and suggestively associated with lower levels of SM(d32:2) and SM(d30:1), respectively. Other independent variants in this region were previously associated with alanine, 1,5-anhydroglucitol (1,5-AG), and creatine, but not with any lipid species. One of the top variants is a splice donor missense variant (rs771033566, Val344Leu, p = 2.2E-14) in the ceramide synthase 5 (CERS5) gene and classified as disease-causing by the Mutation Taster software31. Another common coding variant in this gene was previously associated with increased systolic/diastolic blood pressure and hypertension32,33. The sphingolipid metabolic pathway has been previously linked to blood pressure regulation and response to thiazide diuretics34–36, suggesting that CERS5 may affect blood pressure level through alteration of sphingolipids.
Another Amish-enriched 8 Mb long haplotype (MAF = 0.04 vs 0.01 for the top variant) on the long arm of chromosome 9 was strongly associated with lower levels of all tested glucosylceramide species (GlcCer(d38:1), (d40:1), (d41:1), (d42:1), (d42:2)) except the one with the shortest acyl chain (GlcCer(d34:1)), which reflects the strong phenotypic correlation between the first 5 (r = 0.6–1.0) compared to their much lower correlation with GlcCer(d34:1) (r < 0.2). Other independent variants in this region were previously associated with total cholesterol37, urate, p-acetamidophenylglucuronide, and LPC(28:0)A9. Based on the pattern of the association results (Fig. 4b), we expect the functional variant to be one of the top 27 variants with p-values < 8.5E-16 and r2 > 0.75 with the top variant (Supplementary Data 7). These 27 variants are located within 9 genes (LINC00474, ATP6V1G1, C9orf91, LOC100505478, DFNB31, LOC101928775, DEC1, AKNA, and COL27A1), none of which are obvious candidate genes. Formal fine mapping analysis using PAINTOR38 with different parameters and functional information consistently identified the top associated variant (rs7863920, p = 6.2E-18) to have the highest posterior probability of causality at 0.87. Functional annotation highlighted one intronic variant (rs531892793, p = 3.9E-17) as a strong potentially functional variant (Supplementary Table 1). This variant is highly enriched in the Amish (MAF = 0.04 vs 0.0001) and located in a promoter flanking region in the AT-hook transcription factor (AKNA) gene; it has the top ENCODE DNase score of 1000 indicating very strong evidence of a DNase I hypersensitivity site39, an eigenPC score of 3.5 (top 1%) indicating a strong functional prediction based on conservation and allele frequency40, and is predicted to affect transcriptional factor binding with a 2a RegulomeDB classification41. The variant is located in a weak transcription site in the islet and skeletal muscle, in a genic enhancer region in liver tissue, and in an active enhancer region in adipose tissue42.
We also have two well-established Amish-enriched variants that we previously reported their strong association with traditional lipids, but have never been interrogated for association with lipid species. The first is the missense variant R19X (rs76353203) in the APOC3 gene (MAF = 0.02 vs 0.0008) that we first reported its association with lower TG, higher HDL, and cardioprotection14. In this analysis, we report significant association of this variant with lower levels of 3 phosphatidylethanolamines (PE(36:2), (38:6), (34:2)) and suggestive association with lower level of another PE, one di- and three triglyceride species. The second is the well-established Amish-enriched familial hypercholesterolemia (FH) causing variant R3527Q (rs5742904) in the APOB gene (MAF = 0.06 vs 0.0004) that was previously linked to LDL and TC by our group and others15,43. As expected, this variant was significantly associated with increased levels of several cholesterol esters, sphingolipids and phospholipids while there was no association with acylcarnitine, fatty acids, sterols, and glycerolipids.
Common known loci
We also replicated 7 previously well-known lipid signals including UGT1A/3/10 genes on chromosome 2, ELOVL2 gene on chromosome 6, SLC22A8/A24genes and FADS genes on chromosome 11, LIPC region on chromosome 15, and 2 independent signals in the SPTLC3 region on chromosome 20.
A ~500 kb haplotype at the end of chromosome 2 in a region with a cluster of several uridine diphosphate glucuronosyltransferase (UGT) genes was strongly associated with higher levels of androstenediol. UGT transforms small lipophilic molecules, such as steroids, bilirubin, hormones, and drugs, into water-soluble, excretable metabolites. Our top variant (rs887829) was previously associated with lower LDL37 and higher bilirubin44, however the association with androstenediol is novel.
We also identified a novel strong association for a 300 kb haplotype on chromosome 11 with increased estriol level. The top associated variant (rs184061227, p = 1.0E-15) located in a previously known region encompassing SLC22A8/A24, which are expressed only in kidney. This region was previously associated with etiocholanolone glucuronide (ETIO-G), which is an endogenous, naturally occurring metabolite of testosterone45.
The nearby FADS region on chromosome 11 was the most significant (p = 6.3E-36) and associated with 29 different lipid species including many phosphatidylcholines and cholesterol esters consistent with previous reports9,26.
We also replicated 2 additional known common loci. The first within the fatty acid elongase 2 (ELOVL2) gene on chromosome 6 was associated with PC(42:5) consistent with the previous association of the same variant with DHA_DPAN3 (docosahexaenoic acid, or DHA(22:5)), and (docosapentaenoic acid (DPA)(22:6) omega3)9. The second was the well-known lipid loci lipase C, hepatic type (LIPC) gene region on chromosome 15, associated with several phosphatidylethanolamines (PEs), similar to previous reports9,26.
Finally, we replicated two overlapping but independent signals on chromosome 20 within the serine palmitoyltransferase long chain base subunit 3 (SPTLC3) gene that encodes a subunit of the SPTLC complex which catalyzes the rate-limiting step in sphingolipid biosynthesis. Consistent with previous reports9,26, both signals were associated with several ceramides and sphingomyelins, the first signal is very common (MAF = 0.47) and associated with decreased levels, while the second was less common (MAF = 0.07) and associated with increased levels of lipid species.
Replication/fine mapping in GOLDN
Replicating Amish-enriched rare population loci can be a challenge due to the rarity or absence of variants in outbred populations. However, outbred populations can provide evidence of exclusion even when only a few copies are present as the LD between the causal and non-causal variants that confounds the Amish signal is absent or reduced. If the causal variant is present, it will generally show strong validation with few copies depending on effect size, but non-causal variants will not replicate even if expected replication power is extremely high. The familial hypercholesterolemia causing APOB variant rs5742904_R3527Q15,43 which is enriched in the Amish provides an extreme example. The variant increases LDL by ~50 mg/dl and has a p-value=7.8E-25 in our 639 Amish, and through LD generates genome-wide significant signals at 441 surrounding variants in a 10MB region. Those associations disappear when the Amish LD is accounted for in a conditional analysis with rs5742904 (Supplementary Data 7). Fifty out of the 441 variants were absent in GOLDN, including rs5742904. The remaining 391 variants (MAF: 0.001-0.48) were non-significant in GOLDN, providing confidence they are non-causal. We also performed the same analysis with the APOC3 TG lowering causal variant rs76353203_R19X on chromosome 11, which was also absent in GOLDN, and all R19X LD-driven significant Amish variants were not significant in GOLDN. These two examples support applying this approach to the other 3 Amish-enriched loci that we identified, where the causal variant is unknown and most likely not in GOLDN. Power calculations using the observed Amish effect size (or half to adjust for winner’s curse) can quantify exclusion thresholds for given variants found in outbred samples. The fine-mapping approach provides a reduced set of potential variants for future follow-up.
For common variants, look up in GOLDN provides direct replication. The basic demographic and clinical characteristics of the GOLDN replication cohort are presented in Supplementary Data 1. All GOLDN association results for our top results are listed in Supplementary Data 6. We had two novel trait associations for androstenediol and estriol. These two sterol lipids did not replicate, however, these two variants had p-values of 1.9E-04 and 2.9E-04 with PC(36:4)A, and PC(38:4), respectively in GOLDN. The other five known significant common loci in the Amish had p-values between 7.5E-03 and 1.4E-35 in GOLDN.
Full data for the 5 Amish-enriched loci with the GOLDN results are shown in Supplementary Data 7. The table and the locus zoom plots in Fig. 4 show that each of these 5 loci is a long haplotype ranging from 4 Mb to 10 Mb.
The GLTPD2 locus on chromosome 17 has 13 variants with P < 5.0E-08 (3 significant), 12 of which were not significant in GOLDN, despite all being common (MAF > 0.07) and some with more carriers than Amish (MAC 110-389), while the missense top variant rs536055318 was absent. More importantly this top variant was the only one out of the 13 variants that was suggestively associated with lower level of TG in UKBB (p = 6.9E-08), further supporting our hypothesis that it is the most probable functional variant in this region, pending experimental validation.
The chromosome 12 locus haplotype extends ~5 Mb with 38 significant variants, 15 of which have similar p-values ~E-14 due to the strong LD. The top variant was among 30 variants that did not replicate in GOLDN and hence can be excluded as potential functional/causal variants (in particular 18 variants with MAF > 0.015 and power between 0.79 and 0.99 for significant replication). The splice donor missense variant (rs771033566, p = 2.2E-14, Val344Leu) in the ceramide synthase 5 (CERS5) gene which is our best candidate for causal variant is absent in GOLDN.
The chromosome 9 locus is an 8 Mb long haplotype with 202 significant variants, 27 of which were prioritized based on p-value and LD with the top variant. Only 4 of these 27 variants were present in GOLDN and none was significant including the top variant. Our best candidate causal variant AKNA_rs531892793 based on functional annotation was absent in GOLDN.
Suggestive associations
The GWAS yielded 246 suggestive associations (4.5E-10 < p < 5E-08) within 31 loci, 30 of which were previously reported. Among the top suggestive results, we identified an association between ACT(10.0) (p = 3.5E-08) and common variants in the ACADM gene which encodes the medium-chain specific acyl-Coenzyme A dehydrogenase that plays a role in the fatty acid beta-oxidation pathway and was previously associated with several carnitines (Supplementary Data 6). We also identified an association (p = 1.3E-08) between GlcCer(d40:1) and common variants in the ATPase phospholipid transporting 10D (ATP10D) gene. Another independent signal in ATP10D was previously associated with several glycosphingolipids46. These 2 signals were also replicated in GOLDN (p = 8.4E-07 and p = 2.1E-05, respectively). These results provide added confidence that other signals in our suggestive interval may be true associations but require larger sample size to achieve significance. The only locus that may be considered novel, if replicated, was an association between Cer(d42:2)B and a rare variant (rs79384120, MAF = 0.018, p = 8.3E-09) in the synuclein alpha interacting protein (SNCAIP) gene on chromosome 5, that is linked with Parkinson’s disease47,48, but no known link in this locus to any lipid trait. Ceramides play a role in the physiology and pathophysiology of the central nervous system49, this role may be genetically determined, at least partially, by SNCAIP. This variant did not replicate in GOLDN, indicating that it is either a false positive or the functional variant is another linked variant.
Lookup of previously identified loci in our results
While there are many published GWAS for metabolomics, Tabassum26 is the only published large GWAS that focused on lipidomics and has the most overlap with our study. Thus, we report our results for their top associated variant in Supplementary Data 8. In their Supp Data 2, Tabassum et al.26 reported 3754 lipidomic-variant pair associations with p < 5.0 × 10⁻⁸ comprising 820 variants and 80 lipid species. For 702 variants present in our data, the top associated traits had p-values ranging from 0.051 to 6.3E-36, of which 219 (31%) met the Bonferroni replication significance threshold (0.05/702 = 7.1E-05). We also report our association results for the same trait and variant for 1476 trait-variant pairs, of which 359 (24%) have a p-value less than the Bonferroni replication threshold of 3.3E-05, and 1082 (73%) with p < 0.05. These Bonferroni thresholds are conservative as they do not account for the correlation between lipid species and the LD between variants. This high level of consistency with previously reported loci highlights the quality of our data and confirms the generalizability of findings in a founder population to outbred populations.
Association testing using lipidome compared to traditional lipids
To assess the power of the lipidome to identify genetic signals compared to traditional lipids we tested the association of 226 known lipid associated variants available in Amish with both lipidome and traditional lipids using the same 639 Amish subjects. As previously reported26, the lipidome showed higher power in identifying the association signals compared to traditional lipids where only APOB had stronger association with LDL using the same sample size (Supplementary Fig. 4). Similarly, when we tested the association between 1,602 variants with p < 5.0 E-08 in any lipid species with traditional lipids in the same sample size, we found strong signals only for APOB and APOC3 (Supplementary Data 9) and only APOB had stronger association with LDL.
Discussion
Here we report the GWAS results for 355 lipid species, the largest number tested in a single study to date.
We identified three novel rare-population variants that are enriched in the Amish on chromosomes 9,12 and 17 that have not been previously associated with any lipid species or traditional lipids. Leveraging results from the GOLDN study we were able to finemap large numbers of variants present on long Amish-enriched haplotypes to identify a potentially functional variant in a biologically plausible gene for each of the three loci.
The first is a missense variant in the promoter of the GLTPD2 gene that is mainly expressed in liver and kidney and plays a role in the intermembrane transfer of glycolipids but not neutral or phospholipids50, consistent with its association only with SM(d40:0) in this study. While two independent studies previously pointed to this gene26,30, neither identified variant had an obvious functional mechanism. The position of this rare missense variant rs536055318 (A263T) in an aTSS within the promoter region of GLTPD2 can alter its expression leading to lower levels of SM and reduced atherosclerosis26. Moreover, rs536055318 was recently associated with lower levels of TG in UKBB with a suggestive p-value of 6.9E-08. This finding is consistent with previously observed changes in cellular lipid metabolism as a result of up and down regulating GLT protein51. Several SM species were previously associated with CVD4,52,53. Collectively, these findings suggest GLTPD2 as a potential therapeutic target for CVD protection. Future Mendelian Randomization studies may help to disentangle the direction of causality. This strong association (p = 1.1E-12) with a lower level of SM(d40:0) was identified using only 650 Amish subjects, while it required 461,140 UKBB subjects to find a suggestive association with TG.
The second is a potentially disease-causing splice donor missense variant (rs771033566, Val344Leu) in the CERS5 gene, associated with lower SM(32:2). Another common coding variant in this gene was previously associated with increased systolic/diastolic blood pressure and hypertension32,33. The sphingolipid metabolic pathway was previously linked to blood pressure regulation and response to thiazide diuretics34–36, suggesting that CERS5 may affect blood pressure level and drug response through alteration of sphingolipids, which may have personalized medicine implications. CERS5 is one of the six members of the ceramide synthase gene family which plays a major role in the sphingolipid metabolic salvage pathway2, and while many genetic variants in CERS4 have been previously associated with several SMs2, this is the first association of a SM species with a CERS5 genetic variant.
The third is an intronic variant (rs531892793) that was associated with lower levels of five glucosylceramide species with acyl chains of 38 or more carbons, but not with the species with 34 carbons. This result is consistent with a recent study that found significantly increased serum levels of only glucosylceramide species with acyl chains of 38 or more carbons among CAD cases compared to controls8, but not with 2 shorter carbon species. This variant has very strong regulatory function prediction and is located in the widely expressed AKNA gene that encodes AT-hook transcription factor. This transcription factor is essential for normal development and immune function, as indicated by the gene name that means ‘mother’ in Inuit and Mayan language54. AKNA knock out mice were weak, short lived and suffered from systemic inflamation55. Other common variants in AKNA were previously associated with TC, HDL, ApoA1, ALT, AST, and testosterone30,56–58. Collectively these data support our hypothesis that AKNA_rs531892793 is the best potential functional gene and variant in this locus, however more work is needed to confirm this result as we cannot rule out the possibility that some other variant that may failed genotyping or imputation is the real causal variant driving this association signal.
Two well-known rare-population lipid variants that are Amish-enriched and previously reported by our group are the FH variant APOB_R3527Q and the cardioprotective APOC3_R19X. Given the rarity of these variants in the general population they have never been interrogated for association with lipid species. While this is, to the best of our knowledge, the first report for the associations of these variants with lipidomics as detailed herein, these associations are not unexpected based on the structure and function of associated traditional lipids. The association of the missense rare population variant APOC3_R19X with lower TG, higher HDL, and cardioprotection14 was first reported by us and was later replicated in other studies59–62 and led to the development of APOC3 antisense molecules that are currently in phase III clinical trials for the treatment of hypertriglyceridemia63,64. Similarly, the three novel variants reported here may lead to novel treatment and/or personalized medicine once there is a large enough general population study for replication and functional study to prove causation. Replicating the association of these three novel variants would require larger sample sizes with similar lipid species measured and whole genome sequence data, which currently does not exist but may soon be available through large consortia like TOPMed65.
We also replicated seven previously well-known lipid signals including UGT, ELOVL2, SLC22A8/A24, FADS, LIPC, and two independent signals in the SPTLC3 gene, among these seven, we have two cases of novel trait associations in UGT and SLC22A8/A24. First, in addition to previous associations of UGT_rs887829 with lower LDL37 and higher bilirubin44, we also found an association with higher androstenediol. This pleiotropic effect may explain the inverse association of bilirubin with LDL66 and CVD protection67,68. However, androstenediol taken as a dietary supplement was associated with increased LDL and unfavorable CHD risk in men participating in a high-intensity resistance training program69, pointing to the potential difference between beneficial endogenous effects of a genetic variant that both decreases LDL and increases androstenediol compared to the potential deleterious opposite exogenous effects of androstenediol as a dietary supplement. Second, we found the SLC22A8/A24 locus that was previously associated with ETIO-G to be associated with higher estriol. Estriol is a weaker form of estrogen, and interestingly, in UKBB, this region was associated with cholecystitis without cholelithiasis (inflamed gallbladder without gallstones). This association may be the underlying inflammatory first step in the process that leads to two-fold increase gallstone formation in women of reproductive age or on birth control medication that have estrogen compared to males70, and maybe informative in personalized medicine. This association is independent of the nearby FADS gene region that has been associated with gallstones71 and assumed to work through its effect on lipids. However, given the lack of replication in GOLDN, further investigation is warranted.
The phenotype and genotype correlation pattern as well as the heritability estimates in our study were generally in line with other general population studies. This study also replicated many of previously identified common variants which highlight the generalizability of the Amish results to the general population, besides its added value in identifying rare population variants enriched by drift. While traditional lipids explained a small proportion of the variance of the lipidome, and the lipidome explained a significant proportion of the genetic variance in traditional lipids, the overlap was incomplete leaving a significant proportion in both sides remained to be explained. This limited overlap highlights the difference in the genetic architecture and the complimentary value in using both traditional lipids and lipidome in understanding lipid genetic architecture.
While this study may be limited by a relatively small sample size, we were still able to identify three novel rare-population variants. Larger sample size in Amish and other founder population will undoubtedly identify more rare variants which would be challenging to identify in the general population and can inform biological mechanisms and therapeutic targets relevant to all humans. While this GWAS included 355 lipid species, the largest to date, we excluded lipid species with low quality data, so more complete profiling is warranted for comprehensive interrogation.
Methods
Study populations
The Old Order Amish (OOA) population of Lancaster County, PA immigrated to the Colonies from Central Europe in the early 1700’s. There are currently around 40,000 OOA individuals in the Lancaster area, nearly all of whom can trace their ancestry back about 15 generations to approximately 750 founders. Investigators at the University of Maryland Baltimore have been studying the genetic determinants of cardiometabolic health in this population since 1993. To date, over 7000 Amish adults have participated in one or more of our studies as part of the Amish Complex Disease Research Program72. The samples used in this study were participants of Heredity and Phenotype Intervention (HAPI) Heart Study73. Briefly, HAPI was initiated in 2002 to identify the genetic and environmental determinants of responses (blood pressure, triglyceride excursion and platelet aggregation) to four short-term interventions including a cold pressor stress test, a high salt diet, a high fat challenge, and an aspirin therapy in a four-week time period. HAPI recruited 1003 OOA, and the interventions were carried out in 868 relatively healthy OOA adults (>=20 years of age). Participants were asked to discontinue the use of all medications, vitamins and supplements for at least 7 days prior to the first visit and during the interventions, to fast at least 12 h prior to their visit, and to restrain themselves from doing excessive physical activity on the morning of their appointment. Baseline blood drawn from 650 participants was used for the lipidomic profiling in this study. The study protocol was approved by the institutional review board at the University of Maryland. Informed consent was obtained from each of the study participants.
GOLDN (Genetics of Lipid Lowering Drugs and Diet Network), the largest study of postprandial dyslipidemia that offers NMR, clinical lipid, and lipidomic measures, was initiated to assess the interaction of genetic factors with environmental interventions (intake of a high-fat meal and/or fenofibrate treatment)74. Briefly, the study recruited European American families with at least two siblings from two field centers (Minneapolis, MN and Salt Lake City, UT) of the Family Heart Study (FHS). Participants were excluded if they (1) had fasting triglycerides (TGs) ≥ 1500 mg/dL, (2) had a history of kidney, liver, pancreas, or gallbladder disease, recent myocardial infarction or revascularization, or nutrient malabsorption, (3) reported a current use of insulin, and (4) were pregnant or lactating. Of the 1327 participants who were initially screened, 1048 (including 546 women) met the eligibility criteria and were included in the study. A written consent form was provided for each participant and the protocol of the study was reviewed and approved by the institutional review boards at the University of Utah, University of Minnesota, and Tufts University/New England Medical Center.
Lipidomic profiling
The technical details of the laboratory protocols and methods of the lipodomics experiments are described in our previous paper24 and reproduced here for completeness.
Baseline HAPI and GOLDN lipidomics data includes neutral lipids and phospholipids that were collected using UPLC–QTOFMS at the West Coast Metabolomics Center at University of California Davis. The protocol for this measurement was described in detail elsewhere75,76. Briefly, the whole process was divided into three steps: lipid extraction and separation, data acquisition and lipid identification. Methyl tert-butyl ether (MTBE), methanol, and water were used to extract plasma lipids. The quality control (QC) samples were method blanks and pooled human plasma (BioreclamationIVT). The separated non-polar phase was injected into a Waters Acquity UPLC CSH C18 (100 mm length × 2.1 mm id; 1.7 μm particle size) with an additional Waters Acquity VanGuard CSH C18 pre-column (5 mm × 2.1 mm id; 1.7 μm particle size) maintained at 65 °C was coupled to an Agilent 1290 Infinity UHPLC (Agilent Technologies) for ESI positive and negative modes. Mobile phase modifiers included ammonium formate and formic acid for positive mode and ammonium acetate (Sigma–Aldrich) for negative mode. The same mobile phase composition of (A) 60:40 v/v acetonitrile:water (LC-MS grade) and (B) 90:10 v/v isopropanol:acetonitrile was used for both positive and negative modes. An Agilent 6550 QTOF with a jet stream electrospray source was employed for acquiring full scan data in the mass range m/z 65–1700 in positive and negative modes with scan rate of 2 spectra/second. Instrument parameters were as follows for the ESI ( + ) mode – gas temperature 325 °C, gas flow 8 l/min, nebulizer 35 psig, sheath gas temperature 350 °C, sheath gas flow 11, capillary voltage 3500 V, nozzle voltage 1000 V, fragmentor voltage 120 V and skimmer 65 V. In negative ion mode, gas temperature 200 °C, gas flow 14 l/min, fragmentor 175 V, with the other parameters identical to positive ion mode. Data are collected in centroid mode at a rate of 2 scans per second. Injection volume was 1.7 μL for the positive mode and 5 μL for the negative mode. The gradient started at 15% B, ramped to 30% at 2 min, 48% at 2.5 min, 82% at 11 min, 99% at 11.5 min and kept at 99% B until 12 min before ramping down to 15% B at 12.1 min which was kept isocratic until 15 min to equilibrate the column. The total run time was 15 min and the flow rate was 0.6 ml/min. Data were acquired in nine batches and every ten samples, one quality control sample was analyzed. MS1 data were acquired for all samples, and MS/MS data were acquired for a set of pooled samples. Data were processed with the Agilent Quant 7.0 software. Lipids levels were reported as chromatographic peak heights. Stringent quality control was performed for the lipidomics data using eight previously reported measures77. We observed very low missing data rate of approximately 0.5% for known profiled lipids in positive ionization mode. The missing data rate was higher for certain molecular weight of the lipid compound and retention behavior. For example for a few low intensity compounds such as high molecular weight triacylglycerols (TG (62:4) or TG (60:6)) the missing data rate was up to 20%. Missing value imputation was performed using our previously developed computational routine78 before SERRF normalization78. After normalization, the relative standard deviation of quality control samples is 4.7% and 3.4% for negative and positive mode respectively. Lipid identification was performed by converting the acquired MS/MS spectra to the mascot generic format (MGF) and then a library search using the in-silico MS/MS library LipidBlast. After quality control, 355 lipid compounds were included in the HAPI lipidomic GWAS and 328 in the GOLDN replication study.
HAPI chip genotyping and imputation
Genomic DNA was extracted from whole blood from 1856 individuals of the OOA and quantitated using PicoGreen. Genome-wide genotyping was performed with Affymetrix 500 K (n = 1252, including all HAPI participants) and Affymetrix 6.0 (n = 604) arrays at the University of Maryland Biopolymer Core Facility. The BRLMM algorithm was used for genotype calling. Prior to imputation, the two chips were merged into a single file. Samples with call rate <0.93, high level of Mendelian error, or gender mismatch were excluded. Variants with >2% missing data, Hardy-Weinberg expectation (HWE) p-value < 1E-10, Mendelian errors >1% or with MAF < 0.01 (N = 366,169) were excluded. We also excluded variants on the Y chromosome and mitochondrial genome, palindromic variants with frequency >0.4, and variants that were not in the TOPMed Freeze 5b reference panel. These QC procedures left 1,833 participants and 307,238 variants in the genotype file for imputation. The genotype data were uploaded to the Michigan Imputation Server79 where the pre-phasing was performed using Eagle v2.480, and then imputation to the TOPMed Freeze 5b reference panel was performed using Minimac448. Following imputation, we excluded variants with imputation quality/INFO < 0.9, MAF < 0.01 or deviation from HWE at p < 1.0E-09. These processes left 7,917,357 variants for the association analysis with 639 samples with both phenotypes and genotypes.
Whole-genome sequencing for GOLDN
Whole-genome sequencing (WGS) for the Trans-Omics in Precision Medicine (TOPMed) program was supported by the National Heart, Lung and Blood Institute (NHLBI). WGS for “NHLBI TOPMed: Genetics of Lipid Lowering Drugs and Diet Network” (phs001359) was performed at the North West Genomics Center, University of Washington. Centralized read mapping and genotype calling, along with variant quality metrics and filtering were provided by the TOPMed Informatics Research Center. Data management, sample-identity QC, and general study coordination were provided by the TOPMed Data Coordinating Center. Library preparation and whole-genome sequencing were performed on 967 GOLDN samples by North West Genomics Center, University of Washington. The NHLBI Informatics Resource Core at the University of Michigan performed alignment, base calling, and sequence quality scoring and variant calling of all TOPMed samples using the GotCloud pipeline81. Variant calling used a support vector machine (SVM) trained using known variants. Variants passing all quality filters with read depth at least 10 were delivered in BCF format and used for association analysis. Further variant QC included removing all sites in low-complexity regions82, and on the X chromosome. There were 835 GOLDN samples with both lipidome and WGS data and used for the GWAS.
Phenotype preparation
In HAPI, to adjust for potential technical artifacts and non-normality of raw lipidomic values, each lipidomic was first regressed in a linear model adjusting for age, age squared, sex, and experimental technical artifacts including batch, box, row, position and plate, then the regression residuals were inverse normalized. No adjustment for medication was included as none of the HAPI subjects were on lipid lowering medication. These transformed lipidomic values were used in all Amish analyses. The identical procedure was applied to lipid phenotypes, excluding technical artifacts from the linear regression, to standardize analyses combining both lipid and lipidome.
In GOLDN the exact same lipid panel was completed and an inverse rank normal transformation was used on each lipid class phenotypes.
Variance decomposition
Mixed model variance component analysis was used to partition observed phenotypic variance σ2p into causal components σ2k and residual error σ2e, that is,
| 1 |
The variance components σ2k correspond to random effects bk assumed to follow multivariate Gaussian distribution bk ~N(0, σ2k Σk), with mean zero, covariance matrix Σk. The matrix Σk contains pairwise covariance values between subjects and the variance components σ2k are estimated using mixed model maximum likelihood methods incorporating corresponding covariance matrices. For interpretability the estimated variances σ2k are converted to the proportion of phenotypic variance explained, called λk, by dividing by the phenotypic variance σ2p, that is, λk = σ2k/σ2p. Likelihood ratio test (LRT) p-values can be used to compare nested models of different random effects to determine if the model with more components provides significantly better fit of the data. The LRT is applied using standard sequential procedures to build the most parsimonious causal component decomposition of the phenotypic variance using a predefined p-value threshold of 0.05. At each step LRT p-values are computed comparing the current best model with that model plus one of the remaining random effects. The current model is then updated with the remaining random effect with the smallest p-value. The procedure is repeated until no LRT p-value is less than 0.05.
Additive and dominant heritability
The pedigree kinship coefficient measures the expected probability that two subjects share an allele identical by descent given the pedigree structure. An Amish kinship covariance matrix was constructed using a single 14-generation pedigree that connects all 650 subjects back to their 18th century founders. The Amish population structure provides unique opportunities to separate genetic and environmental effects important in lipidome as many distant relative pairs, such as cousins, share genes from the same founder but not common environments such as diet and lifestyle. A dominance covariance matrix was also constructed using the pedigree structure that measures the probability that two subjects share a genotype identical by descent.
Data-derived covariance matrices
In multivariate statistics the sample covariance matrix can be constructed using any set of variables measured across subjects. First consider the design or data matrix X that contains measured variables such as lipidome on subjects that is used in regression to estimate the effect of the variables as fixed effects. To construct the covariance matrix the variables in X are first mean centered and normalized to remove potential scale differences between them. Then the subject-by-subject sample covariance matrix S is defined as S = XX’, where X’ is the transpose of X. We describe details of how covariance matrices were constructed using genetic markers, lipidomics and lipids.
Lipidome variance explained by known lipid variants
To measure the proportion of lipidomic and traditional lipid variance due to genetic markers associated with HDL, LDL, TC and TG lipid levels, genetic relatedness matrices (GRM) were constructed using SNPs identified from the literature30,37,83–86 as being genome-wide significant for each lipid plus known Amish-specific variants (APOB_rs574290415, APOC3_rs7635320314, B4GALT1_rs55156468321, TIMD4_rs89895600320) (4 variants). The number of literature SNPs that were present in the Amish genotype data and used were 99 for HDL, 77 for LDL, 97 for TC, and 67 for TG. This analysis was restricted to 194 lipid species with baseline significant heritability (Kinship + 4 V heritability p-value < 0.01). We chose to use (Kinship + 4 V) as the base model in this analysis to focus on the effect of common known lipid variants rather than the strong effect of these 4 Amish-enriched rare-population variants, however, we included APOB, B4GALT1 and TIMD4 variants in the LDL and TC GRMs and the APOC3 variant in the TG and HDL GRMs to account for any confounding/residual effect of these variants with other common variants, if any. SNP genotyping was available on the 639 subjects with lipidomics. To estimate the genetic contribution of GWAS SNPs associated with lipidomic and traditional lipids as phenotypes a mixed model analysis was performed including kinship and lipid SNP GRM as random effects.
Genetic and phenotypic correlation
The software biMM87 was used to calculate additive genetic correlations between 359 variables (355 lipidomics and 4 traditional lipids (HDL, LDL, TC, TG)) on data from 639 subjects using the Amish kinship matrix. biMM returns bivariate mixed model maximum likelihood estimates of genetic and environmental correlation that includes estimates of heritability of each trait genetic correlation between them allowing for residual errors between traits. biMM does not constrain genetic correlation estimates to be in the range [−1,1], thus out-of-range correlations, which were common when one or both traits have low heritability, were set to missing as estimates were not deemed reliable. There were 7428 with values < −1.0 and 9020 with values > 1.0. Out-of-range estimates are represented by white squares in the heatmap, and only 64,621 correlation are included in Supplementary Data 3. R88 was used to calculate the pairwise phenotypic Pearson correlations for lipid species and traditional lipids.
Traditional lipid variance explained by lipidome classes
Covariance matrices were constructed for each of the 13 lipid classes (ACT, CE, Cer, DAG, FA, GlcCer, LPC, LPE, PC, PE, PI, SM, TAG) using mean centered and normalized raw lipidomic values from each class in the data matrix X. These covariance matrices were used in a mixed model with traditional lipid (HDL, LDL, TG and TC) as the trait and kinship and lipidomic class as random effects. We estimated the marginal contribution of each lipid class separately and also performed a sequential analysis as described above to determine the best multi-class model fit for each lipid which estimates the joint proportion of traditional lipid variance accounted for by the lipidomic class.
Association analyses
In HAPI, genetic association analysis of inverse normalized lipid species was performed using linear mixed models to account for familial correlation using the genetic relationship matrix (GRM) as implemented in the Mixed Model Analysis for Pedigree and population (MMAP)89. For 180 lipid species that showed nominal association (p < 1.0E-03) with any of the 4 Amish enriched lipid variants (APOB_rs5742904, APOC3_rs76353203, B4GALT1_rs551564683, TIMD4_rs898956003), we reran the association analyses adjusting for the variant(s) as detailed in Supplementary Data 2. The effect size for all traits is reported in standard deviation units for comparability. Multiple testing adjusted significance threshold of 4.5E-10 was determined by dividing the standard GWAS level of 5E-08 by the number of principle components (110) that explained >95% of the variance in the 355 metabolomic variables. All associations between 5E-08 and 4.5E-10 were considered suggestive. The number of independent signals at each locus was determined using sequential conditional analysis. The novel loci were determined by conditioning on preidentified variants within 1 Mb from the top associated variant.
In GOLDN we performed a parallel linear mixed model analysis on the inverse normally transformed lipid phenotypes in Saige-0.29 pipeline deployed in Encore analytics framework (i.e. Fast linear mixed model with kinship adjustment (saige-qt)). Pre-derived top 10 PCs from TOPMed WGS cohort was adjusted as covariates along with age, sex and center.
Bonferroni corrected p-value of 1.3E-05 was used for GOLDN replication accounting for 3631 trait-variant pairs of GOLDN association results included in Supplementary Data 6
Annotation and biobank lookups
Look ups of top results in publicly available PheWAS databases including UK Biobank90–93, FinnGen94 and BioBank Japan95 was performed using the “Omics Analysis, Search and Information System” (OASIS)96, a web-based application for mining and visualizing GWAS results via integration with a broad spectrum of available databases for functional annotation such as dbSNP97, gnomAD98, GTEx99, Open Targets Genetics100, eigenPC40, RegulomeDB41, The ensembl regulatory build101 chromatin state in four different tissue42, and the UCSC Genome Browser102 to visualize their proximity to functional regions (e.g. binding sites, Dnase hypersensitivity sites, enhancer/promoter regions).
Reporting summary
Further information on research design is available in the Nature Research Reporting Summary linked to this article.
Supplementary information
Description of Additional Supplementary Files
Acknowledgements
We gratefully thank the Amish community, the Amish Research Clinic staff and liaisons, and the participants of the GOLDN study. We also thank Simeon I. Taylor for insightful suggestions, comments and discussions. The HAPI Heart study was supported by U01HL072515. The analysis methods and software were supported by U01HL084756 and U01HL137181. The GOLDN study was supported by the NHLBI grant U01HL072524–04 and R01HL091357.
Author contributions
Conceived, designed and supervised the work: M.E.M., J.R.O., M.R.I., D.K.A., H.K.T. Results interpretation: M.E.M., J.R.O., A.L.B., M.R.I., D.K.A., S.A. Manuscript preparation: M.E.M., J.R.O. Provided samples, genotype and phenotype data: A.R.S. Data analyses; M.E.M., J.R.O., S.A., V.S., J.P., K.A.R., M.B., A.P. Performed lipidomic profiling and processed the raw data; T.K., D.K.B., S.F. All authors read, revised and approved the paper.
Peer review
Peer review information
Communications Biology thanks Rubina Tabassum and the other, anonymous, reviewer(s) for their contribution to the peer review of this work. Primary Handling Editors: Hélène Choquet and George Inglis. Peer reviewer reports are available.
Data availability
Amish phenotype, genotype, and lipidome data are available to academic investigator via a Data Use Agreement with UMB. GOLDN phenotype, genotype, and lipidome data are available to academic investigator via a Data Use Agreement with UAB. Please contact the corresponding author to initiate the data request. Source data underlying Figs. 1b and 2 are presented in Supplementary Data 2. Summary statistics are available through the GWAS Catalog (https://www.ebi.ac.uk/gwas/home) under accession GCP000299.
Competing interests
MEM reports funding from Regeneron Pharmaceutical unrelated to this work. SA reports employment and equity in 23andMe, Inc. ARS is a current employee of Regeneron Pharmaceuticals Inc. and also a part-time faculty member at the University of Maryland School of Medicine. No competing interests for all other authors.
Footnotes
Publisher’s note Springer Nature remains neutral with regard to jurisdictional claims in published maps and institutional affiliations.
Supplementary information
The online version contains supplementary material available at 10.1038/s42003-022-03291-2.
References
- 1.World Health Organization https://www.who.int/news-room/fact-sheets/detail/cardiovascular-diseases-(cvds).
- 2.Tabassum, R. & Ripatti, S. Integrating lipidomics and genomics: emerging tools to understand cardiovascular diseases. Cell Mol. Life Sci.78, 2565–2584 (2021). [DOI] [PMC free article] [PubMed]
- 3.Bismuth J, et al. Ceramide: A common pathway for atherosclerosis? Atherosclerosis. 2008;196:497–504. doi: 10.1016/j.atherosclerosis.2007.09.018. [DOI] [PMC free article] [PubMed] [Google Scholar]
- 4.Sigruener A, et al. Glycerophospholipid and sphingolipid species and mortality: the Ludwigshafen Risk and Cardiovascular Health (LURIC) study. PLoS One. 2014;9:e85724. doi: 10.1371/journal.pone.0085724. [DOI] [PMC free article] [PubMed] [Google Scholar]
- 5.Würtz P, et al. Metabolite profiling and cardiovascular event risk: A prospective study of 3 population-based cohorts. Circulation. 2015;131:774–785.. doi: 10.1161/CIRCULATIONAHA.114.013116. [DOI] [PMC free article] [PubMed] [Google Scholar]
- 6.Alshehry ZH, et al. Plasma lipidomic profiles improve on traditional risk factors for the prediction of cardiovascular events in Type 2 diabetes mellitus. Circulation. 2016;134:1637–1650. doi: 10.1161/CIRCULATIONAHA.116.023233. [DOI] [PubMed] [Google Scholar]
- 7.Razquin C, et al. Plasma lipidome patterns associated with cardiovascular risk in the PREDIMED trial: A case-cohort study. Int J. Cardiol. 2018;253:126–132. doi: 10.1016/j.ijcard.2017.10.026. [DOI] [PMC free article] [PubMed] [Google Scholar]
- 8.Poss AM, et al. Machine learning reveals serum sphingolipids as cholesterol-independent biomarkers of coronary artery disease. J. Clin. Invest. 2020;130:1363–1376. doi: 10.1172/JCI131838. [DOI] [PMC free article] [PubMed] [Google Scholar]
- 9.Hagenbeek FA, et al. Heritability estimates for 361 blood metabolites across 40 genome-wide association studies. Nat. Commun. 2020;11:39. doi: 10.1038/s41467-019-13770-6. [DOI] [PMC free article] [PubMed] [Google Scholar]
- 10.Helgadottir A, et al. Variants with large effects on blood lipids and the role of cholesterol and triglycerides in coronary disease. Nat. Genet. 2016;48:634–639. doi: 10.1038/ng.3561. [DOI] [PMC free article] [PubMed] [Google Scholar]
- 11.Sidore C, et al. Genome sequencing elucidates Sardinian genetic architecture and augments association analyses for lipid and blood inflammatory markers. Nat. Genet. 2015;47:1272–1281. doi: 10.1038/ng.3368. [DOI] [PMC free article] [PubMed] [Google Scholar]
- 12.Moltke I, et al. A common Greenlandic TBC1D4 variant confers muscle insulin resistance and type 2 diabetes. Nature. 2014;512:190–193. doi: 10.1038/nature13425. [DOI] [PubMed] [Google Scholar]
- 13.Minster RL, et al. A thrifty variant in CREBRF strongly influences body mass index in Samoans. Nat. Genet. 2016;48:1049–1054. doi: 10.1038/ng.3620. [DOI] [PMC free article] [PubMed] [Google Scholar]
- 14.Pollin TI, et al. A null mutation in human APOC3 confers a favorable plasma lipid profile and apparent cardioprotection. Science (N.Y.) 2008;322:1702–1705. doi: 10.1126/science.1161524. [DOI] [PMC free article] [PubMed] [Google Scholar]
- 15.Shen H, et al. Familial defective apolipoprotein B-100 and increased low-density lipoprotein cholesterol and coronary artery calcification in the old order amish. Arch. Intern. Med. 2010;170:1850–1855. doi: 10.1001/archinternmed.2010.384. [DOI] [PMC free article] [PubMed] [Google Scholar]
- 16.Horenstein RB, et al. The ABCG8 G574R variant, serum plant sterol levels, and cardiovascular disease risk in the Old Order Amish. Arteriosclerosis, Thrombosis, Vasc. Biol. 2013;33:413–419. doi: 10.1161/ATVBAHA.112.245480. [DOI] [PMC free article] [PubMed] [Google Scholar]
- 17.Daley E, et al. Variable bone fragility associated with an Amish COL1A2 variant and a knock-in mouse model. J. Bone Miner. Res.: Off. J. Am. Soc. Bone Miner. Res. 2010;25:247–261. doi: 10.1359/jbmr.090720. [DOI] [PMC free article] [PubMed] [Google Scholar]
- 18.Albert JS, et al. Null mutation in hormone-sensitive lipase gene and risk of type 2 diabetes. N. Engl. J. Med. 2014;370:2307–2315. doi: 10.1056/NEJMoa1315496. [DOI] [PMC free article] [PubMed] [Google Scholar]
- 19.Welty FK, et al. Identification and molecular analysis of two apoB gene mutations causing low plasma cholesterol levels. Circulation. 1995;92:2036–2040. doi: 10.1161/01.cir.92.8.2036. [DOI] [PubMed] [Google Scholar]
- 20.Montasser ME, et al. An APOO Pseudogene on Chromosome 5q Is Associated With Low-Density Lipoprotein Cholesterol Levels. Circulation. 2018;138:1343–1355. doi: 10.1161/CIRCULATIONAHA.118.034016. [DOI] [PMC free article] [PubMed] [Google Scholar]
- 21.Montasser ME, et al. Genetic and functional evidence links a missense variant in. Science. 2021;374:1221–1227. doi: 10.1126/science.abe0348. [DOI] [PubMed] [Google Scholar]
- 22.Liu Y, et al. The SCARB1 gene is associated with lipid response to dietary and pharmacological interventions. J. Hum. Genet. 2008;53:709–717. doi: 10.1007/s10038-008-0302-2. [DOI] [PMC free article] [PubMed] [Google Scholar]
- 23.Tsai MY, et al. Comparison of ultracentrifugation and nuclear magnetic resonance spectroscopy in the quantification of triglyceride-rich lipoproteins after an oral fat load. Clin. Chem. 2004;50:1201–4. doi: 10.1373/clinchem.2004.032938. [DOI] [PubMed] [Google Scholar]
- 24.Bagheri M, et al. A lipidome-wide association study of the lipoprotein insulin resistance index. Lipids Health Dis. 2020;19:153. doi: 10.1186/s12944-020-01321-8. [DOI] [PMC free article] [PubMed] [Google Scholar]
- 25.Slade E, et al. Age and sex are associated with the plasma lipidome: findings from the GOLDN study. Lipids Health Dis. 2021;20:30. doi: 10.1186/s12944-021-01456-2. [DOI] [PMC free article] [PubMed] [Google Scholar]
- 26.Tabassum R, et al. Genetic architecture of human plasma lipidome and its link to cardiovascular disease. Nat. Commun. 2019;10:4329. doi: 10.1038/s41467-019-11954-8. [DOI] [PMC free article] [PubMed] [Google Scholar]
- 27.Frahnow T, et al. Heritability and responses to high fat diet of plasma lipidomics in a twin study. Sci. Rep. 2017;7:3750. doi: 10.1038/s41598-017-03965-6. [DOI] [PMC free article] [PubMed] [Google Scholar]
- 28.Bellis C, et al. Human plasma lipidome is pleiotropically associated with cardiovascular risk factors and death. Circ. Cardiovasc. Genet. 2014;7:854–863. doi: 10.1161/CIRCGENETICS.114.000600. [DOI] [PMC free article] [PubMed] [Google Scholar]
- 29.Joshi PK, et al. Directional dominance on stature and cognition in diverse human populations. Nature. 2015;523:459–462. doi: 10.1038/nature14618. [DOI] [PMC free article] [PubMed] [Google Scholar]
- 30.Klarin D, et al. Genetics of blood lipids among ~300,000 multi-ethnic participants of the Million Veteran Program. Nat. Genet. 2018;50:1514–1523. doi: 10.1038/s41588-018-0222-9. [DOI] [PMC free article] [PubMed] [Google Scholar]
- 31.Schwarz JM, et al. MutationTaster2: mutation prediction for the deep-sequencing age. Nat. Methods. 2014;11:361–362. doi: 10.1038/nmeth.2890. [DOI] [PubMed] [Google Scholar]
- 32.Liu C, et al. Meta-analysis identifies common and rare variants influencing blood pressure and overlapping with metabolic trait loci. Nat. Genet. 2016;48:1162–1170. doi: 10.1038/ng.3660. [DOI] [PMC free article] [PubMed] [Google Scholar]
- 33.Surendran P, et al. Trans-ancestry meta-analyses identify rare and common variants associated with blood pressure and hypertension. Nat. Genet. 2016;48:1151–1161. doi: 10.1038/ng.3654. [DOI] [PMC free article] [PubMed] [Google Scholar]
- 34.Fenger M, Linneberg A, Jeppesen J. Network-based analysis of the sphingolipid metabolism in hypertension. Front. Genet. 2015;6:84. doi: 10.3389/fgene.2015.00084. [DOI] [PMC free article] [PubMed] [Google Scholar]
- 35.Spijkers LJ, et al. Hypertension is associated with marked alterations in sphingolipid biology: A potential role for ceramide. PLoS One. 2011;6:e21817. doi: 10.1371/journal.pone.0021817. [DOI] [PMC free article] [PubMed] [Google Scholar]
- 36.Shahin, M. H. et al. Sphingolipid metabolic pathway impacts thiazide diuretics blood pressure response: Insights from genomics, metabolomics, and lipidomics. J. Am. Heart Assoc. 7 (2017). [DOI] [PMC free article] [PubMed]
- 37.Liu DJ, et al. Exome-wide association study of plasma lipids in >300,000 individuals. Nat. Genet. 2017;49:1758–1766. doi: 10.1038/ng.3977. [DOI] [PMC free article] [PubMed] [Google Scholar]
- 38.Kichaev G, et al. Integrating functional data to prioritize causal variants in statistical fine-mapping studies. PLoS Genet. 2014;10:e1004722. doi: 10.1371/journal.pgen.1004722. [DOI] [PMC free article] [PubMed] [Google Scholar]
- 39.Snyder MP, et al. Perspectives on ENCODE. Nature. 2020;583:693–698. doi: 10.1038/s41586-020-2449-8. [DOI] [PMC free article] [PubMed] [Google Scholar]
- 40.Ionita-Laza I, et al. A spectral approach integrating functional genomic annotations for coding and noncoding variants. Nat. Genet. 2016;48:214–220. doi: 10.1038/ng.3477. [DOI] [PMC free article] [PubMed] [Google Scholar]
- 41.Boyle AP, et al. Annotation of functional variation in personal genomes using RegulomeDB. Genome Res. 2012;22:1790–1797. doi: 10.1101/gr.137323.112. [DOI] [PMC free article] [PubMed] [Google Scholar]
- 42.Varshney A, et al. Genetic regulatory signatures underlying islet gene expression and type 2 diabetes. Proc. Natl. Acad. Sci. USA. 2017;114:2301–2306. doi: 10.1073/pnas.1621192114. [DOI] [PMC free article] [PubMed] [Google Scholar]
- 43.Peloso GM, et al. Association of low-frequency and rare coding-sequence variants with blood lipids and coronary heart disease in 56,000 whites and blacks. Am. J. Hum. Genet. 2014;94:223–232. doi: 10.1016/j.ajhg.2014.01.009. [DOI] [PMC free article] [PubMed] [Google Scholar]
- 44.Shin SY, et al. An atlas of genetic influences on human blood metabolites. Nat. Genet. 2014;46:543–550. doi: 10.1038/ng.2982. [DOI] [PMC free article] [PubMed] [Google Scholar]
- 45.The Human Metabolome Database, http://www.hmdb.ca/metabolites.
- 46.Hicks AA, et al. Genetic determinants of circulating sphingolipid concentrations in European populations. PLoS Genet. 2009;5:e1000672. doi: 10.1371/journal.pgen.1000672. [DOI] [PMC free article] [PubMed] [Google Scholar]
- 47.Shishido T, et al. Synphilin-1 has neuroprotective effects on MPP. Neurosci. Lett. 2019;690:145–150. doi: 10.1016/j.neulet.2018.10.020. [DOI] [PubMed] [Google Scholar]
- 48.Chung KK, et al. Parkin ubiquitinates the alpha-synuclein-interacting protein, synphilin-1: Implications for Lewy-body formation in Parkinson disease. Nat. Med. 2001;7:1144–50. doi: 10.1038/nm1001-1144. [DOI] [PubMed] [Google Scholar]
- 49.Jana A, Hogan EL, Pahan K. Ceramide and neurodegeneration: Susceptibility of neurons and oligodendrocytes to cell damage and death. J. Neurol. Sci. 2009;278:5–15. doi: 10.1016/j.jns.2008.12.010. [DOI] [PMC free article] [PubMed] [Google Scholar]
- 50.Malinina L, et al. Sphingolipid transfer proteins defined by the GLTP-fold. Q Rev. Biophys. 2015;48:281–322. doi: 10.1017/S003358351400016X. [DOI] [PMC free article] [PubMed] [Google Scholar]
- 51.Kjellberg MA, et al. Alternation in the glycolipid transfer protein expression causes changes in the cellular lipidome. PLoS One. 2014;9:e97263. doi: 10.1371/journal.pone.0097263. [DOI] [PMC free article] [PubMed] [Google Scholar]
- 52.Yang L, et al. Serum lipids profiling perturbances in patients with ischemic heart disease and ischemic cardiomyopathy. Lipids Health Dis. 2020;19:89. doi: 10.1186/s12944-020-01269-9. [DOI] [PMC free article] [PubMed] [Google Scholar]
- 53.Lemaitre RN, et al. Plasma ceramides and sphingomyelins in relation to heart failure risk. Circ. Heart Fail. 2019;12:e005708. doi: 10.1161/CIRCHEARTFAILURE.118.005708. [DOI] [PMC free article] [PubMed] [Google Scholar]
- 54.Moliterno AR, Resar LM. AKNA: another AT-hook transcription factor “hooking-up” with inflammation. Cell Res. 2011;21:1528–30. doi: 10.1038/cr.2011.96. [DOI] [PMC free article] [PubMed] [Google Scholar]
- 55.Ma W, et al. Coordinate activation of inflammatory gene networks, alveolar destruction and neonatal death in AKNA deficient mice. Cell Res. 2011;21:1564–77. doi: 10.1038/cr.2011.84. [DOI] [PMC free article] [PubMed] [Google Scholar]
- 56.Richardson TG, et al. Evaluating the relationship between circulating lipoprotein lipids and apolipoproteins with risk of coronary heart disease: A multivariable Mendelian randomisation analysis. PLoS Med. 2020;17:e1003062. doi: 10.1371/journal.pmed.1003062. [DOI] [PMC free article] [PubMed] [Google Scholar]
- 57.Ruth KS, et al. Using human genetics to understand the disease impacts of testosterone in men and women. Nat. Med. 2020;26:252–258. doi: 10.1038/s41591-020-0751-5. [DOI] [PMC free article] [PubMed] [Google Scholar]
- 58.Kanai M, et al. Genetic analysis of quantitative traits in the Japanese population links cell types to complex human diseases. Nat. Genet. 2018;50:390–400. doi: 10.1038/s41588-018-0047-6. [DOI] [PubMed] [Google Scholar]
- 59.Tachmazidou I, et al. A rare functional cardioprotective APOC3 variant has risen in frequency in distinct population isolates. Nat. Commun. 2013;4:2872. doi: 10.1038/ncomms3872. [DOI] [PMC free article] [PubMed] [Google Scholar]
- 60.Tg, et al. Loss-of-function mutations in APOC3, triglycerides, and coronary disease. N. Engl. J. Med. 2014;371:22–31. doi: 10.1056/NEJMoa1307095. [DOI] [PMC free article] [PubMed] [Google Scholar]
- 61.Saleheen D, et al. Human knockouts and phenotypic analysis in a cohort with a high rate of consanguinity. Nature. 2017;544:235–239. doi: 10.1038/nature22034. [DOI] [PMC free article] [PubMed] [Google Scholar]
- 62.Wulff AB, Nordestgaard BG, Tybjærg-Hansen A. Loss-of-Function Mutations, Remnant Cholesterol, Low-Density Lipoprotein Cholesterol, and Cardiovascular Risk: Mediation- and Meta-Analyses of 137 895 Individuals. Arterioscler Thromb. Vasc. Biol. 2018;38:660–668. doi: 10.1161/ATVBAHA.117.310473. [DOI] [PubMed] [Google Scholar]
- 63.Taskinen MR, Packard CJ, Borén J. Emerging Evidence that ApoC-III Inhibitors Provide Novel Options to Reduce the Residual CVD. Curr. Atheroscler. Rep. 2019;21:27. doi: 10.1007/s11883-019-0791-9. [DOI] [PMC free article] [PubMed] [Google Scholar]
- 64.Alexander VJ, et al. N-acetyl galactosamine-conjugated antisense drug to APOC3 mRNA, triglycerides and atherogenic lipoprotein levels. Eur. Heart J. 2019;40:2785–2796. doi: 10.1093/eurheartj/ehz209. [DOI] [PMC free article] [PubMed] [Google Scholar]
- 65.Taliun D, et al. Sequencing of 53,831 diverse genomes from the NHLBI TOPMed Program. Nature. 2021;590:290–299. doi: 10.1038/s41586-021-03205-y. [DOI] [PMC free article] [PubMed] [Google Scholar]
- 66.Oda E. A decrease in total bilirubin predicted hyper-LDL cholesterolemia in a health screening population. Atherosclerosis. 2014;235:334–338. doi: 10.1016/j.atherosclerosis.2014.05.927. [DOI] [PubMed] [Google Scholar]
- 67.Novotný L, Vítek L. Inverse relationship between serum bilirubin and atherosclerosis in men: a meta-analysis of published studies. Exp. Biol. Med (Maywood) 2003;228:568–571. doi: 10.1177/15353702-0322805-29. [DOI] [PubMed] [Google Scholar]
- 68.Franchini M, Targher G, Lippi G. Serum bilirubin levels and cardiovascular disease risk: A Janus Bifrons? Adv. Clin. Chem. 2010;50:47–63. doi: 10.1016/s0065-2423(10)50003-9. [DOI] [PubMed] [Google Scholar]
- 69.Broeder CE, et al. The Andro Project: physiological and hormonal influences of androstenedione supplementation in men 35 to 65 years old participating in a high-intensity resistance training program. Arch. Intern. Med. 2000;160:3093–104. doi: 10.1001/archinte.160.20.3093. [DOI] [PubMed] [Google Scholar]
- 70.Jones M. W., W.C., Ghassemzadeh S., Gallstones (Cholelithiasis). 2020: In: StatPearls [Internet]. Treasure Island (FL): StatPearls Publishing.
- 71.Ferkingstad E, et al. Genome-wide association meta-analysis yields 20 loci associated with gallstone disease. Nat. Commun. 2018;9:5101. doi: 10.1038/s41467-018-07460-y. [DOI] [PMC free article] [PubMed] [Google Scholar]
- 72.Amish Research Program http://www.medschool.umaryland.edu/endocrinology/Amish-Research-Program/.
- 73.Mitchell BD, et al. The genetic response to short-term interventions affecting cardiovascular function: Rationale and design of the Heredity and Phenotype Intervention (HAPI) Heart Study. Am. Heart J. 2008;155:823–828. doi: 10.1016/j.ahj.2008.01.019. [DOI] [PMC free article] [PubMed] [Google Scholar]
- 74.Irvin MR, et al. Apolipoprotein E polymorphisms and postprandial triglyceridemia before and after fenofibrate treatment in the Genetics of Lipid Lowering and Diet Network (GOLDN) Study. Circulation. Cardiovascular Genet. 2010;3:462–467. doi: 10.1161/CIRCGENETICS.110.950667. [DOI] [PMC free article] [PubMed] [Google Scholar]
- 75.Cajka, T. & Fiehn, O. LC–MS-Based Lipidomics and Automated Identification of Lipids Using the LipidBlast In-Silico MS/MS Library, in Lipidomics: Methods and Protocols, S. K. Bhattacharya, Editor. 2017, Springer New York: New York, NY. 149–170. [DOI] [PubMed]
- 76.Showalter MR, et al. Obesogenic diets alter metabolism in mice. PloS One. 2018;13:e0190632–e0190632. doi: 10.1371/journal.pone.0190632. [DOI] [PMC free article] [PubMed] [Google Scholar]
- 77.Cajka T, Smilowitz JT, Fiehn O. Validating quantitative untargeted lipidomics across nine liquid chromatography-high-resolution mass spectrometry platforms. Anal. Chem. 2017;89:12360–12368. doi: 10.1021/acs.analchem.7b03404. [DOI] [PubMed] [Google Scholar]
- 78.Fan S, et al. Systematic error removal using random forest for normalizing large-scale untargeted lipidomics data. Anal. Chem. 2019;91:3590–3596. doi: 10.1021/acs.analchem.8b05592. [DOI] [PMC free article] [PubMed] [Google Scholar]
- 79.Das S, et al. Next-generation genotype imputation service and methods. Nat. Genet. 2016;48:1284–1287. doi: 10.1038/ng.3656. [DOI] [PMC free article] [PubMed] [Google Scholar]
- 80.Loh PR, Palamara PF, Price AL. Fast and accurate long-range phasing in a UK Biobank cohort. Nat. Genet. 2016;48:811–816. doi: 10.1038/ng.3571. [DOI] [PMC free article] [PubMed] [Google Scholar]
- 81.Abecasis, G. R., GotCloud https://genome.sph.umich.edu/wiki/GotCloud.
- 82.Li H. Toward better understanding of artifacts in variant calling from high-coverage samples. Bioinforma. (Oxf., Engl.) 2014;30:2843–2851. doi: 10.1093/bioinformatics/btu356. [DOI] [PMC free article] [PubMed] [Google Scholar]
- 83.Global Lipids Genetics, C. et al. Discovery and refinement of loci associated with lipid levels. Nat. Genet. 2013;45:1274–1283. doi: 10.1038/ng.2797. [DOI] [PMC free article] [PubMed] [Google Scholar]
- 84.Surakka I, et al. The impact of low-frequency and rare variants on lipid levels. Nat. Genet. 2015;47:589–597. doi: 10.1038/ng.3300. [DOI] [PMC free article] [PubMed] [Google Scholar]
- 85.Teslovich TM, et al. Biological, clinical and population relevance of 95 loci for blood lipids. Nature. 2010;466:707–713. doi: 10.1038/nature09270. [DOI] [PMC free article] [PubMed] [Google Scholar]
- 86.Natarajan P, et al. Deep-coverage whole genome sequences and blood lipids among 16,324 individuals. Nat. Commun. 2018;9:3391. doi: 10.1038/s41467-018-05747-8. [DOI] [PMC free article] [PubMed] [Google Scholar]
- 87.Pirinen M, et al. biMM: efficient estimation of genetic variances and covariances for cohorts with high-dimensional phenotype measurements. Bioinformatics. 2017;33:2405–2407. doi: 10.1093/bioinformatics/btx166. [DOI] [PMC free article] [PubMed] [Google Scholar]
- 88.R Core Team. R: A language and environment for statistical computing. R Foundation for Statistical Computing,nVienna, Austria. https://www.R-project.org/.
- 89.O’Connell, J. R. Mixed Model Analysis for Pedigree and population (MMAP) https://github.com/MMAP10.5281/zenodo.5033491.
- 90.Bycroft C, et al. The UK Biobank resource with deep phenotyping and genomic data. Nature. 2018;562:203–209. doi: 10.1038/s41586-018-0579-z. [DOI] [PMC free article] [PubMed] [Google Scholar]
- 91.UKBiobank ICD PheWeb. 2019-06-30 https://pheweb.org/UKB-SAIGE/.
- 92.UK Biobank GWAS round 2 2019-03-30 http://www.nealelab.is/uk-biobank.
- 93.Pan-UK Biobank. 2020-11-30 https://pan.ukbb.broadinstitute.org/.
- 94.FinnGen Documentation of R4 release. 2020 2020-11-30 https://finngen.gitbook.io/.
- 95.Japanese Encyclopedida of Genetic associations by Riken http://jenger.riken.jp/en/result.
- 96.Perry, J. A. OASIS Resources, Video Library and Contact Information. https://edn.som.umaryland.edu/OASIS/.
- 97.Sherry ST, et al. dbSNP: the NCBI database of genetic variation. Nucleic Acids Res. 2001;29:308–311. doi: 10.1093/nar/29.1.308. [DOI] [PMC free article] [PubMed] [Google Scholar]
- 98.Genome Aggregation Database (gnomAD), https://gnomad.broadinstitute.org/
- 99.Carithers, L. J. & Moore H. M. The genotype-tissue expression (GTEx) project. 2015, Mary Ann Liebert, Inc. 140 Huguenot Street, 3rd Floor New Rochelle, NY 10801 USA.
- 100.Carvalho-Silva, D. et al. Open Targets Platform: new developments and updates two years on. Nucleic Acids Res. 2018: gky1133-gky1133. [DOI] [PMC free article] [PubMed]
- 101.Zerbino DR, et al. The ensembl regulatory build. Genome Biol. 2015;16:56. doi: 10.1186/s13059-015-0621-5. [DOI] [PMC free article] [PubMed] [Google Scholar]
- 102.Casper J, et al. The UCSC genome browser database: 2018 update. Nucleic Acids Res. 2017;46:D762–D769. doi: 10.1093/nar/gkx1020. [DOI] [PMC free article] [PubMed] [Google Scholar]
Associated Data
This section collects any data citations, data availability statements, or supplementary materials included in this article.
Supplementary Materials
Description of Additional Supplementary Files
Data Availability Statement
Amish phenotype, genotype, and lipidome data are available to academic investigator via a Data Use Agreement with UMB. GOLDN phenotype, genotype, and lipidome data are available to academic investigator via a Data Use Agreement with UAB. Please contact the corresponding author to initiate the data request. Source data underlying Figs. 1b and 2 are presented in Supplementary Data 2. Summary statistics are available through the GWAS Catalog (https://www.ebi.ac.uk/gwas/home) under accession GCP000299.