

Abstract
Radiotherapy (RT) combined with immune checkpoint inhibitors has recently produced outstanding results and is expected to be adaptable for various cancers. However, the precise molecular mechanism by which immune reactions are induced by fractionated RT is still controversial. We aimed to investigate the mechanism of the immune response regarding multifractionated, long‐term radiation, which is most often combined with immunotherapy. Two human esophageal cancer cell lines, KYSE‐450 and OE‐21, were irradiated by fractionated irradiation (FIR) daily at a dose of 3 Gy in 5 d/wk for 2 weeks. Western blot analysis and RNA sequencing identified type I interferon (IFN) and the stimulator of IFN genes (STING) pathway as candidates that regulate immune response by FIR. We inhibited STING, IFNAR1, STAT1, and IFN regulatory factor 1 (IRF1) and investigated the effects on the immune response in cancer cells and the invasion of surrounding immune cells. We herein revealed type I IFN‐dependent immune reactions and the positive feedback of STING, IRF1, and phosphorylated STAT1 induced by FIR. Knocking out STING, IFNAR1, STAT1, and IRF1 resulted in a poorer immunological response than that in WT cells. The STING‐KO KYSE‐450 cell line showed significantly less invasion of PBMCs than the WT cell line under FIR. In the analysis of STING‐KO cells and migrated PBMCs, we confirmed the occurrence of STING‐dependent immune activation under FIR. In conclusion, we identified that the STING‐IFNAR1‐STAT1‐IRF1 axis regulates immune reactions in cancer cells triggered by FIR and that the STING pathway also contributes to immune cell invasion of cancer cells.
Keywords: cGAS‐STING, esophageal cancer, fractionated irradiation, immune checkpoint, immune response
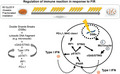
We elucidated that the fractionated irradiation‐induced immune response is regulated by the STING‐IFNAR1‐STAT1‐IRF1 pathway, which includes positive feedback, and that this mechanism acts not only on cancer cells but also on surrounding PBMCs.
Abbreviations
- CRT
chemoradiotherapy
- DEG
differentially expressed gene
- FIR
fractionated irradiation
- fr
fraction
- GO
Gene Ontology
- ICI
immune checkpoint inhibitor
- IFN
type I interferon
- IR
irradiation
- IRF1
IFN regulatory factor 1
- non‐IR/NIR
nonirradiated
- PD‐L1
programmed cell death‐ligand 1
- RNA‐seq
RNA sequencing
- RT
radiotherapy
- SBRT
stereotactic body therapy
- sgRNA
single guide RNA
- STING
stimulator of interferon genes
- TME
tumor microenvironment
- WB
western blotting
1. INTRODUCTION
Radiotherapy is widely used as a first‐line therapy for various cancers, such as esophageal cancer, 1 and is considered to be immunosuppressive due to the radiosensitivity of leukocytes. However, recent data have shown that RT can enhance the regulation of various components of antigen processing and presentation pathways. 2 , 3 Furthermore, a phase III trial showed that definitive CRT followed by ICI treatment improved progression‐free survival and overall survival rates of patients with locally advanced non‐small‐cell lung cancer. 4 However, with the current strategy of combining ICIs with RT, the 4‐year overall survival rate is approximately 50%, and it is therefore necessary to improve the treatment results and understand the molecular mechanism. Radiation exposure induces an immune reaction in the tumor tissue and surrounding immune cells (such as lymphocytes and macrophages) among PBMCs through the IFN pathway in vitro and in vivo. It has been reported that infiltrated immune cells further induce an immune response in cancer cells through IFNγ and other cytokines. Therefore, the first response of radiation and cancer cells to attract surrounding immune cells is a very important trigger, and this reaction is considered a master regulator of the cancer immune reaction in the TME caused by irradiation. 5
Recent in vitro studies aimed to elucidate the molecular mechanism underlying radiation‐induced immune responses. Although these studies have revealed pathways that are potentially involved in the radiation‐induced immune response, including TREX1‐exosomes, 6 STING‐type I IFNs 7 and STING‐independent ATR‐Chk‐IRF, 8 the results are conclusive. It has also been reported that radiation‐induced immune responses differ depending on the fractionation schema utilized, and determining the optimal and/or suitable fraction strategy for inducing an immune reaction is important. 6
No phase III clinical trials have compared the various fractionation schema, and almost all ongoing clinical trials (Table S1) are assessing multifractionated RT, where the total radiation exceeds 50 Gy over 5 weeks. In addition, several phase II studies have begun to assess the efficacy of SBRT, during which one to five fractions are provided within a few days (eg, 2‐5 days); however, SBRT and ICIs in combination have not yet become standard therapy.
Therefore, the purpose of this study was to screen the regulatory pathway that can induce an immune reaction in response to FIR in esophageal cancer cells in vitro and to clarify the function of this pathway in cancer cell lines and surrounding immune cells.
2. MATERIALS AND METHODS
2.1. Cell lines and cell culture
Esophageal squamous cell cancer cell lines, KYSE‐450 and OE‐21, were obtained from the Japanese Collection of Research Bioresources Cell Bank, National Institutes of Biomedical Innovation and maintained at 37°C in RPMI‐1640 medium (Sigma‐Aldrich) supplemented with 10% FBS (Biowest) under 5% CO2.
2.2. In vitro fractionated irradiation
In recent years, a hypofraction study of 2.5 to 4 Gy/fr has been reported for the purpose of shortening the treatment period, and antitumor effects and adverse events similar to 2 Gy/fr have been reported in cancers including esophageal cancer 9 , 10 although conventional fraction is still standard for esophageal cancer (and also CRT is the standard therapy). Furthermore, 30 Gy in 10 fractions is one major option for palliative RT in esophageal cancer. 11 Therefore, biological event in 30 Gy/10 fr is also important in radiotherapy for patients with esophageal cancer. For these reasons, we used 3 Gy/fr.
The KYSE‐450 and OE‐21 cell lines were cultured in 95‐mm dishes and grown to 80%–90% confluency before irradiation. Both cell lines were irradiated as previously described. 12 Briefly, cells were irradiated at a dose rate of 3 Gy/min with a Clinac iX System Linear Accelerator (Varian Medical Systems, Tokyo, Japan) using an energy of 6 MV photons. 13 The cells were exposed to a total dose of 60 Gy in 20 fractions, five times in a week.
2.3. Gene expression analysis
The quality of the extracted RNA was assessed on an Agilent Bioanalyzer 2100 system, and RNA‐seq was carried out (Filgen). All data were subjected to quality control filtering, trimming, and adaptor removal using the FASTQC and FASTQ toolkits (BaseSpace, Illumina, NEB). More specifically, reads containing N > 10% and having a low quality (Qscore ≤ 5) base, which is over 50% of the total base, were removed. All filtered sequences were aligned to the hg38 reference genome and their expression was represented as transcripts per million calculated by RSEM. Differentially expressed genes were identified by using the R package edgeR 14 with a false discovery rate of 0.05 or less. Differentially expressed genes were used for GO and Kyoto Encyclopedia of Genes and Genomes analyses with the iPathway Guide (ADVITA) and Metascape, 15 and then visualized with Cytoscape. 16
2.4. Western blot analysis
Cells were harvested 24 h after exposure to the radiation doses indicated. For protein extraction, cells were scraped and washed with cold PBS, then lysed in RIPA buffer (Wako) containing a proteinase inhibitor cocktail (P8340; Sigma) for 20 minutes on ice and cleared by centrifugation. The protein samples were quantified by a BCA assay (Thermos), separated by SDS‐PAGE (Wako), transferred to a PVDF membrane (Bio‐Rad), and detected by immunoblotting with the Abs indicated (Table S2). More specifically, the blots were detected with ECL reagent (RPN2232; GE Healthcare) and visualized by ImageQuant LAS 4000mini (GE). Relative quantification was undertaken using ImageJ software, and GAPDH was used as the reference for normalization.
2.5. Flow cytometry
To determine the PD‐L1 protein levels, cells were suspended in a staining buffer (PBS, 1% BSA, and 0.1% sodium azide). Human Fc receptors were blocked by exposure to Clear Back (MBL) for 5 minutes at room temperature. The cells were then stained for 30 minutes with a primary Ab at room temperature, washed three times in the staining buffer, and incubated for 20 minutes with a fluorophore‐conjugated secondary Ab on ice in the dark. Flow cytometry analysis was undertaken on a BD FACSCanto flow cytometer.
2.6. Gene KO with CRISPR‐Cas9
The TrueCut Cas9 protein v2, sgRNAs, the Neon Transfection System 10 µL Kit, and the Genomic Cleavage Detection Kit were purchased from Thermo Fisher Scientific. A total of 1 × 10⁵ cells were used per electroporation. The TrueCut Cas9 protein and sgRNAs were transfected into cells with the Neon Transfection System 10 μL Kit. Two sets of sgRNAs targeting different genomic loci were electroporated into the cells: STING (CRISPR802251_SG and CRISPR802254_SG), IRF1 (CRISPR845548_SG and CRISPR845553_SG), STAT1 (CRISPR855440_SG and CRISPR855449_SG), and IFNAR1 (CRISPR842567_SG and CRISPR842572_SG). Following electroporation, the cells were immediately placed in 2 mL prewarmed culture medium. After clonal isolation, the target locus was amplified and validated by capillary sequencing.
2.7. Nuclear staining
Cells were fixed in 4% formaldehyde for 15 minutes at room temperature, washed with PBS, and incubated for 15 minutes at room temperature. The cells were then washed with PBS again and stained with 1 µg/mL Hoechst 33342 for 10 minutes at room temperature. Images were captured with a BZ9000 fluorescence microscope system (Keyence). The structures stained by Hoechst 33342 outside the main nucleus were classified as micronuclei. Cells with micronuclei were counted manually in each field (20× magnification), and the results are expressed as the percentage of all cells within the field counted. A total of 50–70 cells was counted in every field.
2.8. Migration assay of PBMCs
One milliliter of medium from IR and NIR cancer cells was transferred to a 24‐well plate, and an upper chamber TC pore 3.0 µm, 33.6 mm2 (#662631; Gleiner) was set.
We diluted 300,000 PBMCs (#PB009C‐2; HemaCare) (Lot:20062735) in 300 µL RPMI/10% FBS; the cells were added onto the upper chamber and incubated at 37°C for 4 hours. The chamber was washed twice with PBS, stained with crystal violet, and observed under a microscope. The PBMCs that migrated through the medium were automatically counted by Countess Cell Counting Chamber Slides (Invitrogen). The experiment was reproduced with biological duplicates.
2.9. Peripheral blood mononuclear cell RNA‐seq and in silico analysis
RNA sequencing was carried out 16 hours after NIR and IR treatment. The proportion of PBMCs and the immune score were evaluated with quanTIseq 17 and X‐cell, 18 , 19 respectively.
2.10. Statistical analysis
Statistical analysis of the WB scan and micronucleus staining data was undertaken with Excel (Microsoft) and R software version 4.0.3 (The R Foundation). The statistical significance of differences between two groups was assessed by an unpaired, two‐tailed Student's t test. Differences among multiple groups were examined by one‐way ANOVA followed by Tukey–Kramer tests. A p value less than 0.05 was considered statistically significant. The data are presented as the mean ± SD.
3. RESULTS
The details of the current preclinical model have been reported previously. Clinically relevant irradiation at a dose of 60 Gy/20 fr over 4 weeks resulted in cell death and morphological trends that were nearly similar to those observed in cancerous tissues obtained from patients who were treated with fractionated RT. 12 In this preclinical study, we focused on an immune response that was elevated for more than 2 weeks and determined its profile and regulatory genes in esophageal squamous cell carcinoma cell lines (Figure 1A). We selected the KYSE‐450 and OE‐21 cell lines, which are often used for radiation experiments and have moderate radioresistance and genetic backgrounds similar to that of esophageal cancerous tissues. 20 , 21
FIGURE 1.
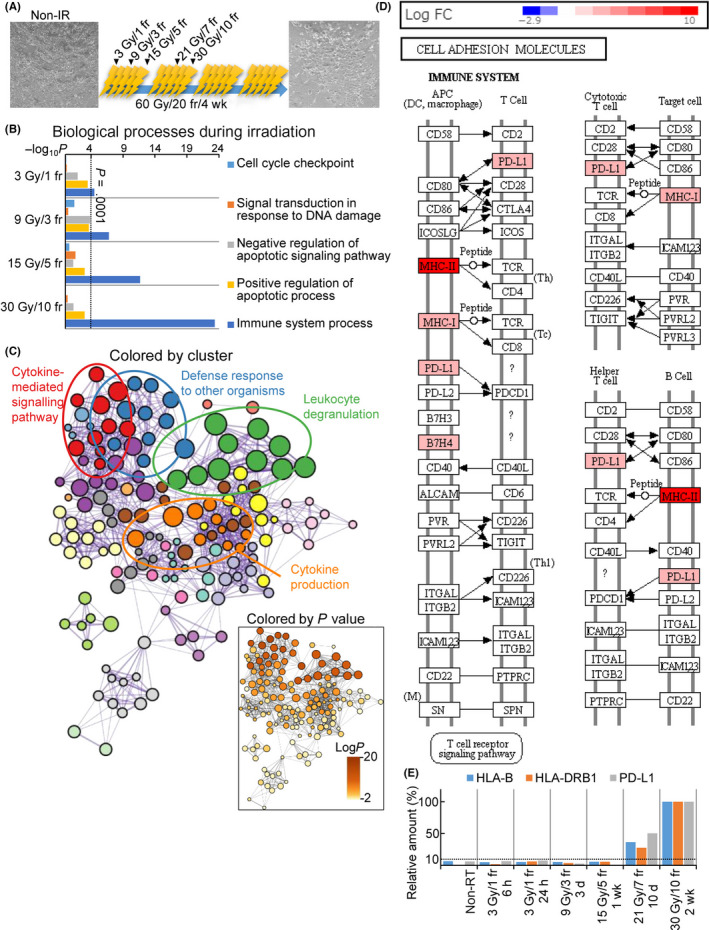
Fractionated irradiation (IR) activates the immune response in cancer cells. (A) Time course of fractionated IR. Bright‐field images show KYSE‐450 cells before and after treatment with irradiation at 60 Gy/20 fractions (fr). Scale bar = 100 µm. (B) Biological processes activated during the clinical irradiation of KYSE‐450 cells. The Gene Ontology (GO) terms were enriched in differentially expressed genes as determined by the RNA‐sequencing of non‐IR cells and cells treated with 30 Gy/10 fr IR. (C) GO enrichment network of KYSE‐450 cells exposed to irritation at 30 Gy/10 fr. (D) Kyoto Encyclopedia of Genes and Genomes map of cell adhesion molecule pathways in KYSE‐450 cells exposed to 30 Gy/10 fr. (E) Relative expression of HLA‐B, HLA‐DRB1, and programmed cell death‐ligand 1 (PD‐L1) during fractionated irradiation. Each time point was calculated as the percentage in the 30 Gy/10 fr group. APC, antigen‐presenting cell; DC, dendritic cell; PD‐L1, programmed cell death‐ligand 1; RT, radiotherapy
First, we evaluated the biological process induced by FIR, determined the transcriptomic profiles of irradiated cancer cells at different time points by RNA‐seq, and compared the results with those obtained in NIR cells. We undertook pathway and GO analyses that focused on the cell cycle, response to DNA damage, and regulation of the apoptotic process, which are known to be activated after irradiation. The pathways were significantly activated at the analysis after 3 Gy/1 fr (Figure 1B), but activation gradually decreased thereafter (dose range, 9 Gy/3 fr to 30 Gy/10 fr). Conversely, immune response pathways were upregulated in a dose‐dependent manner during FIR. The immune response at a dose of 30 Gy/10 fr was significantly upregulated (NIR vs. 30 Gy/10 fr, LogP = −20.01) in KYSE‐450 cells in comparison with NIR cells. In KYSE‐450 cells, the upregulated genes were enriched in GO terms associated with cytokine‐mediated signaling and the response to IFNs (Figures 1C, 2A). The expression levels of MHC I and MHC II pathway components were also synchronously upregulated (Figures 1D and S1A,B,D). Interestingly, the expression of genes related to immune activity, including MHC class I and II and PD‐L1, was also upregulated (Figures 1D–E and S1A–C). Their upregulated expression was also confirmed by WB and flow cytometry (Figure S2).
FIGURE 2.
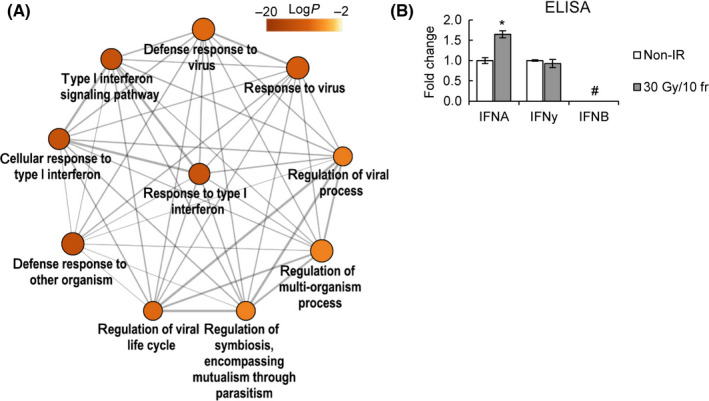
Fractionated irradiation (IR)‐induced immune response is regulated by type I interferon (IFN) and JAK signaling. (A) Enriched Gene Ontology terms related to type I IFN signaling. (B) IFN secretion by KYSE‐450 cells in response to 30 Gy/10 fr or non‐IR, assessed by ELISA. IFNA: fold change = 1.65 ± 0.08, P = .008; IFNγ: fold change = 0.93 ± 0.09, P = .89. *P < .05, Student’s t test; #not detected
Type I IFN‐related genes were found to be significantly activated after irradiation (Figure 2A) (NIR vs. 30 Gy/10 fr LogP = −13.08), which was consistent with a significant induction of IFN‐α secretion (P = .008, Figure 2B).
Next, the mechanism of RT‐induced type I IFNs was evaluated. The micronuclei formed after irradiation have been reported to induce the phosphorylation of STAT1Y701, an inflammation surrogate, in a cGAS‐STING‐dependent manner. 7 We hypothesized that IR‐induced type I IFNs are STING‐dependent and that immune‐related genes are regulated by STAT1‐ and IRF1‐mediated transcription, like previously reported signals activated by IFNγ. 22 As shown in Figure 3A, micronucleus formation increased significantly at a dose of 30 Gy/10 fr (P = .02), and STING, STAT1Y701, IRF1, and PD‐L1 were also induced in parallel, whereas the phosphorylation of IRF3 was not (Figure 3B).
FIGURE 3.
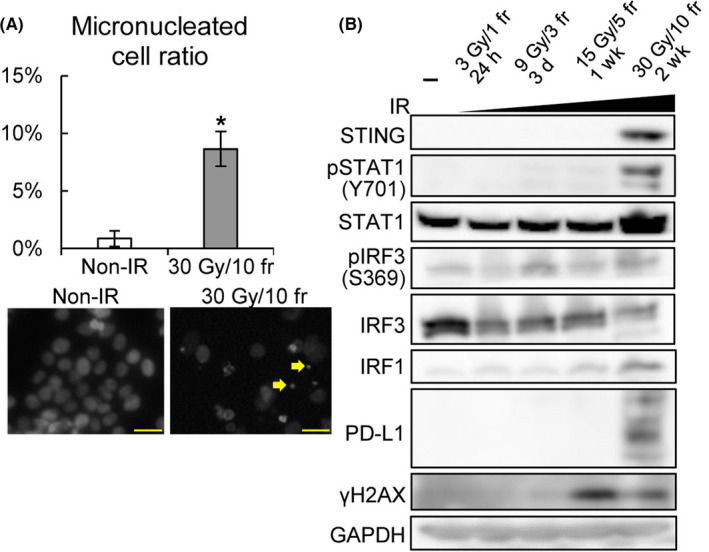
Irradiation (IR)‐induced programmed cell death‐ligand 1 (PD‐L1) expression is cGAS–STING pathway‐dependent but DNA repair signaling‐independent. (A) Percentage of micronucleated cells (top) and Hoechst staining of nonirradiated (non‐IR) KYSE‐450 cells (bottom left) and cells exposed to 30 Gy/10 fr (bottom right). Micronuclei are indicated by the yellow arrows. Scale bar = 50 µm. *P < .05, Student’s t test. (B) Protein expression analysis of molecules upstream of PD‐L1 in KYSE‐450 cells to evaluate their expression in response to the indicated fractionated radiotherapy. GAPDH was used as a loading control
Next, the candidate genes that were closely involved in regulation of the immune response caused by FIR were analyzed. STING‐KO, IFNAR1‐KO, STAT1‐KO, IRF1‐KO, and KYSE‐450 cell lines using the CRISPR‐Cas9 technique were used. The STING‐, IRF1‐, and STAT1‐KO clones were verified by WB (Figure S3A–C), and the effects of gene KO on the immune response were evaluated by transcriptomic analysis. Two KO clones were used for the experiments described below, except for IFNAR1‐KO cell.
Gene Ontology enrichment analysis showed that STING, IFNAR1, STAT1, and IRF1 deficiencies resulted in significant downregulation of type I IFN‐related immune‐related genes (Figures 4A–C and S3D,E). In STING‐, STAT1‐, and IRF1‐deficient KYSE‐450 cells, the induction of MHC class I and partially MHC class II genes as well as PD‐L1 was reduced by irradiation at a dose of 30 Gy/10 fr (Figure 4D). In contrast, IFNAR1 was required only for induction of MHC class I gene but not for PD‐L1 expression (Figure 4D). Type I IFNs activate the transcription of STING and IRF1 through STAT1 together with IRF9. 23 We also found that the disruption of STING, IRF1, STAT1, and IFNAR1 similarly downregulated STING, IFNAR1, STAT1, and IRF1 (Figure S4).
FIGURE 4.
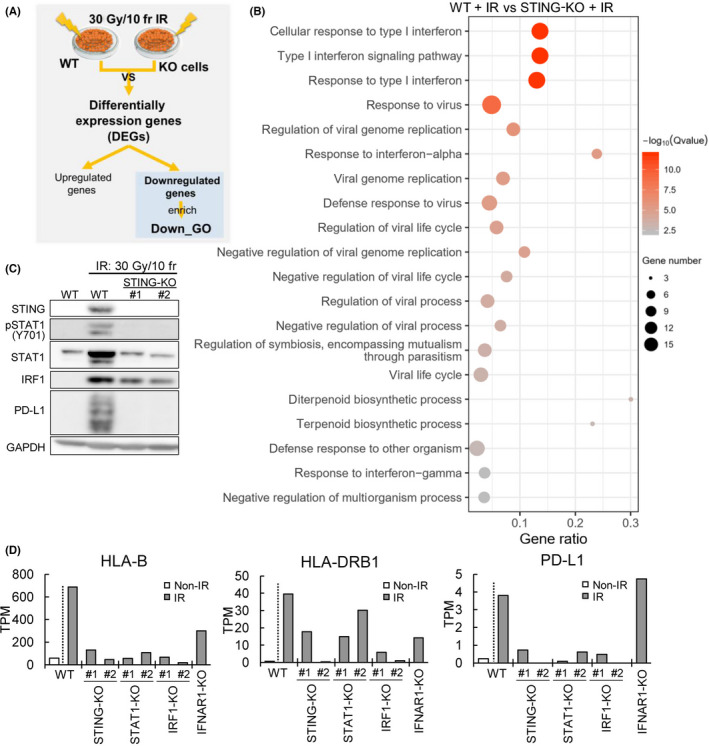
Defects in the STING/IRF1‐STAT1 pathway impair the irradiation (IR)‐induced immune response. We established STING, IFNAR1, STAT1, and IRF1 Knockout cells (STING‐, IFNAR1‐, STAT1‐,IRF1‐) and investigated their functions. (A) Workflow of the data analysis. (B) Gene Ontology (GO) analysis of downregulated differentially expressed genes (DEGs) in WT and STING‐KO KYSE‐450 cells. (C) Protein expression analysis of WT and STING‐KO KYSE‐450 cells after exposure to IR at 30 Gy/10 fr or to no radiation. (D) HLA‐B, HLA‐DRB1, and PD‐L1 expression in non‐IR and IR (30 Gy/10 fr) WT and STING‐, IFNAR1‐, STAT1‐, and IRF1‐KO cells. Data analysis was undertaken with two biological replicates.TPM, transcripts per million
These regulatory functions of STING and STAT1 in the immune response caused by FIR were also observed in OE‐21 cells (Figure S5). These findings indicate that the STING‐IFNAR1‐STAT1‐IRF1 pathway acts as a positive feedback pathway and is essential for the immune response caused by FIR. The role of the STING‐IFN pathway in cancer cells and surrounding PBMCs was investigated with STING‐KO cells (Figure 5A,B). The STING‐KO KYSE‐450 cell line showed significantly lower PBMC invasion (P < .01) than the WT cell line, as determined by FIR (Figure 5C,D). We undertook in silico analysis of migrated PBMCs with RNA‐seq, x‐Cell, 18 and quanTIseq. 17 In the irradiated WT (IR wild) group, most PBMCs were M1 macrophages. In the NIR and IR STING KO groups, M1 macrophages accounted for the main fraction, but the proportions of other cells, such as T cells, tended to be high (Figure 5E). M1 macrophage activation makers such as CD80 and interleukin‐1A increased from the NIR wild to the IR wild group and were decreased in the STING‐KO IR group (Figure 5F). The immune score, which indicates immune activity, tended to be increased in IR wild and decreased in the IR STING‐KO group with respect to the NIR group (Figure 5G). These results indicate the occurrence of STING‐dependent immune activation under FIR.
FIGURE 5.
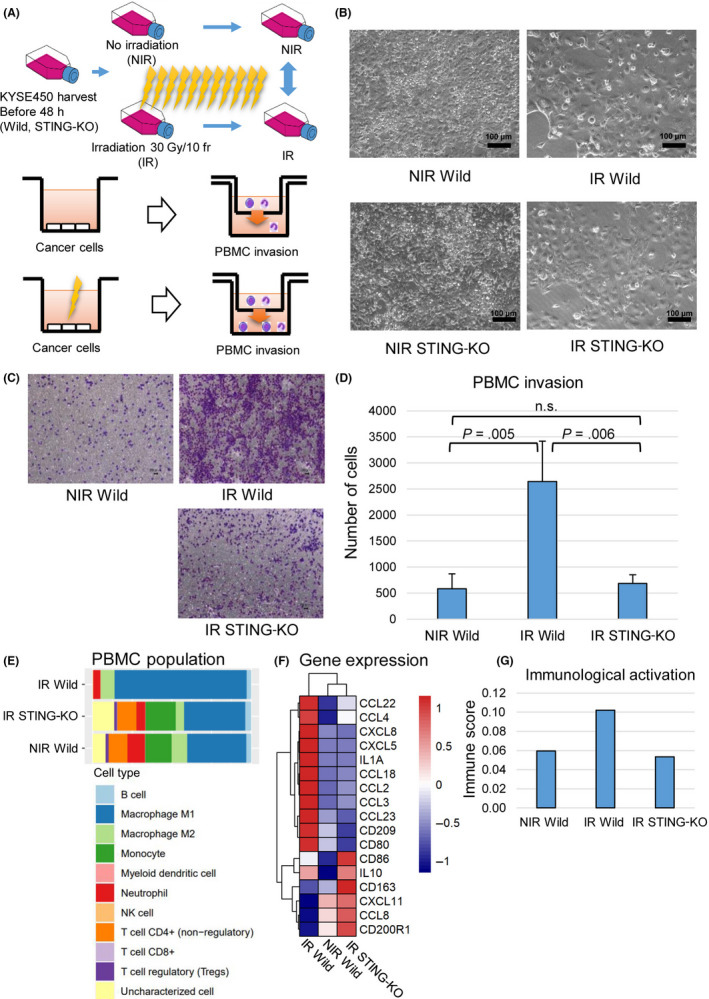
(A) Graphical abstract for the PBMC invasion assay. KYSE‐450 WT and STING‐KO cells were cultured for the same period in the nonirradiated (NIR) and irradiated (IR) groups. (B) Microscopic images of KYSE450 cells (WT and STING‐KO) in the non‐IR and IR groups. (C) Crystal violet staining of PBMCs that passed through the chamber. KYSE450 cells were used. (D) Measurement of PBMCs that passed through the chamber. The WT non‐IR, IR, and STING‐KO IR cells were measured three times each. The experiment was conducted twice, and reproducibility was confirmed. (E) PBMC population analyzed by RNA sequencing with quanTIseq. (F) Relative expression of immune‐related genes in non‐IR wild, IR wild, and IR STING‐KO. RNA sequencing was carried out on infiltrated PBMCs in each group 16 h after treatment. (G) Immune score in NIR wild, IR wild, and IR STING‐KO were calculated with X‐cell to evaluate immunological activation or PBMCs in each group
Moreover, we compared the changes in the expression of genes related to immune activity that occur after FIR (30 Gy/10 fr) with those that occur after 15 Gy of single‐fraction irradiation (approximately the same biologically effective dose at α/β = 10 Gy). Th equivalent dose (2 Gy) is also similar (31.25 and 32.5 Gy). In single‐fraction irradiation, the expression levels of MHC class I, IRF1, and PD‐L1 were most elevated at 5‐7 days after irradiation, whereas the expression levels of MHC class II and the previously mentioned genes were gradually increased during FIR (Figure S6A–D). In both single‐fraction irradiation and FIR, STING deficiency decreased phosphorylated STAT1 expression and PBMC invasion (Figure S6E–G), implying that the immune activation induced by single‐fraction irradiation and FIR is STING‐dependent.
4. DISCUSSION
It has recently been reported that RT induces a complex immune response, including the upregulation of MHC class I and II genes, PD‐L1, and pro‐inflammatory mediators. Furthermore, the radiation‐induced immune response has often been described colloquially as turning immunologically “cold” tumors into “hot” tumors. 5 Therefore, RT combined with ICIs is expected to be the standard treatment in several cancers, and the elucidation of its mechanism is therefore important not only biologically but also clinically.
Radiation‐induced immune responses differ depending on the radiation schedule. Although several STING‐independent immune responses have been reported to result from a single dose of irradiation, 6 , 8 STING‐dependent pathways have been reportedly activated in response to three doses of irradiation with 6‐8 Gy, which is similar to the SBRT schedule. 6 However, there are a few reports of multifractionated irradiation at less than 3 Gy per fraction for more than 1 week.
We focused on the immune response induced by FIR for several weeks, which is most frequently used in combination with ICIs (Table S1) because we consider that immune reaction triggered by FIR would be influenced or changed by time points after the start of RT. We previously established a multifractionated, high‐dose experimental system by irradiating cancer cell lines with 60 Gy/20 fr over 4 weeks. 12 This model can be used to study the effects of radiation above 30 Gy for more than 1 week, unlike previous studies that focused on the early response induced within 72 hours after a single irradiation dose. 6 , 7 , 8
As a characteristic of the immune response to high doses of FIR over a long period, genes that positively regulate cancer immune responses, such as MHC class genes, and genes that negatively regulate cancer immune responses, such as PD‐L1, were induced simultaneously. This result indicates that fractionated RT could induce and regulate the immune response in a bidirectional manner. Furthermore, it suggests that a stronger immune response can be obtained by suppressing negative regulators, such as PD‐L1, which is consistent with the results of previous clinical trials. 24 Conversely, the expression levels of VTCN1 25 and IDO, 26 which suppress other lymphocyte activities, were found to be elevated in addition to PD‐L1, further suggesting that drugs targeting these genes might potentially benefit RT in combination with ICIs.
Next, we elucidated the molecular mechanism of the radiation‐induced immune response. Several pathways that can induce an immune response upon irradiation have been reported, such as TREX1‐exosomes, 6 STING‐type I IFNs, 7 and STING‐independent ATR‐Chk‐IRF. 8
Our results show that the immune response to FIR is also regulated by the major STING‐type I IFN pathway, and we present two novel findings.
One novel finding is that the STING‐IFNAR1‐STAT1‐IRF1 axis acts as a positive feedback pathway, and the other is that FIR is attracted by surrounding immune cells triggered by STING. We found that the amount of STING protein was significantly increased and that phosphorylation of IRF3 was not increased, but the activation of STAT1‐IRF1 was remarkable. Previous reports have shown that the immune response is primarily mediated by the phosphorylation cascade of the STING‐TBK‐IRF3 axis, which can activate IFN‐stimulated response element and IFN production without changing the protein expression level of STING, 7 and that released type I IFN activates the IFNAR‐JAK‐STAT pathway.
Fractionated irradiation, in which daily irradiation is repeated for more than 1 month, is a type of RT used for esophageal cancer treatment. During this process, the use of a positive feedback system is a reasonable strategy to boost the immune reaction. Our positive feedback model indicated that IFNAR, STAT1, and IRF1 can be therapeutic targets and markers similar to STING.
It has also been reported that radiation‐induced immune responses of cancer cells occur through PBMCs, including macrophages, dendritic cells, and CD4+ cells, in cancer tissues. 27 We confirmed that the migration of all these cell fractions was increased by FIR in vitro and that the intracellular immune response and cytokine production were increased in a STING‐dependent manner. In addition, patient tissue analysis in the presence of stroma cells and other TMEs also confirmed activation of the STING pathway by FIR.
Another feature of our experimental system was that the immune activation induced by single‐fraction irradiation and FIR was STING‐dependent. There was no obvious difference between FIR and single‐fraction irradiation, regardless of the assay used.
The limitation of our study is that the in vitro experimental system does not perfectly mimic actual radiation therapy and TME. To completely understand the cancer immune reaction in cancer tissues, it is necessary to investigate interaction with surrounding normal cells (eg, stromal cells, epithelial cells) in future works. High‐dose irradiation for a long period is difficult to translate to animal experiments because of its toxicity. Although our system cannot reflect the effects of anticancer drugs and other immune cells, it does allow us to define the responsible genes and pathways. As described above, the induction of an IFN response in cancer cells by radiation is the first trigger that leads to activation of the TME immune response, and elucidation of the mechanism leads to improvement of radiation therapy combined with immunotherapy.
Another limitation is the sample size. Most RNA‐seq experiments are biologically duplicated. In contrast, KO cells were verified with two clones, and KOs of STING and STAT1 were also verified with OE21 cells. In addition, most of the results of RNA expression have been verified and confirmed by WB.
In summary, we have elucidated that the FIR‐induced immune response is regulated by the STING‐IFNAR1‐STAT1‐IRF1 pathway, which includes positive feedback, and that this mechanism acts not only on cancer cells but also on surrounding PBMCs. Therefore, our results will significantly contribute to the identification of biomarkers and target genes for developing ICI/RT combination strategies.
DISCLOSURE
The authors have no conflict of interest.
Supporting information
Fig S1‐S6
Table S1‐S2
ACKNOWLEDGMENTS
This study was funded by Grants‐in‐Aid for Scientific Research KAKENHI (18K07740) and the National Cancer Center Research and Development Fund (31‐A‐10 and 21‐A‐8).
Du J, Kageyama S‐I, Yamashita R, et al. Impacts of the STING‐IFNAR1‐STAT1‐IRF1 pathway on the cellular immune reaction induced by fractionated irradiation. Cancer Sci. 2022;113:1352–1361. doi: 10.1111/cas.15297
Funding information
Japan Society for the Promotion of Science KAKENHI, Grant/Award Number: 18K07740; National Cancer Center Research and Development Fund, Grant/Award Number: 31‐A‐10, 21‐A‐8.
REFERENCES
- 1. Baskar R, Lee KA, Yeo R, Yeoh K‐W. Cancer and radiation therapy: current advances and future directions. Int J Med Sci. 2012;9:193‐199. [DOI] [PMC free article] [PubMed] [Google Scholar]
- 2. Begg AC, Stewart FA, Vens C. Strategies to improve radiotherapy with targeted drugs. Nat Rev Cancer. 2011;11:239‐253. [DOI] [PubMed] [Google Scholar]
- 3. Liauw SL, Connell PP, Weichselbaum RR. New paradigms and future challenges in radiation oncology: an update of biological targets and technology. Sci Transl Med. 2013;5:173sr172. [DOI] [PMC free article] [PubMed] [Google Scholar]
- 4. Faivre‐Finn C, Vicente D, Kurata T, et al. Four‐year survival with durvalumab after chemoradiotherapy in stage III NSCLC‐an update from the PACIFIC trial. J Thorac Oncol. 2021;16:860‐867. [DOI] [PubMed] [Google Scholar]
- 5. McLaughlin M, Patin EC, Pedersen M, et al. Inflammatory microenvironment remodelling by tumour cells after radiotherapy. Nat Rev Cancer. 2020;20:203‐217. [DOI] [PubMed] [Google Scholar]
- 6. Vanpouille‐Box C, Alard A, Aryankalayil MJ, et al. DNA exonuclease Trex1 regulates radiotherapy‐induced tumour immunogenicity. Nat Commun. 2017;8:15618. [DOI] [PMC free article] [PubMed] [Google Scholar]
- 7. Harding SM, Benci JL, Irianto J, Discher DE, Minn AJ, Greenberg RA. Mitotic progression following DNA damage enables pattern recognition within micronuclei. Nature. 2017;548:466‐470. [DOI] [PMC free article] [PubMed] [Google Scholar]
- 8. Sato H, Niimi A, Yasuhara T, et al. DNA double‐strand break repair pathway regulates PD‐L1 expression in cancer cells. Nat Commun. 2017;8:1751. [DOI] [PMC free article] [PubMed] [Google Scholar]
- 9. Incrocci L, Wortel RC, Alemayehu WG, et al. Hypofractionated versus conventionally fractionated radiotherapy for patients with localised prostate cancer (HYPRO): final efficacy results from a randomised, multicentre, open‐label, phase 3 trial. Lancet Oncol. 2016;17:1061‐1069. [DOI] [PubMed] [Google Scholar]
- 10. Jones CM, Spencer K, Hitchen C, et al. Hypofractionated radiotherapy in oesophageal cancer for patients unfit for systemic therapy: a retrospective single‐centre analysis. Clin Oncol (R Coll Radiol). 2019;31:356‐364. [DOI] [PubMed] [Google Scholar]
- 11. Penniment MG, De Ieso PB, Harvey JA, et al. Palliative chemoradiotherapy versus radiotherapy alone for dysphagia in advanced oesophageal cancer: a multicentre randomised controlled trial (TROG 03.01). Lancet Gastroenterol Hepatol. 2018;3:114‐124. [DOI] [PubMed] [Google Scholar]
- 12. Kageyama S‐I, Du J, Kaneko S, et al. Identification of the mutation signature of the cancer genome caused by irradiation. Radiother Oncol. 2020;155:10‐16. [DOI] [PubMed] [Google Scholar]
- 13. Hojo H, Dohmae T, Hotta K, et al. Difference in the relative biological effectiveness and DNA damage repair processes in response to proton beam therapy according to the positions of the spread out Bragg peak. Radiat Oncol. 2017;12:111. [DOI] [PMC free article] [PubMed] [Google Scholar]
- 14. McCarthy DJ, Chen Y, Smyth GK. Differential expression analysis of multifactor RNA‐Seq experiments with respect to biological variation. Nucleic Acids Res. 2012;40:4288‐4297. [DOI] [PMC free article] [PubMed] [Google Scholar]
- 15. Zhou Y, Zhou B, Pache L, et al. Metascape provides a biologist‐oriented resource for the analysis of systems‐level datasets. Nat Commun. 2019;10:1523. [DOI] [PMC free article] [PubMed] [Google Scholar]
- 16. Shannon P, Markiel A, Ozier O, et al. Cytoscape: a software environment for integrated models of biomolecular interaction networks. Genome Res. 2003;13:2498‐2504. [DOI] [PMC free article] [PubMed] [Google Scholar]
- 17. Finotello F, Mayer C, Plattner C, et al. Molecular and pharmacological modulators of the tumor immune contexture revealed by deconvolution of RNA‐seq data. Genome Med. 2019;11:34. [DOI] [PMC free article] [PubMed] [Google Scholar]
- 18. Aran D, Hu Z, Butte AJ. xCell: digitally portraying the tissue cellular heterogeneity landscape. Genome Biol. 2017;18:220. [DOI] [PMC free article] [PubMed] [Google Scholar]
- 19. Sturm G, Finotello F, Petitprez F, et al. Comprehensive evaluation of transcriptome‐based cell‐type quantification methods for immuno‐oncology. Bioinformatics. 2019;35:i436‐i445. [DOI] [PMC free article] [PubMed] [Google Scholar]
- 20. Yard BD, Adams DJ, Chie EK, et al. A genetic basis for the variation in the vulnerability of cancer to DNA damage. Nat Commun. 2016;7:11428. [DOI] [PMC free article] [PubMed] [Google Scholar]
- 21. Hojo H, Dohmae T, Hotta K, et al. Effect of 5‐fluorouracil on cellular response to proton beam in esophageal cancer cell lines according to the position of spread‐out Bragg peak. Acta Oncol. 2019;58:475‐482. [DOI] [PubMed] [Google Scholar]
- 22. Garcia‐Diaz A, Shin DS, Moreno BH, et al. Interferon receptor signaling pathways regulating PD‐L1 and PD‐L2 expression. Cell Rep. 2017;19:1189‐1201. [DOI] [PMC free article] [PubMed] [Google Scholar]
- 23. Barrat FJ, Crow MK, Ivashkiv LB. Interferon target‐gene expression and epigenomic signatures in health and disease. Nat Immunol. 2019;20:1574‐1583. [DOI] [PMC free article] [PubMed] [Google Scholar]
- 24. Antonia SJ, Villegas A, Daniel D, et al. Overall survival with durvalumab after chemoradiotherapy in stage III NSCLC. N Engl J Med. 2018;379:2342‐2350. [DOI] [PubMed] [Google Scholar]
- 25. Altan M, Kidwell KM, Pelekanou V, et al. Association of B7–H4, PD‐L1, and tumor infiltrating lymphocytes with outcomes in breast cancer. NPJ Breast Cancer. 2018;4:40. [DOI] [PMC free article] [PubMed] [Google Scholar]
- 26. Apetoh L, Ghiringhelli F, Tesniere A, et al. Toll‐like receptor 4‐dependent contribution of the immune system to anticancer chemotherapy and radiotherapy. Nat Med. 2007;13:1050‐1059. [DOI] [PubMed] [Google Scholar]
- 27. Cytlak UM, Dyer DP, Honeychurch J, Williams KJ, Travis MA, Illidge TM. Immunomodulation by radiotherapy in tumour control and normal tissue toxicity. Nat Rev Immunol. 2022;22(2):124‐138. [DOI] [PubMed] [Google Scholar]
Associated Data
This section collects any data citations, data availability statements, or supplementary materials included in this article.
Supplementary Materials
Fig S1‐S6
Table S1‐S2