

Abstract
Objective: To investigate the diagnostic value of fibrinogen (Fib) combined with thromboelastogram (TEG) in postpartum hemorrhage (PPH) after vaginal delivery. Methods: A total of 120 women who underwent vaginal delivery in our hospital were divided into a PPH group (n=50) and a non-PPH group (n=70). The reaction time (R), clotting time (K), Fib, and D-dimer (D-D) levels were compared between the two groups. Patients in the PPH group were sub-divided into a mild hemorrhage group (n=28) and a severe hemorrhage group (n=22). The receiver operator characteristic curves of R, K, Fib, and D-D for predicting PPH were plotted respectively. Results: The levels of R, K, and D-D in the PPH group were significantly higher than those in the non-PPH group. The Fib level was significantly lower than that in the non-PPH group (P<0.05). The severe hemorrhage group had significantly higher maternal R, K, and D-D levels and a significantly lower Fib level than the mild hemorrhage group (P<0.05). Correlation analysis showed that Fib was negatively correlated with R and K, and the D-D was positively correlated with R and K (P<0.05). The area under the curves of R, K, Fib, and D-D were 0.9690, 0.9917, 0.8512, and 0.8771, respectively (P<0.05). Conclusion: Fib and TEG have good diagnostic values for PPH in women who underwent vaginal delivery, and can better predict PPH, providing evidence for clinical prevention and treatment of PPH.
Keywords: Fibrinogen, thromboelastogram, vaginal delivery, postpartum hemorrhage
Introduction
Postpartum hemorrhage (PPH) is defined as a bleeding loss of more than 500 mL within 24 h after delivery [1]. About 80% of PPH occurs within 2 h after delivery. Some patients have bleeding within 24 h after delivery, known as late PPH [2]. PPH is one of the serious complications during delivery and the main cause of maternal death. Research data show that 120,000 cases of maternal deaths caused by PPH occur every year, accounting for about 25% of maternal deaths worldwide. It is the second leading cause of maternal mortality in the UK [3,4]. It has been reported that the incidence of PPH in China is about 2%-3%. The incidence of PPH has been steadily increasing, from 2.5% in 1993 to 4.5% in 2014 [5]. Studies have found that PPH can induce hemorrhagic shock, respiratory distress syndrome, coagulation dysfunction, hysterectomy, and other complications, threatening maternal health [6,7].
In 2012, the World Health Organization (WHO) issued new guidelines for the prevention and treatment of PPH. It emphasizes active management during the third stage of delivery, including the administration of contractions immediately after delivery and early umbilical clamping. Clinical studies have shown that tranexamic acid also has a good hemostatic effect [8,9]. Regardless of the previous clinical studies on PPH, the WHO still recommends assessing risk factors for effective prevention and management of PPH. The effective rate of risk factor assessment tools of clinical postpartum was 60%-85% in identifying PPH [10]. A retrospective cohort study found that although the assessment tool could identify approximately 80% or more patients with severe bleeding, 40% of patients without PPH were still classified as high risk, confirming that the predictive specificity of the tool was only 60% for PPH [11].
Thromboelastography (TEG) is an analyzer that can dynamically monitor maternal coagulation and better reflect its dynamic changes. It has the advantages of dynamic, continuous, and accuracy compared with the traditional coagulation and fibrinolytic indicators [12,13]. A study of women who delivered vaginally showed that TEG can provide a comprehensive picture of the maternal coagulation state, guide the treatment of massive transfusion in women with PPH, and help improve clinical prognosis [14]. The purpose of this study was to investigate the predictive value of fibrinogen (Fib) combined with TEG for PPH in women who underwent vaginal delivery, providing a clinical reference for improving maternal prognosis of parturient women with vaginal delivery.
Materials and methods
Baseline data
A total of 120 parturient women who delivered vaginally from September 2018 to September 2020 in our hospital were divided into a PPH group (n=50) and a non-PPH group (n=70).
Inclusion criteria: (1) all women in the PPH group who met the diagnostic criteria for PPH [15] and presented with relevant clinical symptoms; (2) parturient women with 37-42 weeks of gestation; (3) parturient women with an age of 20-40 years old; (4) parturient women with singleton pregnancy; (5) parturient women with complete clinical data; and (6) parturient women with no fetal abnormalities in prenatal examination.
Exclusion criteria: (1) parturient women who had taken drugs that may affect anticoagulation 7 d prior to the study; (2) parturient women with congenital coagulation disorders; (3) parturient women with concomitant hepatic and renal dysfunction; (4) parturient women with concomitant gestational hypertension and gestational diabetes mellitus; (5) parturient women with deep vein thrombosis during hospitalization after delivery; (6) parturient women with concomitant infectious diseases; (7) parturient women with placenta praevia or anemia; (8) parturient women complicated with eclampsia or gestational hypertension; and (9) parturient women with PPH caused by uterine contraction fatigue, retention of placental membrane in uterine cavity, and injury of soft birth canal.
The study was approved by the Ethics Committee of Huzhou Central Hospital, Affiliated Hospital of Huzhou University (Approval No. NCT01532856). Patients signed an informed consent form prior to participating in the study.
Methods
Fasting blood samples were collected from the two groups of women in the morning. Plasma was obtained by centrifugation (3000 r/min, 5 min) for coagulation and TEG testing. The levels of Fib and D-dimer (D-D) were measured by CS-5100 fully automatic hemagglutination analyzer (Hyson Comet). The reaction time (R) and clotting time (K) were measured by LEPV-8800 thromboelastograph.
Outcome measurement
Differences in maternal coagulation and TEG indices
The levels of R, K, Fib, and D-D were measured in both PPH (a bleeding loss of ≥500 mL within 24 h after delivery) and non-PPH groups. The PPH group was sub-divided into a severe hemorrhage group (n=22, bleeding loss of ≥1000 mL within 24 h after delivery) and a mild hemorrhage group (n=28, bleeding loss of 500-1000 mL within 24 h after delivery).
Diagnostic value of coagulation indices and TEG indices
The area under the curve (AUC) of the above indicators for predicting PPH was calculated by plotting the diagnostic receiver operator characteristic (ROC) curves of Fib, D-D, R, and K for PPH, respectively.
Statistical methods
SPSS22.0 statistical software [16] was used to analyze the data in the study. The measurement data were expressed as mean ± standard deviation (mean ± SD). T-test was used for data with normal distribution or with even variance, and approximate t-test was applied for data with uneven variance. F-test was used to compare the differences between multiple groups. Chi-square test was used to compare the differences of count data between groups. GraphPad Prism 8 software was used to plot the graphs. P<0.05 indicated significant difference.
Result
Comparison of baseline data
No significant difference was observed in the baseline data including age, gestational week, weight, and number of deliveries between the two groups (P>0.05), suggesting that the two groups were comparable (Table 1).
Table 1.
Comparison of baseline data (mean ± SD)
| Clinical information | PPH group (n=50) | Non-PPH group (n=70) | t | P |
|---|---|---|---|---|
| Mean age (years old) | 29.98±2.32 | 30.11±2.21 | 0.311 | 0.756 |
| Mean gestational weeks (weeks) | 39.31±2.01 | 39.23±1.98 | 0.217 | 0.829 |
| Average number of births (times) | 1.28±0.32 | 1.29±0.31 | 0.172 | 0.864 |
| Average weight (kg) | 78.19±4.33 | 78.21±4.29 | 0.025 | 0.98 |
Comparison of maternal coagulation indicators and TEG indicators between PPH and non-PPH groups
The levels of R, K, and D-D in the PPH group were significantly higher than those in the non-PPH group. The Fib level was significantly lower than that in the non-PPH group (P<0.05) (Figure 1).
Figure 1.
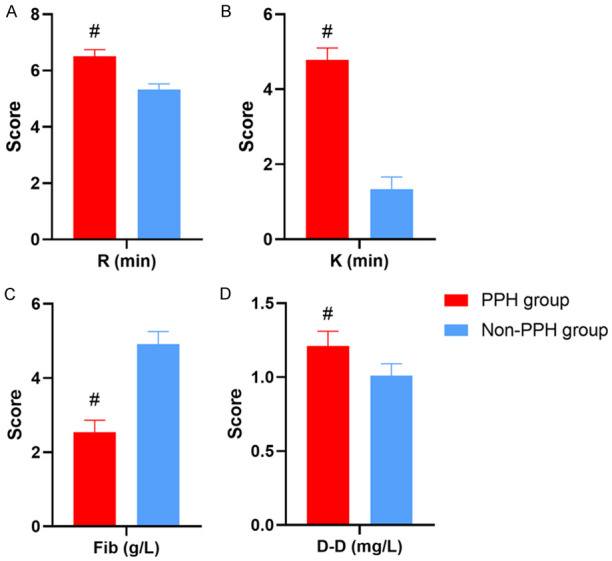
Comparison of maternal coagulation indicators and TEG indicators between PPH and non-PPH groups. A: Reaction time (R); B: Clotting time (K); C: Fibrinogen (Fib); D: D-dimer (D-D). #Denotes comparison with non-PPH group, P<0.05.
Comparison of maternal coagulation indicators and TEG indicators between severe hemorrhage and mild hemorrhage groups
In women with PPH, the levels of R, K, and D-D in the severe hemorrhage group were significantly higher than those in the mild hemorrhage group. The Fib level was significantly lower than that in the mild hemorrhage group (P<0.05) (Figure 2).
Figure 2.
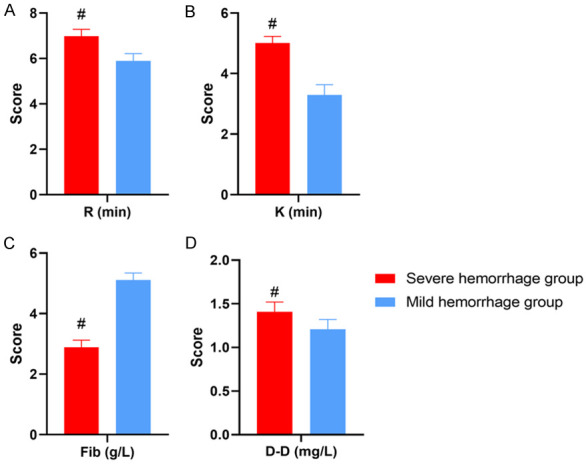
Comparison of coagulation indicators and TEG indicators between severe and mild hemorrhage groups. A: Reaction time (R); B: Clotting time (K); C: Fibrinogen (Fib); D: D-dimer (D-D). #Denotes comparison with mild hemorrhage group, P<0.05.
Correlation between maternal coagulation indicators and TEG indicators in PPH
Fib was negatively correlated with R (r=-0.9377, P<0.0001) and K (r=-0.9429, P<0.0001). D-D was positively correlated with R (r=0.9605, P<0.0001) and K (r=0.9663, P<0.0001). This suggested a significant correlation between the maternal coagulation indicators and TEG indicators (Table 2; Figure 3).
Table 2.
Correlation between routine coagulation indicators and TEG indicators in women with PPH
| Indices | r | P | R2 | 95% CI |
|---|---|---|---|---|
| Fib and R | -0.9377 | <0.0001 | 0.8794 | -0.9742 to -0.8536 |
| Fib and K | -0.9429 | <0.0001 | 0.8891 | -0.9764 to -0.8653 |
| D-D and R | 0.9605 | <0.0001 | 0.9225 | 0.9056 to 0.9837 |
| D-D and K | 0.9663 | <0.0001 | 0.9338 | 0.9192 to 0.9862 |
Figure 3.
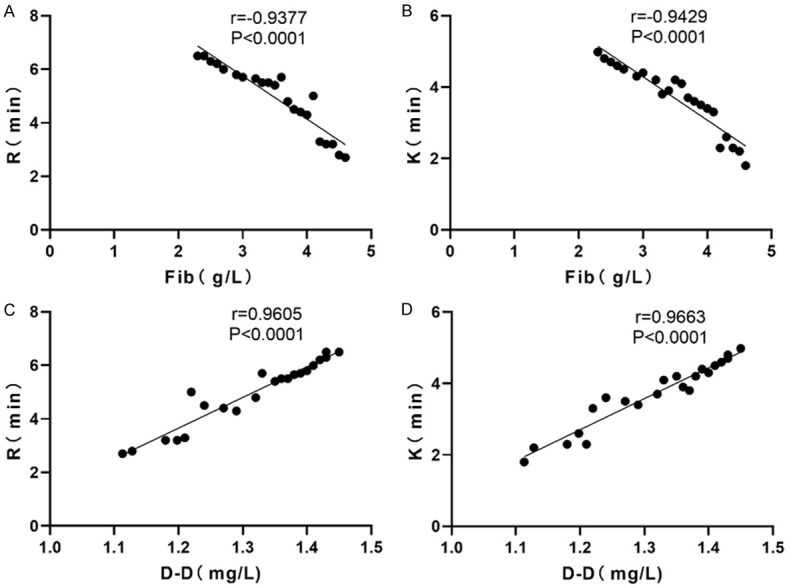
Correlation analysis of PPH maternal coagulation indicators with TEG indicators. A and B: Fib was negatively correlated with R (r=-0.9377, P<0.0001) and K (r=-0.9429, P<0.0001); C and D: D-D was positively correlated with R (r=0.9605, P<0.0001) and K (r=0.9663, P<0.0001).
The predictive value of coagulation indicators and TEG indicators for PPH
It was found that the diagnostic AUC of Fib, D-D, R, and K for PPH was 0.8512 (95% CI 0.7337-0.9688, P<0.0001), 0.8771 (95% CI 0.7798-0.9744, P<0.0001), 0.9690 (95% CI 0.9270-1.000, P<0.0001), and 0.9917 (95% CI 0.9729-1.000, P<0.0001), respectively (Table 3; Figure 4).
Table 3.
The predictive value of routine coagulation indicators versus TEG indicators for PPH
| Variables | AUC | Standard error | P | 95% CI |
|---|---|---|---|---|
| Fib | 0.8512 | 0.05998 | <0.0001 | 0.7337-0.9688 |
| D-D | 0.8771 | 0.04964 | <0.0001 | 0.7798-0.9744 |
| R | 0.9690 | 0.02144 | <0.0001 | 0.9270-1.000 |
| K | 0.9917 | 0.009618 | <0.001 | 0.9729-1.000 |
Figure 4.
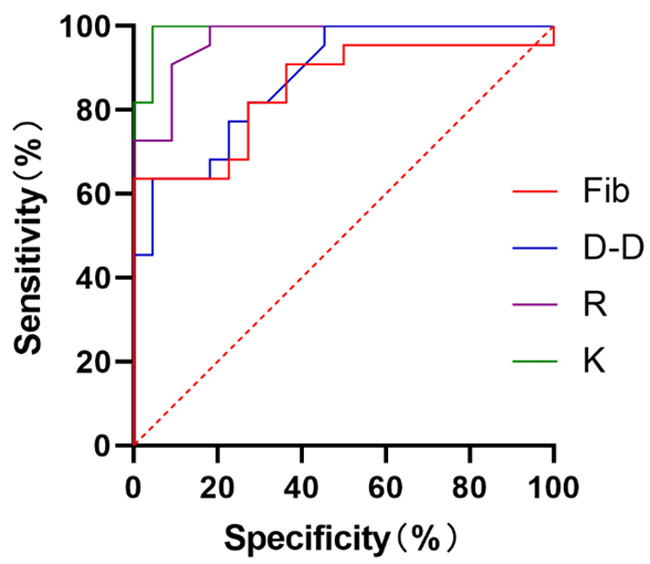
Analysis of the predictive value of routine coagulation and TEG indicators for PPH. The analysis showed that the diagnostic AUC of Fib for PPH was 0.8512 (95% CI 0.7337-0.9688, P<0.0001), the diagnostic AUC of D-D for PPH was 0.8771 (95% CI 0.7798-0.9744, P<0.0001), the diagnostic AUC of R for PPH was 0.9690 (95% CI 0.9270-1.000, P<0.0001), and the diagnostic AUC of K for PPH was 0.9917 (95% CI 0.9729-1.000, P<0.0001).
Discussion
With the opening of the two-child policy in China, a large number of women with an advanced age and those with a history of cesarean delivery choose to give birth again, bringing new challenges to obstetricians and nurses [17]. PPH is a relatively common clinical condition during delivery and one of the main causes of maternal death. PPH accounts for about 25% of all maternal deaths. Data show that the incidence of PPH is about 2%-3% of the total number of deliveries in China [18,19]. PPH is one of the more serious complications during childbirth and may lead to shock, acute renal failure, loss of fertility, and pituitary necrosis. Early assessment of PPH is recommended to improve maternal prognosis [20].
In this study, parturient women were divided into a PPH group and a non-PPH group to analyze the role of Fib combined with TEG in the assessing of PPH in women who delivered vaginally. The levels of K and D-D were significantly higher. Fib was significantly lower in the PPH group compared with the non-PPH group. A study [21] of TEG in women who underwent massive transfusion for PPH has shown that women with PPH are often in a hypocoagulable state. TEG indicators can be used as indices to guide massive blood transfusions to improve the efficiency of transfusion. The values of R and K in TEG were significantly reduced after adjusting the transfusion protocol according to TEG parameters. This indicated a significant improvement in maternal coagulation function. In the above-mentioned study, all 47 women included were successfully rescued with transfusion therapy, suggesting that TEG has a good reflection of the maternal coagulation state. Another research of 200 women who delivered vaginally showed that the D-D levels in the group with PPH were significantly higher than those in the group without PPH. The scholars plotted the ROC curve of D-D, PT, and TT for predicting PPH and found that the D-D, PT, and TT had good predictive values for PPH [22], which is similar to the results of this study.
We speculated that Fib and D-D are both commonly used coagulation indicators. D-D, PT, and TT have certain predictive values for PPH. Routine coagulation indicators such as Fib and D-D are closely related to maternal physiological states. When the maternal coagulation or anticoagulation system is abnormal, the coagulation function indicators also fluctuate. This greatly reduces the predictive accuracy of Fib and D-D [23]. The TEG provides an overall picture of coagulation, fibrinolysis, and platelet function of the patients. Compared with the traditional coagulation indicator, we believe that TEG has the following advantages: (1) TEG can reflect the process of the blood sample from clot formation to fibrinolysis, which is more comprehensive; (2) indicators such as R and K can reflect the interaction between coagulation factors and platelets, reflecting the coagulation state of the mother; (3) TEG can be obtained more quickly than conventional coagulation indicators, facilitating the rapid development of clinical regimes; (4) TEG can be carried out at the bedside, facilitating the guidance of medical staff at any time and improving work efficiency [24].
This study compared the predictive value of common coagulation indicators such as Fib and D-D with TEG-related indicators for PPH. The results showed that the predictive values of R and K for PPH were significantly higher than those of Fib and D-D, suggesting that TEG had a higher predictive value for PPH. It was found that the diagnostic sensitivity and specificity of Fib for PPH were lower than those of TEG-related indicators. In the previous study, the advantages and disadvantages of Fib and TEG in the identification of PPH were compared. The results showed that the sensitivity and specificity of Fib in the diagnosis of PPH were lower than those of TEG-related indicators. The researchers believed that Fib plays an intermediary role in the maternal coagulation process and can reflect the maternal coagulation state more comprehensively than PLT and Hb. Fib is affected by some unknown factors. They suggested that other indicators should be combined with Fib in the prediction of PPH to avoid misdiagnosis [25]. We believe that TEG is a comprehensive reflection of the maternal coagulation and fibrinolytic processes, providing an assessment of fibrin clot formation, lysis, stability, and elasticity, which is more systematic and comprehensive than traditional coagulation indicators [26].
In conclusion, Fib and TEG have good diagnostic values for PPH in women who underwent vaginal delivery, which is worthy of clinical application. This study has certain limitations. Only patients treated in the hospital were included in the study. Due to the single source and relatively concentrated time, the sample size may be small, which may affect the accuracy of the study results. This should be improved in a multi-center study with a larger sample size in the next step.
Disclosure of conflict of interest
None.
References
- 1.Andrikopoulou M, D’Alton ME. Postpartum hemorrhage: early identification challenges. Semin Perinatol. 2019;43:11–17. doi: 10.1053/j.semperi.2018.11.003. [DOI] [PubMed] [Google Scholar]
- 2.Evensen A, Anderson JM, Fontaine P. Postpartum hemorrhage: prevention and treatment. Am Fam Physician. 2017;95:442–449. [PubMed] [Google Scholar]
- 3.Newsome J, Martin JG, Bercu Z, Shah J, Shekhani H, Peters G. Postpartum hemorrhage. Tech Vasc Interv Radiol. 2017;20:266–273. doi: 10.1053/j.tvir.2017.10.007. [DOI] [PubMed] [Google Scholar]
- 4.Higgins N, Patel SK, Toledo P. Postpartum hemorrhage revisited: new challenges and solutions. Curr Opin Anaesthesiol. 2019;32:278–284. doi: 10.1097/ACO.0000000000000717. [DOI] [PubMed] [Google Scholar]
- 5.Ring L, Landau R. Postpartum hemorrhage: anesthesia management. Semin Perinatol. 2019;43:35–43. doi: 10.1053/j.semperi.2018.11.007. [DOI] [PubMed] [Google Scholar]
- 6.Dahlke JD, Bhalwal A, Chauhan SP. Obstetric emergencies: shoulder dystocia and postpartum hemorrhage. Obstet Gynecol Clin North Am. 2017;44:231–243. doi: 10.1016/j.ogc.2017.02.003. [DOI] [PubMed] [Google Scholar]
- 7.Phillips JM, van den Anker JN, Ahmadzia HK. Next generation medical management of postpartum hemorrhage. Curr Pharm Des. 2019;25:549–555. doi: 10.2174/1381612825666190320155337. [DOI] [PubMed] [Google Scholar]
- 8.Jackson DL, DeLoughery TG. Postpartum hemorrhage: management of massive transfusion. Obstet Gynecol Surv. 2018;73:418–422. doi: 10.1097/OGX.0000000000000582. [DOI] [PubMed] [Google Scholar]
- 9.Borovac-Pinheiro A, Pacagnella RC, Cecatti JG, Miller S, El Ayadi AM, Souza JP, Durocher J, Blumenthal PD, Winikoff B. Postpartum hemorrhage: new insights for definition and diagnosis. Am J Obstet Gynecol. 2018;219:162–168. doi: 10.1016/j.ajog.2018.04.013. [DOI] [PubMed] [Google Scholar]
- 10.Pacheco LD, Saade GR, Hankins GDV. Medical management of postpartum hemorrhage: an update. Semin Perinatol. 2019;43:22–26. doi: 10.1053/j.semperi.2018.11.005. [DOI] [PubMed] [Google Scholar]
- 11.Watkins EJ, Stem K. Postpartum hemorrhage. JAAPA. 2020;33:29–33. doi: 10.1097/01.JAA.0000657164.11635.93. [DOI] [PubMed] [Google Scholar]
- 12.Ononge S, Mirembe F, Wandabwa J, Campbell OM. Incidence and risk factors for postpartum hemorrhage in Uganda. Reprod Health. 2016;13:38. doi: 10.1186/s12978-016-0154-8. [DOI] [PMC free article] [PubMed] [Google Scholar]
- 13.Aoki M, Tokue H, Miyazaki M, Shibuya K, Hirasawa S, Oshima K. Primary postpartum hemorrhage: outcome of uterine artery embolization. Br J Radiol. 2018;91:20180132. doi: 10.1259/bjr.20180132. [DOI] [PMC free article] [PubMed] [Google Scholar]
- 14.Feduniw S, Warzecha D, Szymusik I, Wielgos M. Epidemiology, prevention and management of early postpartum hemorrhage-a systematic review. Ginekol Pol. 2020;91:38–44. doi: 10.5603/GP.2020.0009. [DOI] [PubMed] [Google Scholar]
- 15.Suarez S, Conde-Agudelo A, Borovac-Pinheiro A, Suarez-Rebling D, Eckardt M, Theron G, Burke TF. Uterine balloon tamponade for the treatment of postpartum hemorrhage: a systematic review and meta-analysis. Am J Obstet Gynecol. 2020;222:293.e1–293.e52. doi: 10.1016/j.ajog.2019.11.1287. [DOI] [PubMed] [Google Scholar]
- 16.Sentilhes L, Merlot B, Madar H, Sztark F, Brun S, Deneux-Tharaux C. Postpartum haemorrhage: prevention and treatment. Expert Rev Hematol. 2016;9:1043–1061. doi: 10.1080/17474086.2016.1245135. [DOI] [PubMed] [Google Scholar]
- 17.Saccone G, Caissutti C, Ciardulli A, Berghella V. Uterine massage for preventing postpartum hemorrhage at cesarean delivery: which evidence? Eur J Obstet Gynecol Reprod Biol. 2018;223:64–67. doi: 10.1016/j.ejogrb.2018.02.023. [DOI] [PubMed] [Google Scholar]
- 18.Kawakita T, Mokhtari N, Huang JC, Landy HJ. Evaluation of risk-assessment tools for severe postpartum hemorrhage in women undergoing cesarean delivery. Obstet Gynecol. 2019;134:1308–1316. doi: 10.1097/AOG.0000000000003574. [DOI] [PubMed] [Google Scholar]
- 19.Goffman D, Nathan L, Chazotte C. Obstetric hemorrhage: a global review. Semin Perinatol. 2016;40:96–98. doi: 10.1053/j.semperi.2015.11.014. [DOI] [PubMed] [Google Scholar]
- 20.Anger H, Durocher J, Dabash R, Winikoff B. How well do postpartum blood loss and common definitions of postpartum hemorrhage correlate with postpartum anemia and fall in hemoglobin? PLoS One. 2019;14:e0221216. doi: 10.1371/journal.pone.0221216. [DOI] [PMC free article] [PubMed] [Google Scholar]
- 21.Voon HY, Suharjono HN, Shafie AA, Bujang MA. Carbetocin versus oxytocin for the prevention of postpartum hemorrhage: a meta-analysis of randomized controlled trials in cesarean deliveries. Taiwan J Obstet Gynecol. 2018;57:332–339. doi: 10.1016/j.tjog.2018.04.002. [DOI] [PubMed] [Google Scholar]
- 22.Ahmadzia HK, Phillips JM, Katler QS, James AH. Tranexamic acid for prevention and treatment of postpartum hemorrhage: an update on management and clinical outcomes. Obstet Gynecol Surv. 2018;73:587–594. doi: 10.1097/OGX.0000000000000597. [DOI] [PubMed] [Google Scholar]
- 23.Durmaz A, Komurcu N. Relationship between maternal characteristics and postpartum hemorrhage: a meta-analysis study. J Nurs Res. 2018;26:362–372. doi: 10.1097/jnr.0000000000000245. [DOI] [PubMed] [Google Scholar]
- 24.Quantitative blood loss in obstetric hemorrhage: ACOG COMMITTEE OPINION, number 794. Obstet Gynecol. 2019;134:e150–e156. doi: 10.1097/AOG.0000000000003564. [DOI] [PubMed] [Google Scholar]
- 25.Scheich B. Implementation and outcomes of the AWHONN postpartum hemorrhage project. J Obstet Gynecol Neonatal Nurs. 2018;47:684–687. doi: 10.1016/j.jogn.2018.06.003. [DOI] [PubMed] [Google Scholar]
- 26.Edwards HM. Aetiology and treatment of severe postpartum haemorrhage. Dan Med J. 2018;65:B5444. [PubMed] [Google Scholar]