Abstract
Objectiove: The tripartite motif (TRIM) family genes, which encode a protein subfamily of the RING type E3 ubiquitin ligases, function as important regulators of oncogenesis and development. It is thus of great importance to investigate the potential value of the TRIM family genes for prognostic prediction in glioma. Methods: The gene expression RNA-Seq data and corresponding clinical information of glioma patients were obtained from The Cancer Genome Atlas (TCGA) dataset and the Chinese Glioma Genome Atlas (CGGA) dataset. LASSO regression and multivariate Cox regression analyses were performed to construct a risk signature of the TRIM family genes. The accuracy of the risk signature in predicting the prognosis of glioma patients was evaluated. The effects of TRIM17 on glioma cell proliferation were further explored. Results: We constructed a prognostic signature based on eight TRIMs for the prediction of overall survival of glioma patients. Internal and external cohorts confirmed the satisfactory accuracy and generalizability of the signature in predicting the prognosis of glioma patients. Of the eight TRIMs, TRIM17 was significantly downregulated in glioma, and decreased with an increase in the tumor grade. Moreover, low expression of TRIM17 predicted poor prognosis in glioma. CCK-8 and colony formation assays indicated that TRIM17 overexpression significantly inhibited cell proliferation. Conversely, silencing of TRIM17 had the opposite effects. Conclusion: Our eight-gene signature based on the TRIM gene family is a novel and clinically useful biomarker, which may be helpful for clinical decision-making. Additionally, TRIM17 might be a therapeutic target for glioma.
Keywords: Tripartite motif family, prognosis, signature, TRIM17, proliferation, glioma
Introduction
Glioma is an intracranial malignant tumor that accounts for 50-60% of the primary tumors occurring in the central nervous system [1,2]. It is a highly heterogeneous disease, which is characterized by rapid cell proliferation and diffuse infiltration [3]. Histologically, glioma can be subdivided into astrocytoma, glioblastoma multiform (GBM), oligodendroglioma, and mixed tumor, of which GBM is the most malignant type with the worst prognosis [4]. The standard treatment for glioma includes surgery resection, radiotherapy, and chemotherapy [5]. Despite the great advances in the treatment of glioma, the prognosis is still poor, especially for patients with high grade glioma [6]. Resistance to conventional therapy and recrudescence often occur, which lead to high mortality in glioma patients [7]. Precise prediction of the prognosis of glioma is of great importance for clinical decision-making, but still unachievable. Up to now, molecular markers, including isocitrate dehydrogenase 1 (IDH1) mutation, O6-methylguanine-DNA methyltransferase methylation, and 1p/19q codeletion have been utilized for molecular pathological analysis [8-10], but they are insufficient for the precise prediction of prognosis. Exploring novel therapeutic targets and prognostic markers for gliomas is urgently required.
The tripartite motif (TRIM) family of genes encodes a protein subfamily of the RING type E3 ubiquitin ligases that participate in the process of ubiquitylation, one of the most common post-translational modifications of proteins [11]. Structurally, TRIM proteins possess a distinctive motif composed of a RING-finger domain, one or two zinc-binding motifs, B-boxes region, and a coiled-coil region [12]. On the basis of their domain structure, TRIMs can be divided into subfamilies I to XI. Functionally, TRIMs play critical roles in the dynamic regulation of short-lived proteins, including those that contribute to cell proliferation, cell cycle, apoptosis, and differentiation [13,14]. Undoubtedly, TRIMs are involved in the regulation of oncoproteins and tumor suppressor proteins; thus, they are related to the occurrence and development of malignant tumors. For example, the stability of the p53 protein, a well-documented tumor suppressor, can be regulated by TRIM13, TRIM19, and TRIM29 [15-18]. In glioma, some TRIMs such as TRIM22, TRIM14, and TRIM45 have been reported to regulate cell proliferation, invasion, and metastasis though diverse mechanisms [19-21]. Thus, it is reasonable to speculate that the TRIM gene family might be an important target for glioma diagnosis, treatment, and prognosis.
In the present study, we conducted a comprehensive analysis of TRIM family genes in glioma patients, and constructed a risk signature based on eight TRIMs for predicting the prognosis of patients with glioma. Of the eight TRIMs, TRIM17 was downregulated in glioma tissue samples, and decreased with an increase in the tumor grade. Besides, we found that lower expression of TRIM17 predicted poor prognosis in glioma patients in four independent cohorts. Further, the effects of TRIM17 on glioma cell proliferation were explored.
Material and methods
Data collection
The gene expression RNA-Seq (HTSeq-FPKM) data and corresponding clinical information of glioma patients were obtained from The Cancer Genome Atlas (TCGA) dataset (https://portal.gdc.cancer.gov/) and the Chinese Glioma Genome Atlas (CGGA) dataset (http://www.cgga.org.cn/). Patients with missing overall survival value or a follow-up equal to 0 day were excluded. Finally, a total of 1635 samples were enrolled in the present study, in which 665 samples were extracted from TCGA dataset, 313 samples were extracted from CGGA325 dataset, and 657 samples were extracted from CGGA693 dataset.
TRIM family genes
A total of 84 TRIM family genes were identified according to a previous study [11] and the human gene database (https://www.genecards.org/). To identify prognosis-related TRIMs, univariate Cox regression analysis and Kaplan-Meier survival analysis were conducted. Genes with P-values less than 0.05 in both analyses were regarded as robust prognostic TRIMs.
Construction and validation of a risk signature based on TRIMs
The TCGA glioma cohort (entire cohort) was randomly divided into a training cohort and a testing cohort at a ratio of approximately 1:1. In the training cohort, TRIMs were enrolled into the least absolute shrinkage and selection operator (LASSO) analysis by using “glmnet” package in R. Then, step wise multivariate Cox regression analysis was performed and we finally developed a prognostic signature for glioma patients involving eight TRIMs. Risk score of patients in training cohort, testing cohort, entire cohort, and external validation cohort (CGGA325 and CGGA693) was calculated using the following formula: Risk score = ∑i n Expi coei (Exp = expression level of TRIMs; Coe = regression coefficient). The patients in all the cohorts were divided into high- and low-risk groups. Kaplan-Meier survival analyses were performed to compare the overall survival between the two groups. Time-dependent ROC curve analyses were conducted using the “survivalROC” package in R to evaluate the specificity and sensitivity of the risk signature in predicting the prognosis of glioma patients.
Cell culture and transfection
The human U251 and U87 glioma cell lines were obtained from the Cell Bank Type Culture Collection of the Chinese Academy of Sciences (Shanghai, China). Cells were maintained in Dulbecco’s modified Eagle’s medium (DMEM) supplemented with 10% FBS (Gibco, Invitrogen, Carlsbad, CA, USA) at 37°C in 5% CO2 humidified atmosphere. For siRNA transfection, siRNA specifically targeting TRIM17 and negative control siRNA (siNeg) were purchased from GeneChem Technologies (Shanghai, China) and transfected into U251 and U87 cells using the Lipofectamine RNAiMAX reagents (Invitrogen, Thermo Fisher Scientific, Inc.). For plasmid transfection, pcDNA3.1-TRIM17-flag plasmid and empty vector plasmid (Shanghai GeneChem Co., Ltd.) were transfected into U251 and U87 cells using the Lipofectamine 2000 reagents (Invitrogen, Thermo Fisher Scientific, Inc.) according to the protocol. The transfection efficiency was confirmed 48 h after transfection by qRT-PCR.
Patients sample
Glioma tissues and non-tumor brain tissues were obtained in the Department of Neurosurgery, Renmin Hospital of Wuhan University, Wuhan, China. They were collected between January 2018 and March 2020 with the informed consent from the patients. Samples were frozen immediately after surgery resection and stored at -80°C. All the procedures were approved by the Institutional Ethics Committee of the Renmin Hospital of Wuhan University.
CCK-8 and colony formation assay
U251 and U87 cells transfected with siRNA or plasmid were resuspended using the complete medium. For CCK-8 assay, cells were then seeded in 96-well plates at a density of 5000/well. CCK-8 reagent (Beyotime, Shanghai, China) was added into plate at indicated time (0, 24, 48, and 72 h) and further incubated for 1 h at 37°C. The absorbance of each well at 450 nm was measured using a microplate reader (Bio-Rad Laboratories, Inc.). For colony formation assay, cells were seeded in 6-well plates at a density of 500/well and cultured for 10 days. Cell colonies were fixed with 4% paraformaldehyde and stained using 1% crystal violet. The number of colonies in every well was counted.
RNA isolation and qRT-PCR
Briefly, total RNA was extracted using TRIzol reagent (Invitrogen, Carlsbad, CA, USA) and was then used to synthesize cDNA using the cDNA Reverse Transcription kit (Thermo Fisher Scientific). Quantitative real-time PCR was performed using the SYBR Green Mix (BD, USA). The relative gene expression was calculated by 2-ΔΔCt method and GAPDH was used for normalization. The primer sequences were listed as follow: TRIM17: forward, 5’-TGAAGCTGGAGGAGGACATG-3’, reverse, 5’-TCTTCTTCCGTCTCCAGAGC-3’; GAPDH: forward, 5’-TCGTGGAAGGACTCATGAC-C-3’, reverse, 5’-CCTGCTTCACCACCTTCTTG-3’.
Statistical analysis
All the statistical analyses were conducted using R software (version 4.1.0) and GraphPad Prism 8.0. The results were presented as means ± standard deviations (SD). Unpaired student’s t-test or one-way analysis of variance (ANOVA) was used to compare differences between two or more groups. Kaplan-Meier curve and the log-rank test were performed to compare differences in overall survival between groups. A P-value less than 0.05 was considered statistically significant.
Results
Identification of prognostic TRIM family genes in glioma
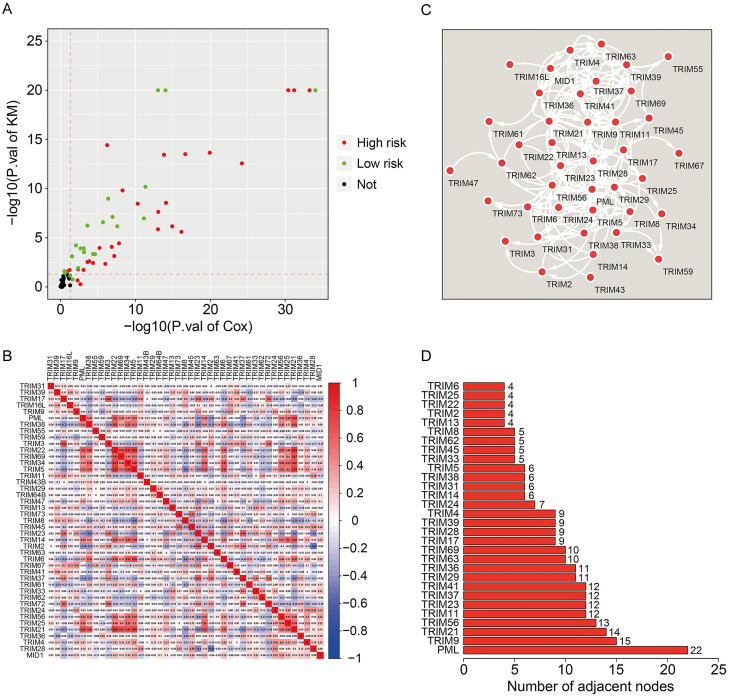
To identify the prognostic TRIMs in glioma, we first conducted univariate Cox regression analysis and Kaplan-Meier survival analysis in TCGA glioma cohort. Genes with P-values less than 0.05 in both the analyses were regarded as robust-prognostic genes. Interestingly, about half (43/83) of TRIM family genes were closely related to the prognosis of glioma patients, suggesting the critical role of TRIM family genes in the development and progression of glioma. Of the 43 prognostic TRIMs in glioma, 25 were risk factors (hazard ratio [HR] >1), while 18 were protective factors (HR<1) (Figure 1A). The correlation of the prognostic TRIMs is shown in Figure 1B. We also constructed a protein-protein interaction (PPI) network using the prognostic TRIMs (Figure 1C). Furthermore, hub gene analysis revealed that PML, TRIM9, and TRIM21 were the top three ranked genes in the PPI network (Figure 1D).
Figure 1.
Identification of prognostic TRIM family genes in glioma and construction of a protein-protein interaction network. A. Robust prognostic TRIM family genes. B. The correlation heatmap of the prognostic TRIM family genes. C. Protein-protein interaction network of the prognostic TRIM family genes. D. The number of adjacent nodes in the PPI-network.
Construction of a risk signature based on TRIM family genes in glioma
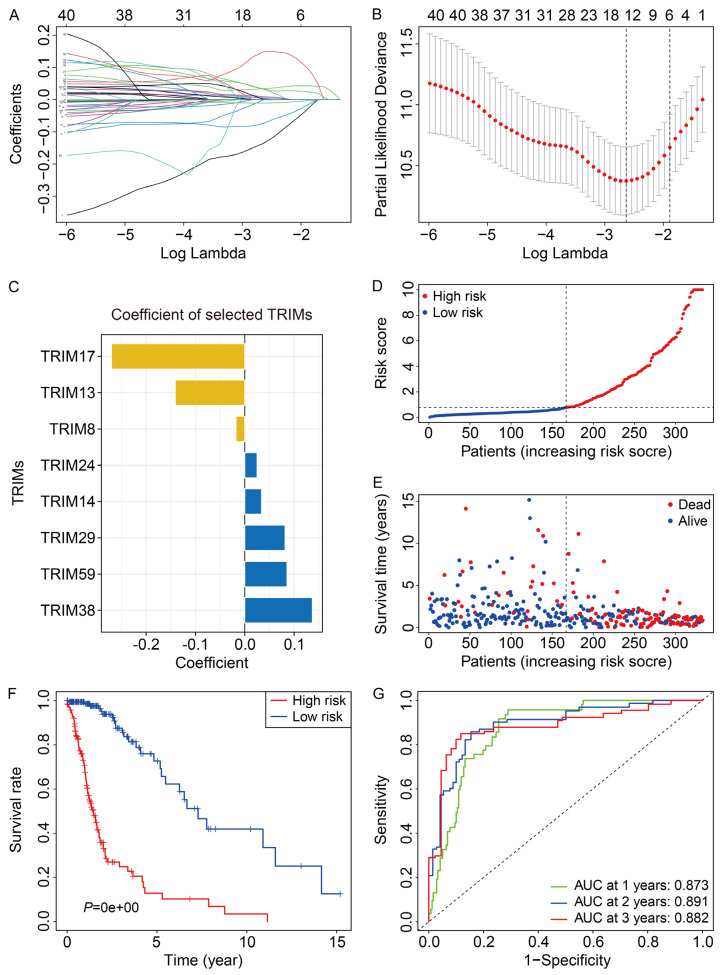
To construct a risk signature based on the TRIM family genes, we first randomly divided TCGA glioma cohort into a training cohort and a testing cohort in a ratio of approximately 1:1. Then, univariate Cox regression analysis was performed to screen out the prognosis-related TRIMs in the training cohort. Subsequently, Lasso regression analysis followed by step wise multivariate Cox regression analysis were performed to construct an eight-gene prognostic signature for glioma (Figure 2A, 2B). The eight genes included TRIM17, TRIM13, TRIM8, TRIM24, TRIM14, TRIM29, TRIM59, and TRIM38, and their coefficients are displayed in Figure 2C. The risk score of the patients was calculated as follows: risk score = TRIM17 × (-0.2702) + TRIM13 × (-0.1409) + TRIM8 × (-0.0178) + TRIM24 × 0.0249 + TRIM14 × 0.0340 + TRIM29 × 0.0817 + TRIM59 × 0.0856 + TRIM38 × 0.1370. The distribution of the risk scores is shown in Figure 2D. The patients were stratified into high- and low-risk groups according to the median value of the risk scores. The survival time and survival status are shown in Figure 2E. The results suggested that the patients in the high-risk group tended to have a higher mortality rate and shorter overall survival. Kaplan-Meier survival analysis demonstrated that the prognosis of glioma patients in the high-risk group was worse than those in the low-risk group (Figure 2F). The area under the curve (AUC) values of the time-dependent receiver operating characteristic (ROC) analysis were 0.873, 0.891, and 0.882 for 1-year, 2-year, and 3-year survival, respectively (Figure 2G). The results indicated that the risk signature based on the eight TRIMs could accurately predict the overall survival of glioma patients.
Figure 2.
Construction of an eight-TRIM gene signature in TCGA training cohort. A, B. Lasso regression analysis and multivariate Cox regression analysis were applied to establish the gene signature. C. Coefficients of the selected eight TRIMs. D. The risk score distribution of patients in training cohort. E. The survival status and overall survival time of patients in training cohort. F. Kaplan-Meier survival analysis suggested that the patients in high-risk group had worse overall survival than those in low-risk group. G. Time-dependent ROC curves of the gene signature for predicting 1-year, 2-year, and 3-year overall survival in training cohort.
Validation of the eight-TRIM gene signature in internal cohorts
We first evaluated the predictive value of the eight-TRIM gene signature in the internal validation cohorts, including the testing cohort and entire cohort. Using the formula mentioned above, the risk scores of the glioma patients in the testing cohort and entire cohort were calculated. Subsequently, patients were divided into high- and low-risk groups using the median value of the risk score in the training cohort as the cutoff. The risk score distribution of the patients in the testing cohort and entire cohort is exhibited in Figure 3A, 3B. The survival time and survival status of the glioma patients in the two cohorts are shown in Figure 3C, 3D. The results suggested that the patients in the high-risk group had higher mortality than those in the low-risk group. The expression levels of the eight TRIM genes in the high- and low-risk groups are displayed in Figure 3E, 3F. It was observed that the expression of TRIM13, TRIM17, and TRIM8 was lower in the high-risk group compared to the low-risk group, while the expression of TRIM24, TRIM14, TRIM29, TRIM59, and TRIM38 was higher in the high-risk group. Kaplan-Meier survival analysis revealed that the patients in the high-risk group demonstrated poorer survival in both the testing cohort and entire cohort (Figure 3G, 3H). Time-dependent ROC analysis indicated that AUC values of 1-year, 2-year, and 3-year survival in the testing cohort were 0.840, 0.878, and 0.861, respectively (Figure 3I), whereas for the entire cohort, they were 0.860, 0.890, and 0.876, respectively (Figure 3J).
Figure 3.
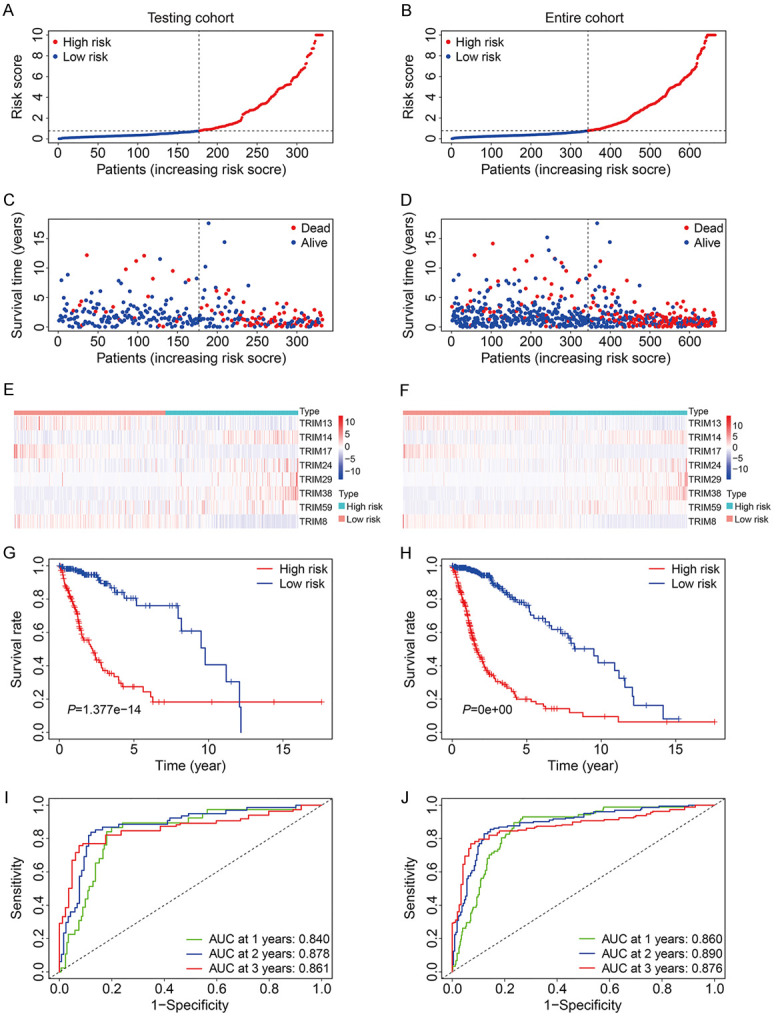
Validation of the eight-TRIM gene signature in TCGA testing and entire cohorts. A, B. The risk score distribution of patients in testing and entire cohorts. C, D. The survival status and overall survival time of patients in testing and entire cohorts. E, F. The expression of the eight TRIM genes in high- and low-risk groups. G, H. Kaplan-Meier survival analysis in testing and entire cohorts suggested that high-risk group had worse overall survival than low-risk group. I, J. Time-dependent ROC curves of the gene signature for predicting 1-year, 2-year, and 3-year overall survival in testing and entire cohorts.
Validation of the eight-TRIM gene signature in external cohort
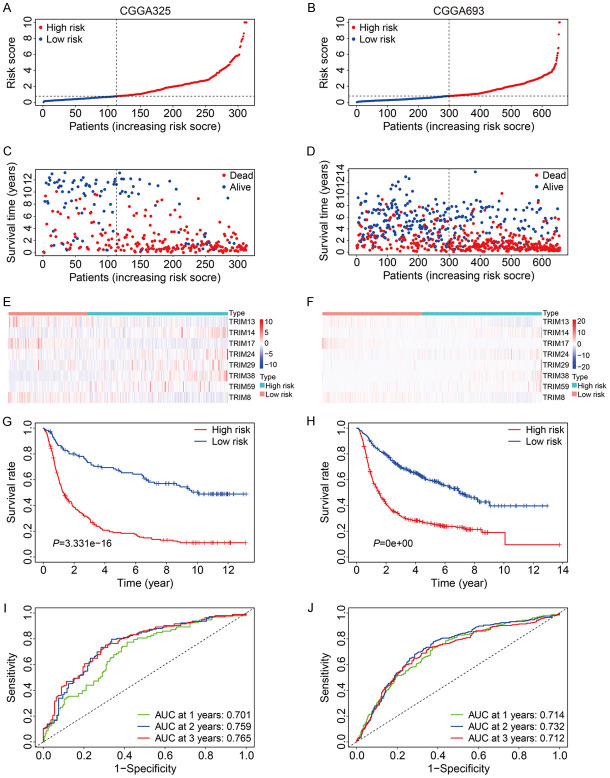
To further validate the satisfactory accuracy and generalizability of the eight-TRIM gene signature, external validation cohorts including CGGA325 and CGGA693 from the Chinese Glioma Genome Atlas (CGGA) database were utilized. As shown in Figure 4A, 4B, the risk scores of the patients in the CGGA325 cohort and CGGA693 cohort were calculated using the formula aforementioned, and the patients were separated into high- and low-risk groups according to the median risk score in the training cohort. The survival time and survival status of the patients in the CGGA325 and CGGA693 cohorts are exhibited in Figure 4C, 4D. The expression levels of the eight TRIM genes were shown in Figure 4E, 4F. Consistent with the expression in TCGA glioma dataset, TRIM13, TRIM17, and TRIM8 expression levels in the CGGA325 and CGGA693 datasets were lower in the high-risk group compared to the low-risk group, while the expression levels of TRIM24, TRIM14, TRIM29, TRIM59, and TRIM38 were higher in the high-risk group. Kaplan-Meier survival analysis revealed that the high-risk group had worse overall survival compared to the low-risk group (Figure 4G, 4H). The AUC values for 1-year, 2-year, and 3-year survival were 0.701, 0.759, and 0.765 in the CGGA325 cohort (Figure 4I), and 0.714, 0.732, and 0.712 in the CGGA693 cohort, respectively (Figure 4J).
Figure 4.
Validation of the eight-TRIM gene signature in CGGA325 and CGGA693 cohorts. A, B. The risk score distribution of patients in CGGA325 and CGGA693 cohorts. C, D. The survival status and overall survival time of patients in CGGA325 and CGGA693 cohorts. E, F. The expression of the eight TRIM genes in high- and low-risk group. G, H. Kaplan-Meier survival analysis in CGGA325 and CGGA693 cohorts suggested that high-risk group had worse overall survival than low-risk group. I, J. Time-dependent ROC curves of the gene signature for predicting 1-year, 2-year, and 3-year overall survival in CGGA325 and CGGA693 cohorts.
Stratification analysis of the eight-TRIM gene signature based on clinicopathological features
To further assess the predictive power of the eight-TRIM gene signature, glioma patients in the entire TCGA cohort were stratified into different subgroups according to universal clinicopathological features. The results of Kaplan-Meier survival analysis indicated that the prognosis of the high-risk group continued to be worse than that of the low-risk group in the subgroups stratified by age, sex, and grade (Figure 5A-F).
Figure 5.
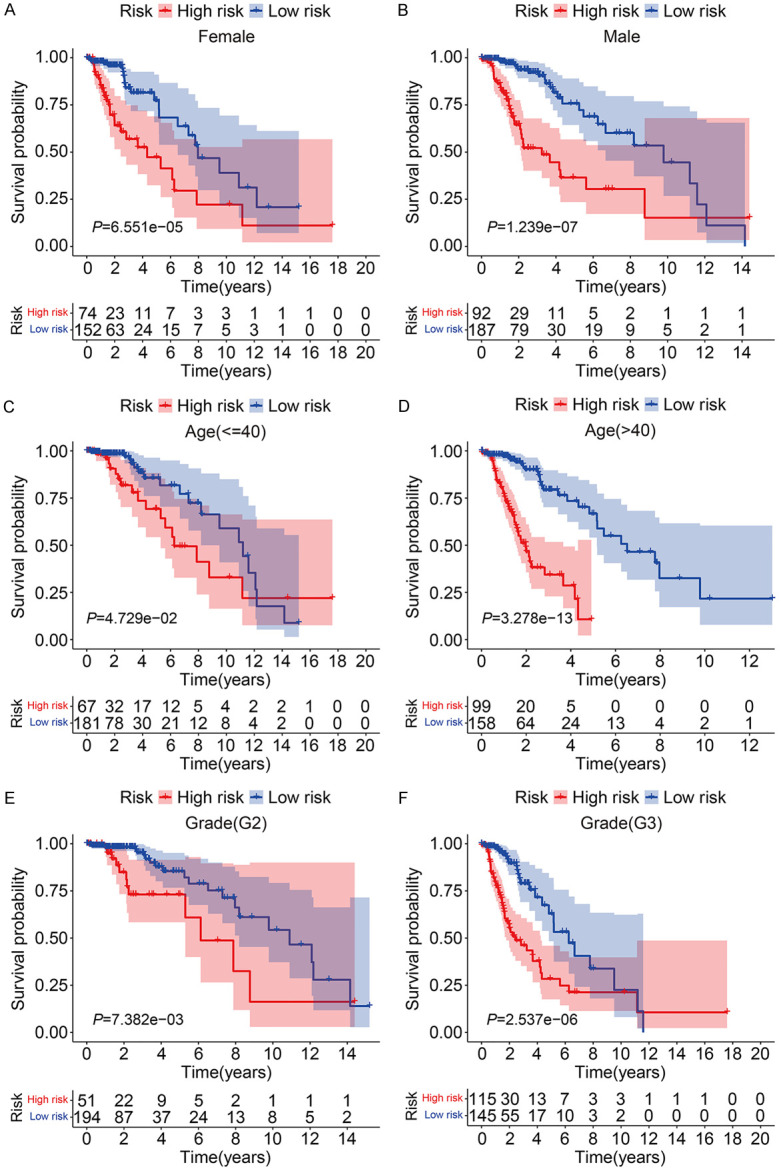
Kaplan-Meier survival analysis of subgroups stratified by gender (A, B), age (C, D), and grade (E, F).
The prognostic independence of the eight-TRIM gene signature and construction of a nomogram in glioma
To detect whether the risk signature was independent of other clinical factors including sex, age, and grade, univariate Cox regression analysis and multivariate Cox regression analysis were conducted. As shown in Table 1, age and risk score were independent prognostic factors in all three cohorts. Moreover, we constructed a nomogram using the risk signature, age, sex, and grade to help in clinical decision-making (Figure 6A). The calibration plot showed that the predicted rates for 1-year, 3-year, and 5-year overall survival in the nomogram were close to the observed overall survival rates (Figure 6B-D), indicating the strong predictive power of the nomogram and its clinical applicability.
Table 1.
Univariable and multivariable analysis of the eight-TRIM gene signature and clinical factors in the glioma cohorts
| TCGA | Univariable analysis | Multivariable analysis | ||||||
|
|
|
|
||||||
| Variables | HR | 95% CI of HR | P | HR | 95% CI of HR | P | ||
|
|
|
|||||||
| Lower | Upper | Lower | Upper | |||||
|
| ||||||||
| Age (≤40 vs >40) | 3.3306 | 2.1925 | 5.0595 | 0.0000 | 2.9885 | 1.9286 | 4.6311 | 0.0000 |
| Gender (Female vs Male) | 1.0603 | 0.7262 | 1.5479 | 0.7619 | 1.2313 | 0.8361 | 1.8132 | 0.2920 |
| Grade | 3.1205 | 2.0615 | 4.7235 | 0.0000 | 2.6479 | 1.7226 | 4.0703 | 0.0000 |
| Risk Score | 1.1293 | 1.0985 | 1.1609 | 0.0000 | 1.1057 | 1.0724 | 1.1401 | 0.0000 |
|
| ||||||||
| CGGA693 | Univariable analysis | Multivariable analysis | ||||||
|
|
|
|||||||
| Variables | HR | 95% CI of HR | P | HR | 95% CI of HR | P | ||
|
|
|
|||||||
| Lower | Upper | Lower | Upper | |||||
|
| ||||||||
| Age (≤40 vs >40) | 2.7137 | 2.2791 | 3.2311 | 0.0000 | 2.3667 | 1.9668 | 2.8479 | 0.0000 |
| Gender (Female vs Male) | 1.0961 | 0.8685 | 1.3833 | 0.4396 | 1.1086 | 0.8779 | 1.3999 | 0.3864 |
| Grade | 1.6128 | 1.2660 | 2.0547 | 0.0001 | 1.3667 | 1.0677 | 1.7494 | 0.0131 |
| Risk Score | 1.3260 | 1.2371 | 1.4212 | 0.0000 | 1.1617 | 1.0667 | 1.2651 | 0.0006 |
|
| ||||||||
| CGGA325 | Univariable analysis | Multivariable analysis | ||||||
|
|
|
|||||||
| Variables | HR | 95% CI of HR | P | HR | 95% CI of HR | P | ||
|
|
|
|||||||
| Lower | Upper | Lower | Upper | |||||
|
| ||||||||
| Age (≤40 vs >40) | 2.7769 | 2.2768 | 3.3869 | 0.0000 | 2.7566 | 2.2449 | 3.3850 | 0.0000 |
| Gender (Female vs Male) | 1.0653 | 0.7982 | 1.4217 | 0.6677 | 0.9877 | 0.7390 | 1.3201 | 0.9335 |
| Grade | 1.6010 | 1.1921 | 2.1502 | 0.0018 | 1.0511 | 0.7740 | 1.4274 | 0.7495 |
| Risk Score | 1.0104 | 1.0016 | 1.0192 | 0.0207 | 1.0109 | 1.0004 | 1.0214 | 0.0418 |
Figure 6.

Construction of a nomogram in TCGA glioma cohort. A. The nomogram comprising gender, age, tumor grade, and risk score. B-D. Calibration plots of 1-, 3-, and 5-year overall survival of glioma patients.
TRIM17 was downregulated in glioma and correlated with the prognosis of patients
Of the eight TRIM genes, the role of TRIM17 in glioma is not well-documented. To explore the role of TRIM17 in glioma, we first examined the expression levels of TRIM17 in human glioma tumor tissues. qRT-PCR suggested that mRNA levels of TRIM17 were significantly downregulated in glioma tumor tissues compared to normal brain tissues (Figure 7A). Besides, we found that the expression of TRIM17 decreased with an increase in the tumor grade by re-analyzing the aforementioned public databases (Figure 7B-D). Moreover, Kaplan-Meier survival analysis revealed that a lower expression of TRIM17 predicted poor prognosis in glioma (Figure 7E-H). Taken together, these analyses indicated that TRIM17 might function as a tumor suppressor in glioma.
Figure 7.
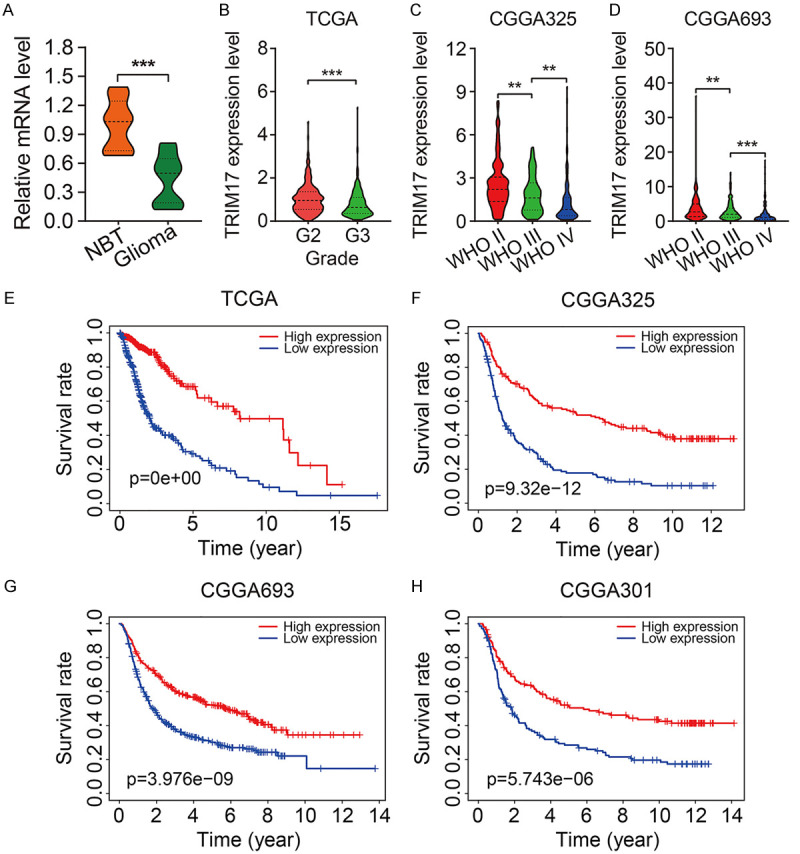
TRIM17 was downregulated in glioma and correlated with the prognosis of patients. A. The mRNA levels of TRIM17 in glioma tissues and normal brain tissues (NBT). B-D. TRIM17 expression correlated with tumor grade. E-H. Kaplan-Meier survival analysis revealed that low expression of TRIM17 predicted poor prognosis in glioma. **P<0.01, ***P<0.001.
TRIM17 negatively regulated cell proliferation in glioma cells
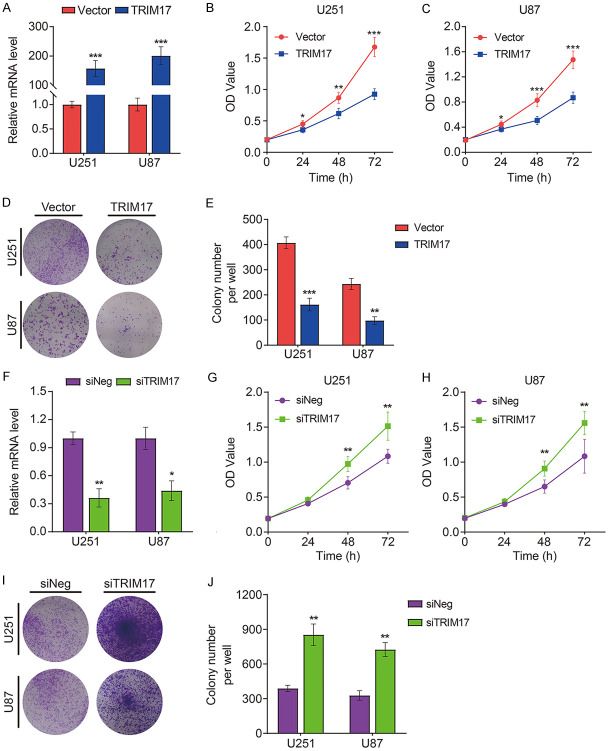
To elucidate the cellular function of TRIM17 in glioma, we examined the effect of overexpression or knockdown of TRIM17 on glioma cell proliferation. The transfection efficiencies of pc3.1-TRIM17-flag or siTRIM17 were confirmed by qRT-PCR (Figure 8A, 8F). CCK-8 and colony formation assays suggested that TRIM17 overexpression significantly inhibited proliferation of U251 and U87 cells (Figure 8B-E). Conversely, silencing TRIM17 facilitated glioma cell proliferation (Figure 8G-J).
Figure 8.
The effect of TRIM17 overexpression or knock-down on glioma cell proliferation. A. Transfection efficiency of TRIM17 overexpression plasmid was confirmed by qRT-PCR. B, C. CCK-8 assay was used to detect the effect of TRIM17 overexpression on U251 and U87 cell proliferation. D, E. Colony formation assay was performed after transfection with empty vector or TRIM17 overexpression plasmid. F. Transfection efficiency of TRIM17 knock-down was confirmed by qRT-PCR. G, H. CCK-8 assay was used to detect the effect of TRIM17 knock-down on U251 and U87 cell proliferation. I, J. Colony formation assay was performed after transfection with siNeg or siTRIM17. *P<0.05, **P<0.01, ***P<0.001.
Discussion
The TRIM is a large family of genes with similar functions. Their translation products act as E3 ubiquitin ligases that mediate the ligation of ubiquitin to substrate proteins and further promote its elimination [11,13]. Thus, TRIM family genes are involved in various aspects of biological processes, including cell cycle, cell death, metabolism, immunity, and autophagy by regulating the homeostasis of substrate proteins [22-25]. Dysregulation of TRIMs has been discovered in tumors including glioma. Feng et al. [20] reported that upregulation of TRIM14 in human glioblastoma correlated with tumor progression and predicted shorter patient survival times. Functional experiments have revealed that decreased TRIM14 expression inhibited glioblastoma cell migration and invasion by inhibiting the epithelial-mesenchymal transition process. Zhang et al. [21] found that consistent with its tumor suppressive function, TRIM45 was downregulated in glioma. Enforced expression of TRIM45 inhibited cell proliferation and tumorigenicity by stabilizing and activating p53. These studies indicated that the aberrant expression of TRIMs contributed to malignant cellular biological behaviors, and might be a prognostic biomarker in patients with glioma.
In this study, we performed an integrative analysis of TRIM family genes in glioma. Interestingly, we found that more than half of TRIMs were closely related to the prognosis of glioma patients, suggesting the critical role of TRIM family genes in the oncogenesis and progression of glioma. Then, we constructed a prognostic signature based on the expression profile of TRIMs and the corresponding clinical information. The accuracy of the signature in predicting the prognosis of glioma patients was confirmed in an internal cohort and two independent external cohorts. Besides, univariate Cox regression analysis and multivariate Cox regression analysis in all the internal and external cohorts indicated that the risk signature was independent of other clinical factors, including sex, age, and grade. We also constructed a nomogram comprising the risk score, sex, age, and grade, which might help clinicians in making decisions. Taken together, these results suggest that the prognostic signature might be clinically useful in glioma patients.
Eight TRIMs including TRIM17, TRIM13, TRIM8, TRIM24, TRIM14, TRIM29, TRIM59, and TRIM38 were included in the risk signature. Of the eight TRIMs, TRIM24, TRIM14, TRIM29, and TRIM59 were oncogenes in glioma. Consistent with their role in promoting cell proliferation, migration, invasion, chemoresistance, and stemness, the expression levels of TRIM24, TRIM14, TRIM29, and TRIM59 were significantly increased in glioma, and correlated with the clinical outcome of glioma patients [26-29]. The role of TRIM8 in glioma is still controversial. On one hand, the expression of TRIM8 was found to be down-regulated in high grade gliomas, and lower expression predicted an unfavorable clinical outcome. In addition, enforced expression of TRIM8 reduced cell proliferation [30], suggesting the tumor suppressor potential of TRIM8 in glioma. On the other hand, overexpression of TRIM8 could promote stemness and self-renewal in glioma by activating STAT3 signaling, suggesting the tumor-promoting function of TRIM8 [31]. TRIM13 exerts diverse roles in different tumor types [32,33]. However, its role in glioma has not been reported, and needs to be explored in the future.
The role of TRIM17 in glioma is still uncharacterized. We found that TRIM17 was significantly downregulated in glioma, and decreased with an increase in the tumor grade. Besides, Kaplan-Meier survival analysis revealed that decreased expression of TRIM17 predicted poor prognosis in four independent cohorts of patients with glioma. Therefore, TRIM17 may be regarded as a prognostic biomarker in glioma. To further explore the role of TRIM17, we performed gain of function and loss of function experiments on glioma cells. Upon plasmid transfection, the expression of TRIM17 was significantly increased in U251 and U87 cells, which resulted in reduced cell proliferation. Conversely, silencing of TRIM17 in glioma cells had an opposite effect. These results suggested that TRIM17 functioned as a tumor suppressor in glioma. Previous studies have connected TRIM17 with cell apoptosis, cell proliferation inhibition, and drug resistance. In neurons, TRIM17-mediated ubiquitination and degradation of Mcl-1 (myeloid cell leukemia-1) promote the initiation of caspase-dependent apoptosis [34]. In tumors, silencing of TRIM17 induced immune and drug resistance by increasing the protein level of Mcl-1 [35]. These studies revealed that Mcl-1 was a vital downstream target of TRIM17. However, whether Mcl-1 mediates the effect of TRIM17 on glioma cell proliferation needs to be further explored.
Despites the aforementioned findings, there are some limitations of our study. First, the prognostic signature should also be validated in the real-word cohort of glioma patients, but the cases that we have collected are still not enough for external validation. Second, we only evaluated the effect of TRIM17 on glioma cell proliferation in vitro; it should be further explored in vivo, and we plan to investigate it in the future. Besides, the detailed mechanism of TRIM17 in regulating cell proliferation also requires further exploration.
Conclusion
In summary, we identified a novel and clinically useful prognostic signature based on eight TRIMs. It demonstrated satisfactory accuracy and generalizability in predicting the prognosis of glioma patients. Of the eight TRIMs, TRIM17 was downregulated in glioma and correlated with the tumor grade and clinical outcome of patients with glioma. TRIM17 could serve as a prognostic marker and potential therapeutic target in glioma.
Acknowledgements
This study was funded by grants from National Natural Science Foundation of China (No. 81572489).
Disclosure of conflict of interest
None.
References
- 1.Cheng J, Fan YQ, Liu BH, Zhou H, Wang JM, Chen QX. ACSL4 suppresses glioma cells proliferation via activating ferroptosis. Oncol Rep. 2020;43:147–158. doi: 10.3892/or.2019.7419. [DOI] [PMC free article] [PubMed] [Google Scholar]
- 2.Ostrom QT, Bauchet L, Davis FG, Deltour I, Fisher JL, Langer CE, Pekmezci M, Schwartzbaum JA, Turner MC, Walsh KM, Wrensch MR, Barnholtz-Sloan JS. The epidemiology of glioma in adults: a “state of the science” review. Neuro Oncol. 2014;16:896–913. doi: 10.1093/neuonc/nou087. [DOI] [PMC free article] [PubMed] [Google Scholar]
- 3.Huang R, Li G, Wang Z, Hu H, Zeng F, Zhang K, Wang K, Wu F. Identification of an ATP metabolism-related signature associated with prognosis and immune microenvironment in gliomas. Cancer Sci. 2020;111:2325–2335. doi: 10.1111/cas.14484. [DOI] [PMC free article] [PubMed] [Google Scholar]
- 4.Peng Z, Liu C, Wu M. New insights into long noncoding RNAs and their roles in glioma. Mol Cancer. 2018;17:61. doi: 10.1186/s12943-018-0812-2. [DOI] [PMC free article] [PubMed] [Google Scholar]
- 5.Bush NA, Chang SM, Berger MS. Current and future strategies for treatment of glioma. Neurosurg Rev. 2017;40:1–14. doi: 10.1007/s10143-016-0709-8. [DOI] [PubMed] [Google Scholar]
- 6.Mair MJ, Geurts M, van den Bent MJ, Berghoff AS. A basic review on systemic treatment options in WHO grade II-III gliomas. Cancer Treat Rev. 2021;92:102124. doi: 10.1016/j.ctrv.2020.102124. [DOI] [PubMed] [Google Scholar]
- 7.Qazi MA, Vora P, Venugopal C, Sidhu SS, Moffat J, Swanton C, Singh SK. Intratumoral heterogeneity: pathways to treatment resistance and relapse in human glioblastoma. Ann Oncol. 2017;28:1448–1456. doi: 10.1093/annonc/mdx169. [DOI] [PubMed] [Google Scholar]
- 8.Miller JJ, Shih HA, Andronesi OC, Cahill DP. Isocitrate dehydrogenase-mutant glioma: evolving clinical and therapeutic implications. Cancer. 2017;123:4535–4546. doi: 10.1002/cncr.31039. [DOI] [PubMed] [Google Scholar]
- 9.Mansouri A, Hachem LD, Mansouri S, Nassiri F, Laperriere NJ, Xia D, Lindeman NI, Wen PY, Chakravarti A, Mehta MP, Hegi ME, Stupp R, Aldape KD, Zadeh G. MGMT promoter methylation status testing to guide therapy for glioblastoma: refining the approach based on emerging evidence and current challenges. Neuro Oncol. 2019;21:167–178. doi: 10.1093/neuonc/noy132. [DOI] [PMC free article] [PubMed] [Google Scholar]
- 10.Lapointe S, Perry A, Butowski NA. Primary brain tumours in adults. Lancet. 2018;392:432–446. doi: 10.1016/S0140-6736(18)30990-5. [DOI] [PubMed] [Google Scholar]
- 11.Hatakeyama S. TRIM proteins and cancer. Nat Rev Cancer. 2011;11:792–804. doi: 10.1038/nrc3139. [DOI] [PubMed] [Google Scholar]
- 12.Esposito D, Koliopoulos MG, Rittinger K. Structural determinants of TRIM protein function. Biochem Soc Trans. 2017;45:183–191. doi: 10.1042/BST20160325. [DOI] [PubMed] [Google Scholar]
- 13.Gushchina LV, Kwiatkowski TA, Bhattacharya S, Weisleder NL. Conserved structural and functional aspects of the tripartite motif gene family point towards therapeutic applications in multiple diseases. Pharmacol Ther. 2018;185:12–25. doi: 10.1016/j.pharmthera.2017.10.020. [DOI] [PMC free article] [PubMed] [Google Scholar]
- 14.Alloush J, Weisleder N. TRIM proteins in therapeutic membrane repair of muscular dystrophy. JAMA Neurol. 2013;70:928–931. doi: 10.1001/jamaneurol.2013.469. [DOI] [PMC free article] [PubMed] [Google Scholar]
- 15.Liu J, Zhang C, Wang X, Hu W, Feng Z. Tumor suppressor p53 cross-talks with TRIM family proteins. Genes Dis. 2021;8:463–474. doi: 10.1016/j.gendis.2020.07.003. [DOI] [PMC free article] [PubMed] [Google Scholar]
- 16.Valletti A, Marzano F, Pesole G, Sbisà E, Tullo A. Targeting chemoresistant tumors: could TRIM proteins-p53 axis be a possible answer? Int J Mol Sci. 2019;20:1776. doi: 10.3390/ijms20071776. [DOI] [PMC free article] [PubMed] [Google Scholar]
- 17.Yuan Z, Villagra A, Peng L, Coppola D, Glozak M, Sotomayor EM, Chen J, Lane WS, Seto E. The ATDC (TRIM29) protein binds p53 and antagonizes p53-mediated functions. Mol Cell Biol. 2010;30:3004–3015. doi: 10.1128/MCB.01023-09. [DOI] [PMC free article] [PubMed] [Google Scholar]
- 18.Li K, Wang F, Cao WB, Lv XX, Hua F, Cui B, Yu JJ, Zhang XW, Shang S, Liu SS, Yu JM, Han MZ, Huang B, Zhang TT, Li X, Jiang JD, Hu ZW. TRIB3 promotes apl progression through stabilization of the oncoprotein PML-RARα and inhibition of p53-mediated senescence. Cancer Cell. 2017;31:697–710. e7. doi: 10.1016/j.ccell.2017.04.006. [DOI] [PubMed] [Google Scholar]
- 19.Ji J, Ding K, Luo T, Zhang X, Chen A, Zhang D, Li G, Thorsen F, Huang B, Li X, Wang J. TRIM22 activates NF-kappaB signaling in glioblastoma by accelerating the degradation of IkappaBalpha. Cell Death Differ. 2021;28:367–381. doi: 10.1038/s41418-020-00606-w. [DOI] [PMC free article] [PubMed] [Google Scholar]
- 20.Feng S, Cai X, Li Y, Jian X, Zhang L, Li B. Tripartite motif-containing 14 (TRIM14) promotes epithelial-mesenchymal transition via ZEB2 in glioblastoma cells. J Exp Clin Cancer Res. 2019;38:57. doi: 10.1186/s13046-019-1070-x. [DOI] [PMC free article] [PubMed] [Google Scholar] [Retracted]
- 21.Zhang J, Zhang C, Cui J, Ou J, Han J, Qin Y, Zhi F, Wang RF. TRIM45 functions as a tumor suppressor in the brain via its E3 ligase activity by stabilizing p53 through K63-linked ubiquitination. Cell Death Dis. 2017;8:e2831. doi: 10.1038/cddis.2017.149. [DOI] [PMC free article] [PubMed] [Google Scholar]
- 22.Wang S, Zhang Y, Huang J, Wong CC, Zhai J, Li C, Wei G, Zhao L, Wang G, Wei H, Zhao Z, Yu J. TRIM67 activates p53 to suppress colorectal cancer initiation and progression. Cancer Res. 2019;79:4086–4098. doi: 10.1158/0008-5472.CAN-18-3614. [DOI] [PubMed] [Google Scholar]
- 23.Hos NJ, Fischer J, Hos D, Hejazi Z, Calabrese C, Ganesan R, Murthy AMV, Rybniker J, Kumar S, Krönke M, Robinson N. TRIM21 is targeted for chaperone-mediated autophagy during salmonella typhimurium infection. J Immunol. 2020;205:2456–2467. doi: 10.4049/jimmunol.2000048. [DOI] [PMC free article] [PubMed] [Google Scholar]
- 24.Vicenzi E, Poli G. The interferon-stimulated gene TRIM22: A double-edged sword in HIV-1 infection. Cytokine Growth Factor Rev. 2018;40:40–47. doi: 10.1016/j.cytogfr.2018.02.001. [DOI] [PubMed] [Google Scholar]
- 25.Jena KK, Kolapalli SP, Mehto S, Nath P, Das B, Sahoo PK, Ahad A, Syed GH, Raghav SK, Senapati S, Chauhan S, Chauhan S. TRIM16 controls assembly and degradation of protein aggregates by modulating the p62-NRF2 axis and autophagy. EMBO J. 2018;37:e98358. doi: 10.15252/embj.201798358. [DOI] [PMC free article] [PubMed] [Google Scholar]
- 26.Zhang LH, Yin YH, Chen HZ, Feng SY, Liu JL, Chen L, Fu WL, Sun GC, Yu XG, Xu DG. TRIM24 promotes stemness and invasiveness of glioblastoma cells via activating Sox2 expression. Neuro Oncol. 2020;22:1797–1808. doi: 10.1093/neuonc/noaa138. [DOI] [PMC free article] [PubMed] [Google Scholar]
- 27.Tan Z, Song L, Wu W, Zhou Y, Zhu J, Wu G, Cao L, Song J, Li J, Zhang W. TRIM14 promotes chemoresistance in gliomas by activating Wnt/β-catenin signaling via stabilizing Dvl2. Oncogene. 2018;37:5403–5415. doi: 10.1038/s41388-018-0344-7. [DOI] [PubMed] [Google Scholar]
- 28.Cao Y, Shi L, Wang M, Hou J, Wei Y, Du C. ATDC contributes to sustaining the growth and invasion of glioma cells through regulating Wnt/β-catenin signaling. Chem Biol Interact. 2019;305:148–155. doi: 10.1016/j.cbi.2019.03.033. [DOI] [PubMed] [Google Scholar]
- 29.Sang Y, Li Y, Song L, Alvarez AA, Zhang W, Lv D, Tang J, Liu F, Chang Z, Hatakeyama S, Hu B, Cheng SY, Feng H. TRIM59 promotes gliomagenesis by inhibiting TC45 dephosphorylation of STAT3. Cancer Res. 2018;78:1792–1804. doi: 10.1158/0008-5472.CAN-17-2774. [DOI] [PMC free article] [PubMed] [Google Scholar]
- 30.Micale L, Fusco C, Fontana A, Barbano R, Augello B, De Nittis P, Copetti M, Pellico MT, Mandriani B, Cocciadiferro D, Parrella P, Fazio VM, Dimitri LM, D’Angelo V, Novielli C, Larizza L, Daga A, Merla G. TRIM8 downregulation in glioma affects cell proliferation and it is associated with patients survival. BMC Cancer. 2015;15:470. doi: 10.1186/s12885-015-1449-9. [DOI] [PMC free article] [PubMed] [Google Scholar]
- 31.Zhang C, Mukherjee S, Tucker-Burden C, Ross JL, Chau MJ, Kong J, Brat DJ. TRIM8 regulates stemness in glioblastoma through PIAS3-STAT3. Mol Oncol. 2017;11:280–294. doi: 10.1002/1878-0261.12034. [DOI] [PMC free article] [PubMed] [Google Scholar]
- 32.Xu L, Wu Q, Zhou X, Wu Q, Fang M. TRIM13 inhibited cell proliferation and induced cell apoptosis by regulating NF-κB pathway in non-small-cell lung carcinoma cells. Gene. 2019;715:144015. doi: 10.1016/j.gene.2019.144015. [DOI] [PubMed] [Google Scholar]
- 33.Gatt ME, Takada K, Mani M, Lerner M, Pick M, Hideshima T, Carrasco DE, Protopopov A, Ivanova E, Sangfelt O, Grandér D, Barlogie B, Shaughnessy JD Jr, Anderson KC, Carrasco DR. TRIM13 (RFP2) downregulation decreases tumour cell growth in multiple myeloma through inhibition of NF Kappa B pathway and proteasome activity. Br J Haematol. 2013;162:210–220. doi: 10.1111/bjh.12365. [DOI] [PMC free article] [PubMed] [Google Scholar]
- 34.Magiera MM, Mora S, Mojsa B, Robbins I, Lassot I, Desagher S. Trim17-mediated ubiquitination and degradation of Mcl-1 initiate apoptosis in neurons. Cell Death Differ. 2013;20:281–292. doi: 10.1038/cdd.2012.124. [DOI] [PMC free article] [PubMed] [Google Scholar]
- 35.Song KH, Choi CH, Lee HJ, Oh SJ, Woo SR, Hong SO, Noh KH, Cho H, Chung EJ, Kim JH, Chung JY, Hewitt SM, Baek S, Lee KM, Yee C, Son M, Mao CP, Wu TC, Kim TW. HDAC1 upregulation by NANOG promotes multidrug resistance and a stem-like phenotype in immune edited tumor cells. Cancer Res. 2017;77:5039–5053. doi: 10.1158/0008-5472.CAN-17-0072. [DOI] [PMC free article] [PubMed] [Google Scholar]


