

Highlights
-
•
A total of 508 metabolites were identified in three cassava cultivars.
-
•
White-fleshed cassava had the highest contents of amino acids and organic acids.
-
•
Yellow-fleshed cassava was enriched in metabolites related to specific pathways.
-
•
Several pathways were found to be regulated at the transcriptional level.
Keywords: Cassava, Metabolome, Transcriptome, Primary metabolites, Secondary metabolites
Abstract
Cassava is a significant food security crop in several developing countries. Metabolites in cassava roots provide numerous nutrients essential for human health. Exploiting the diversity of nutritional ingredients present in cassavas is vital for improving its nutritional value. To address this problem, root metabolomes of three cassava cultivars with white-flesh, light-yellow-flesh and yellow-flesh were comprehensively measured, respectively. A total of 508 metabolites were detected in cassava roots, including 300 primary metabolites and 185 secondary metabolites. There were 22.6% to 34.1% metabolites exhibiting significant variations among the three cassava cultivars. The light-yellow-flesh cassava contained higher contents of secondary metabolites, especially flavone, phenylpropanoids and alkaloids, and lower contents of primary metabolites except lipids, alcohols, vitamins and derivatives. Compared with light-yellow-flesh cassava, the yellow-flesh cassava contained higher contents of amino acid and derivatives, but lower contents of phenylpropanoids, nucleotide and derivates. White-flesh cassava contained higher contents of primary metabolites, especially amino acid and derivatives, but lower contents of secondary metabolites except flavonoid and indole derivatives. Transcriptome analyses were parallelly performed to decipher the potential mechanisms regulating the accumulations of related metabolites. Several pathways were both enriched by differentially expressed genes and differentially accumulated metabolites, supporting that metabolisms of these metabolites were regulated at transcriptional level. These results expand the knowledge on metabolite compositions in cassava roots and provide substantial information for genetic improvement of cassavas with high nutritional values.
1. Introduction
Cassava (Manihot esculenta Crantz, 2n = 36) is an economically and nutritionally important crop with edible storage root, which provides the major dietary carbohydrates for more than 800 million people in tropical and sub-tropical Africa, Asia and Latin America (Tappiban, Smith, Triwitayakorn, & Bao, 2019). The nutritional composition of cassava root is important because it is mainly grown in areas where malnutrition is widespread, especially in Africa. Cassava storage root is rich in starch, but poor in protein, fat, minerals and micronutrients (Montagnac, Davis, & Tanumihardjo, 2009). Therefore, improving the nutritional value of cassava is crucial for alleviating malnutrition in several developing countries.
Metabolites not only play vital roles in plant growth, development and adaptation, but also provide almost all essential human nutrients either directly or indirectly (Wang, Alseekh, Fernie, & Luo, 2019). The amounts and types of nutritional metabolites harboring in cultivar determine its nutritional value. Exploration of metabolic diversity and deciphering genetic regulation of nutritional metabolites are important for improving the nutritional values of crops (Fang, Fernie, & Luo, 2019). Metabolome is an efficient approach to determine the metabolic profiles of interested crop under specific condition, and regarded as a bridge between genotypes and phenotypes. Metabolome-assisted breeding techniques have been developed and used to improve the nutritional quality of crops (Fang, Luo, & Wang, 2019). The recently developed widely targeted metabolomic approach based on liquid chromatography–mass spectrometry enables high-throughput detection of metabolites and has been used in several species (Chen et al., 2013). Transcriptome is routinely used to elucidate the regulating mechanism of interested traits by providing the comprehensive profiling of gene expression. Integrative analysis of metabolome and transcriptome has been used to identify the valuable nutritional metabolites and clarify the underlying regulating mechanism (Zhang et al., 2019).
Because of the significant role in food security, vast efforts have been made on cassava to identify human beneficial metabolites and develop biofortified cultivars with improved nutritional values (Leyva-Guerrero, Narayanan, Ihemere, & Sayre, 2012). Natural variations on vitamin B1 contents and carotenoid types among cassava cultivars were explored and their underlying regulating mechanisms were investigated, respectively (Carvalho et al., 2016, Mangel et al., 2017). Provitamin A biofortification of cassava has been used to increase the carotene concentrations in cassava storage roots (Ayetigbo et al., 2018, Beyene et al., 2018). Chemical screening methods for primary and secondary metabolites were established and used to identify the biomarker metabolites linking to the interested traits in cassavas (Drapal, Barros de Carvalho, Ovalle Rivera, Becerra Lopez-Lavalle, & Fraser, 2019). Metabolome analysis was also used to understand the physiological deterioration of cassava root during postharvest (Uarrota and Maraschin, 2015, Uarrota et al., 2014). Transcriptome has been employed in cassavas to establish the gene expression atlas of several organs, and identify the genes associated with high starch traits (Guo et al., 2018, Wilson et al., 2017). These metabolic and transcriptomic data provide valuable information for genetic improvement of cassava. However, the metabolic and transcriptomic profiles of cassava roots have not been parallelly investigated using the high-throughput approaches.
Cassava root is the main organ with the functions of nutrient storage and reproduction. Usually, the white-flesh cassavas are the dominant cultivars. However, diverse flesh colors are present in cassava germplasm. Colored-flesh cassavas usually have higher carotene contents (Carvalho et al., 2016). As a result, the colored-flesh cassava germplasms are considered to have higher values in breeding programs compared to the white-flesh cassavas. However, whether the cassavas with different flesh colors have the same nutritional properties is still poorly understood. To address this problem, metabolome integrated with transcriptome was used in the present study, to determine the metabolic and transcriptomic profiling of three cassava cultivars with different flesh colors, with the aims of comprehensively identifying the natural variation of metabolites in cassavas and the related regulating mechanism at transcriptional level. The results provide substantial information for selection and genetic improvement of cassava cultivars with high nutritional quality.
2. Materials and methods
2.1. Plant materials
Three cassava cultivars (Manihot esculenta Crantz) with white, light-yellow, and yellow flesh were selected for the study. The white-fleshed cultivar “W-11” is abbreviated as W. Similarly, “LY-21” and “Y-34” with light-yellow and yellow flesh are referred to as F and Y, respectively (Supplementary Fig. S1). Seedlings of the cassava cultivars were planted in the experimental fields of Guangxi Academy of Agricultural Sciences (Guangxi, China) with three biological replicates and a random arrangement. Nine months after planting when the cassavas reached their economic maturity stages, the well-developed and uniform roots were collected from each replicate plot. The flesh of each root was sampled and immediately frozen in liquid nitrogen. The frozen samples were stored at −80 °C in a freezer for subsequent metabolome and transcriptome analyses.
2.2. Metabolome measurement
A widely targeted metabolomics strategy was used to determine the metabolites in cassava roots. Metabolite extraction, detection, identification, and quantification were carried out with the help of Wuhan MetWare Biotechnology Co., Ltd. (www.metware.cn) based on the methods described by Chen et al. (2013). Briefly, the freeze-dried root flesh sample was crushed using a mixer mill (MM 400, Retsch) with a zirconia bead for 1.5 min at 30 Hz, and approximately 100 mg of powder was extracted with 70% aqueous methanol. The sample extracts were analyzed using a liquid chromatography-electrospray ionization-mass spectrometry (LC-ESI-MS/MS) system. The column of Waters ACQUITY UPLC HSS T3 C18 (1.8 µm, 2.1 mm*100 mm) and the solvent system of water (0.04% acetic acid) and acetonitrile (0.04% acetic acid) with the gradient program of 95:5 V/V at 0 min, 5:95 V/V at 11.0 min, 5:95 V/V at 12.0 min, 95:5 V/V at 12.1 min and 95:5 V/V at 15.0 min were used in the analysis. The flow rate was 0.40 mL/min with the temperature of 40 °C. The injection volume was 2 μl. The effluent was alternatively connected to an ESI-triple quadrupole-linear ion trap (Q TRAP)-MS. Three biological replicates were evaluated for each sample. The mixture of all the sample extracts was used as the quality control and added into the analysis after 10 samples to monitor the technical reproducibility. Metware database (MWDB) together with the public databases were used to annotate the metabolites. Quantifications of metabolites were conducted using the multiple reaction monitoring.
2.3. Transcriptome analysis
Total RNA was extracted from the frozen samples using the TransZol Plant Kit (Transgen) according to its instruction. Agarose gel electrophoresis was used to initially check the RNA quality. Then, RNA integrity was further determined using the Nanodrop and Agilent Bioanalyzer 2100 system. High-quality RNA samples were used to construct the strand-specific sequencing libraries. The paired ends (2 × 125 bp) were then sequenced on an Illumina HiSeq 4000 platform. Library construction and transcriptome sequencing were commercially provided by Metware Co., Ltd. (www.metware.cn). Fastp was used to remove the adapter and low-quality sequences in the generated reads (Chen, Zhou, Chen, & Gu, 2018). The draft genome sequence of a partially inbred cassava line (AM560) was used as the reference (https://phytozome.jgi.doe.gov/pz/portal.html). The clean reads were aligned to the reference genome using HISAT2 (Pertea, Kim, Pertea, Leek, & Salzberg, 2016). The counts of mapped reads were summarized at the gene level using featureCounts (Liao, Smyth, & Shi, 2014).
2.4. Quantitative Real-Time polymerase chain reaction (qPCR) analysis
Total RNA was used to synthesize cDNA using a PrimeScript RT Reagent Kit (TaKaRa). To validate the accuracy of RNAseq analysis, 8 genes were randomly selected and their abundances were measured using qPCR analysis. Specific primers were designed for each gene using Primer3 (Untergasser, Cutcutache, Koressaar, Ye, Faircloth, Remm, & Rozen, 2012). Actin was used as the reference gene according to the previous report (Li et al., 2017). The selected genes and their primers are listed in Supplementary Table S1. All qPCR analyses were conducted as described previously (Kong et al., 2017). Three technical replicates were adopted for each biological repeat. Relative expression abundances of the targeted genes were calculated using the negative delta-delta Ct method (Schmittgen & Livak, 2008).
2.5. Statistical analysis
In metabolome analysis, principal component analysis (PCA) was performed to reveal the relationships among the samples based on the identified metabolites. Orthogonal partial least squares-discriminant analysis (OPLS-DA) was used to identify the differentially accumulated metabolites (DAMs) between the samples. The criteria of log2(fold change) > 1 and variable importance in project (VIP) ≥ 1 were adopted in the analysis. In transcriptome analysis, DESeq2 was used to calculate the fragments per kilobase of transcript per million mapped reads (FPKM) and to identify the DEGs between the different genotypes (Love, Huber, & Anders, 2014). The thresholds for DEGs were set as an absolute value of log2 (fold change) lager than 1 and a false discovery rate (FDR) less than 0.05. The Kyoto Encyclopedia of Genes and Genomes (KEGG) database was used to assign the DAMs and DEGs to the corresponding metabolic pathways. KEGG enrichment analysis was then performed using clusterProfiler (Yu, Wang, Han, & He, 2012). All the data analyses were performed in R environment (https://www.r-project.org/).
3. Results
3.1. Metabolic profiling of cassava roots
To obtain a comprehensive understanding of the metabolites present in cassava root, a systematic metabolic profiling of roots with different flesh colors was carried out. The metabolome results for W, F, and Y were named WM, FM, and YM, respectively. To monitor the technical reproducibility, a quality control sample, which was the mixture of the sample extracts, was added after 10 samples in the analytical pipeline. The total ion current figures of different quality control samples can well overlapped, demonstrating the good reproducibility of the metabolomic analysis. PCA was performed on the detected metabolites to demonstrate the similarity in metabolic profiles among the samples (Fig. 1). In the two-dimensional PCA plot, three biological replicates of each sample tended to group together, indicating the high reproducibility of the generated metabolome data. Meanwhile, the scattering patterns of the three cassava cultivars in the two-dimensional plot showed significant differences among the metabolite profiles. A total of 508 metabolites were detected in the three cassava roots (Supplementary Table S2). Among these, 485 metabolites were classified into 21 known classes; the remaining 23 metabolites without known classifications were assigned to the “others” group (Fig. 2A). A total of 300 primary metabolites belonging to seven groups were identified. The dominant primary metabolites were amino acids and derivatives, organic acids and derivatives, and nucleotides and derivatives. These accounted for more than 70% of the total primary metabolites. The remaining classes of lipids and derivatives, carbohydrates and derivatives, alcohols and derivatives, vitamins and derivatives contained a comparable numbers of metabolites. A total of 185 secondary metabolites were identified and grouped into 14 classes, accounting for 36.4% of the total metabolites. Phenylpropanoids were the dominant secondary metabolites followed by alkaloids and flavone. Over 10 metabolites were detected in the terpene, flavonol, polyphenol, and phenolamide classes. Fewer than 10 metabolites were detected in the anthocyanin, indole derivatives, flavonoid, steride, flavanone, proanthocyanidin, and isoflavone classes.
Fig. 1.

Principal component analysis of the metabolites detected in the cassava roots with three biological replicates.
Fig. 2.

All identified metabolites and differentially accumulated metabolites (DAMs) in the cassava roots. A: classification of all the identified metabolites; B: number of the DAMs; C: classification and number of the DAMs.
3.2. Identification of the DAMs
To examine the metabolic differences among the cassava cultivars, the DAMs were identified based on pair-wise comparisons of the metabolomes (Fig. 2B). Detailed information on the DAMs is listed in Supplementary Table S3. Similar numbers of DAMs were identified in the comparisons of FM vs. WM and YM vs. FM (115 and 118, respectively). A total of 173 DAMs were identified in the comparison of YM vs. WM. The number of up-regulated DAMs was higher than then number of down-regulated DAMs in the comparison of FM vs. WM, whereas the numbers of up-regulated and down-regulated DAMs were similar in the comparisons of FM vs. WM and YM vs. FM. The DAMs identified in the pair-wise comparisons accounted for 22.6% to 34.1% of all detected metabolites, demonstrating the abundant diversity of metabolites present in cassava cultivars. Moreover, the highest number of DAMs was detected in the comparison of YM vs. WM, suggesting that the cultivar with yellow flesh exhibited a distinct metabolic profile compared to the cultivars with white and light-yellow flesh. To investigate the metabolic characteristics of each sample, the DAMs were grouped into their corresponding classes. The results are shown in Fig. 2C. In the comparison of FM vs. WM, the DAMs contained similar numbers of primary and secondary metabolites. Among them, primary metabolites in the lipid and derivative, alcohol and derivative, vitamin and derivative classes along with secondary metabolites in the anthocyanin, flavanone, and proanthocyanidin classes were up-regulated in FM compared to WM. Most secondary metabolites in the flavone, phenylpropanoid, and alkaloid classes were also up-regulated, whereas most of the primary metabolites in the organic acid and derivative and amino acid and derivative classes were down-regulated in FM compared to WM. In the comparison of YM vs. FM, a total of 65 primary metabolites and 48 secondary metabolites were identified as DAMs. Among them, most of the amino acids and derivatives were up-regulated in YM compared to FM, whereas most of the nucleotides and derivatives were down-regulated (Fig. 2C). No significant differences were observed among the classes of lipids, carbohydrates, and anthocyanins between YM and FM. Most phenylpropanoids and flavonols were down-regulated in YM compared to FM. In the comparison of YM vs. WM, primary and secondary metabolites accounted for 64.7% and 31.8% of the DAMs, respectively. Most amino acids and derivatives along with most nucleotides and derivatives were down-regulated in YM compared to WM. All polyphenols and most flavones and phenylpropanoids were up-regulated in YM compared with WM (Fig. 2C). No significant differences were observed in the contents of isoflavones and sterides among the three cassava cultivars (Fig. 2C). Taken together, these results indicate that the colored-flesh cassavas exhibited distinct metabolic compositions compared to the white-fleshed cassava. Compared to the other two cultivars, the cassava with light-yellow flesh contained higher contents of secondary metabolites, especially flavones, phenylpropanoids, and alkaloids, and lower contents of primary metabolites with the exceptions of lipids, alcohols, vitamins, and derivatives. Compared to the cultivar with light-yellow flesh, the cassava with yellow flesh contained higher contents of amino acids and derivatives but lower contents of phenylpropanoids along with nucleotides and derivatives. Compared to the other cassavas, the cultivar with white flesh contained higher contents of primary metabolites, especially amino acids and derivatives, and lower contents of secondary metabolites, with the exceptions of flavonoid and derivatives and indole and derivatives.
3.3. Transcriptomic profiling of cassava roots
To understand the molecular basis of the metabolic differences detected in the different cassavas, transcriptome sequencings of the same tissues were carried out. The transcriptomes of F, Y, and W were named as FT, YT, and WT, respectively. A total of 61.9 Gb of sequencing data was generated from the nine strand-specific libraries. The number of clean reads for each sample ranged from 39.8 to 52.3 million with a mean of 45.9 million. The Q30 values varied from 91.7% to 92.9%. The high-quality reads were aligned to the reference genome. The ratio of successfully mapped reads ranged from 88.7% to 89.5% with a mean of 89.1%. The count of mapped reads was summarized at the gene level. Pearson correlation coefficients were calculated between the samples. The correlation coefficients between the biological replicates of the same genotype were greater than 0.95, indicating good reproducibility of the biological repeats. These results suggested that the quantity and quality of the sequencing data were suitable for the downstream analysis.
To examine the differences in the transcriptomic profiles, the DEGs were identified via the pair-wise comparison of the root transcriptomes. Numbers of DEGs indentified in the pair-wise comparison are presented in Fig. 3. The comparison of YT vs. WT resulted in 2927 DEGs, including 1675 up-regulated and 1252 down-regulated genes. The comparison of FT vs. WT revealed a total of 1581 DEGs, among which 947 were up-regulated and 634 DEGs were down-regulated. The comparison of YT vs. FT resulted in 2627 DEGs, including 1372 up-regulated and 1255 down-regulated genes. Detailed information on the DEGs is presented in Supplementary Table S4. The large number of DEGs in each comparison indicates that the gene expression profiles were significantly different among the cassavas with different flesh colors.
Fig. 3.

Numbers of DEGs among YT, FT, and WT.
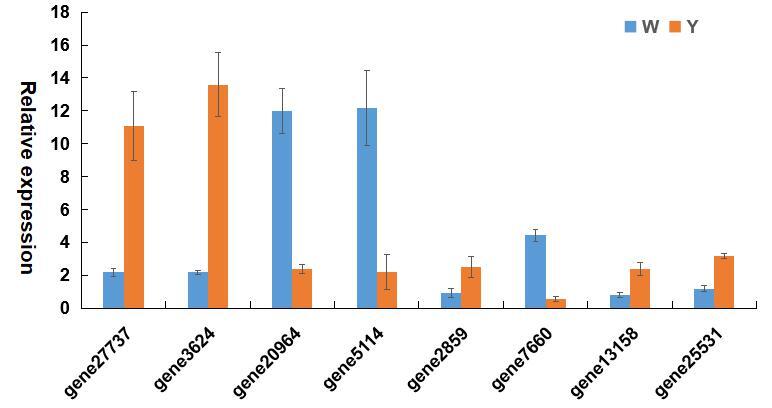
To verify the accuracy of transcriptome results, 8 genes were randomly selected and their transcript abundances were evaluated using qPCR. Expression patterns of the 8 genes in the white- and yellow-fleshed cassavas were consistent with the patterns that measured by transcriptome analysis, and the Pearson correlation coefficient between the quantifications of qPCR and transcriptome reached up to 0.86 (p < 0.05), demonstrating that the transcriptome results were reliable (Supplementary Fig. S2).
3.4. Metabolic pathways regulated at the transcriptional level
KEGG enrichment analysis was conducted to determine the metabolic pathways represented by the DAMs and DEGs. By searching the KEGG database, a total of 80, 81 and 110 DAMs from FM vs. WM, YM vs. FM and YM vs. WM were mapped to the KEGG pathways, respectively. KEGG enrichment analysis was performed on these DAMs and the results are listed in Supplementary Table S5. Similarly, KEGG enrichment analysis was also conducted on the DEGs, and the results are listed in Supplementary Table S6. To understand the metabolic pathways regulated at the transcriptional level, pair-wise comparisons were conducted on the enriched pathways of DAMs and DEGs. Both arginine and proline metabolism and beta-alanine metabolism overlapped between the white- and yellow-fleshed cassavas. The biosynthesis of secondary metabolites overlapped in the comparison of the cassavas with light-yellow and white flesh. Valine, leucine, and isoleucine degradation was enriched in the KEGG pathways of the DAMs and DAGs in the comparison of the cassavas with yellow and light-yellow flesh.
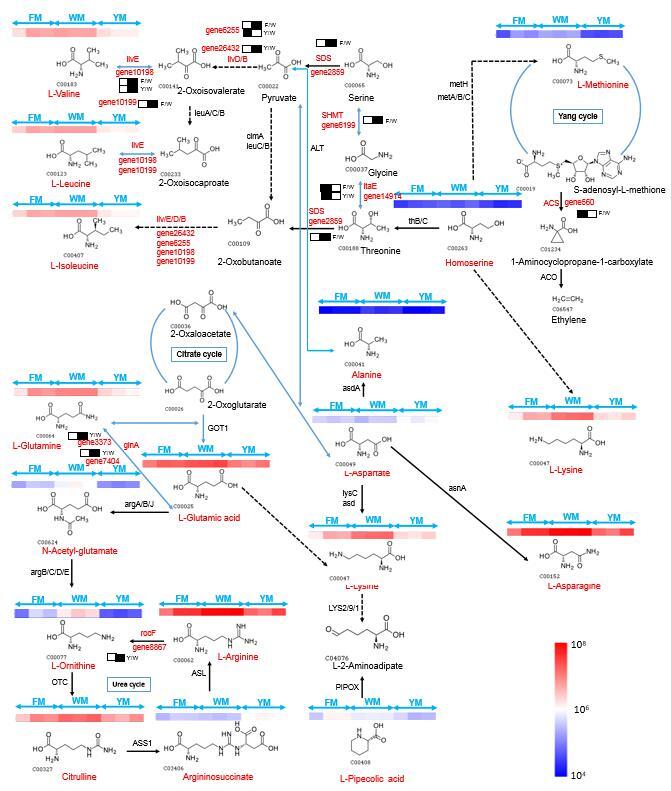
Mapping the differentially accumulated amino acid metabolites among the three cultivars showed that the white-fleshed cassava root had the highest contents of all amino acids except for alanine (Supplementary Fig. S3). Compared to the white-fleshed cultivar, the genes SDS (gene2859), ilvB (gene26432), sdaA (gene2859), ilvE (gene10198), glnA (gene3373/gene7404), and rocF (gene8867) were up-regulated in the cultivar with yellow flesh, while the genes ilvD (gene6255) and ltaE (gene14914) were down-regulated. The genes ilvD (gene6255), ilvE (gene10198/gene10199), SHMT (gene6199) and ACO (gene22308) were up-regulated in the cultivar with light-yellow flesh compared to the white-fleshed cultivar, while the genes ltaE (gene14914) and ACS (gene560) were down-regulated.
Phenylpropanoids are a diverse class of chemicals with immense health benefits. Mapping the DAMs among the three cultivars showed that the precursor of this pathway (L-phenylalanine) was highly accumulated in white-fleshed cassava compared to the other two cultivars (Fig. 4). PAL (gene27737) showed 3.244 times of log2 (fold change) increments in yellow-fleshed cassava compared to white-fleshed cassava. The expressions of PGT1 (gene30368) and CHI (gene13158) were up-regulated in the cultivar with light-yellow flesh compared to the white-fleshed cultivar. The structural genes CHI (gene13158), F3H (gene3624), F3′5′H (gene11250) and DFR (gene29597) were up-regulated in the yellow-fleshed cultivar compared to the white-fleshed cultivar.
Fig. 4.

Phenylpropanoid-flavonoid pathway in the three cassavas with different flesh colors. PAL: phenylalanine ammonia-lyase; TAL: tyrosine ammonia-lyase; 4CL: 4-coumarate CoA ligase; CHS: chalcone synthase; PGT: UDP-glucosyl transferase; HCDBR: NADP-dependent alkenal double bond reductase; CHI: chalcone isomerase; F3H: flavonoid 3′-hydroxylase; F3′5′H: flavonoid 3′,5′-hydroxylase; F6H: feruloyl-CoA 6-hydroxylase; FLS: flavonol synthase; DFR: dihydroflavonol 4-reductase; FR: flavanone 4-reductase; ANS: anthocyanidin synthase; LAR: leucocyanidin reductase; ANR: anthocyanin reductase; TOGT1: scopoletin glucosyltransferase. The differentially expressed transcripts are shown in red. Non-significant DEGs are shown in black. The solid line indicates the metabolic reactions in only one step. The dotted line presents more than one step of the metabolic reaction. The rectangle with black and white near the DEGs ID represents the up-regulated or down-regulated in Y or F compared with the W, respectively. The rectangle with black indicates relatively high FPKM values compared to rectangle with white. The left rectangle presents W, which is represented as control. The right rectangle presents Y or F. (For interpretation of the references to colour in this figure legend, the reader is referred to the web version of this article.)
4. Discussion
Determination of metabolite components in root flesh is one of the fundamental steps for cassava breeding with the aim of improving its nutritional quality. Metabolome is an efficient approach for measuring the metabolite components. Targeted and untargeted metabolome techniques have been used to identify the metabolites present in different organs of several crops (Sun et al., 2020, Wang et al., 2020). A total of 184 metabolites were indentified in cassava leaves using an untargeted approach (Perez-Fons et al., 2019). Drapal et al. (2019) employed a targeted approach to detect over 100 metabolites and evaluate the biochemical diversity of cassava germplasm. The targeted metabolomic approach was also used to investigate the dynamic changes of carotenoids, flavonoids, anthocyanins, and phenolics in cassava roots (Uarrota et al., 2014). It was found that metabolic compositions were significantly different in cassava organs and root was the most nutritionally valuable part of cassava (Montagnac et al., 2009). To further mine the metabolic components in cassava roots, the widely targeted metabolomic strategy was employed to measure the metabolites harboring in cassava roots in this study. A total of 508 metabolites, including 300 primary metabolites and 185 secondary metabolites, were detected in cassava roots. The amount of metabolites detected in this study was significantly higher than that previously reported in cassava roots. Moreover, metabolite components in organs with different colors also attracted attentions in other crops. A total of 213 metabolites were detected using LC-ESI-MS/MS in five sweet potato (Ipomoea batatas L.) cultivars exhibiting different flesh colors (Wang et al., 2018). Compared with sweet potato, more metabolites were also detected in the colored-flesh cassava roots in this study. As a result, the abundant metabolites identified in this study will not only provide substantial information for genetic improvement of cassava with high nutritional values, but also offer valuable reference for mining metabolites in the organs with different colors of other crops.
The poor nutrient density of cassava is exemplified in its low protein content (Moorthy, Wenham, & Blanshard, 1996). Cassava roots were reported to have a relatively low protein content of approximately 1%–3% on a dry basis (Ayetigbo et al., 2018). Moreover, its roots and leaves were found to be deficient in the sulfur-containing amino acids of methionine and cysteine (Ayetigbo et al., 2018). In this study, methionine, cysteine, homocysteine, and cetylcysteine were detected in the roots of the three cassavas. The content of methionine was higher in the white-fleshed cassava than in the yellow-fleshed cassava, whereas no significant difference was observed in the content of cysteine between these two cultivars. The composition and contents of amino acids affect fruit quality (Tieman et al., 2006). Alanine, threonine, and serine contribute to the sweetness of grapes; aspartate and glutamate contribute to the sour taste of grapes; and valine, leucine, isoleucine, methionine, and arginine contribute to the bitter taste of grapes (Shiraishi, Fujishima, & Chijiwa, 2010). Alanine provides a source of volatile aromatics in strawberry (Perez, Rios, Sanz, & Olias, 1992). Alanine and asparagine are also related to taste; they have a significant positive relationship with taste score in soybean (Kumar et al., 2011). In this study, valine, asparagine, arginine, alanine, leucine, isoleucine, glutamic acid, glutamine, ornithine, and methionine were much more abundant in the white-fleshed cassava than that in the yellow-flesh cassava. The relative abundance of alanine, asparagine, and glutamic acid might improve the flavor of the white cassava root, while arginine and ornithine could contribute to the bitterness of white cassava. These amino acids can be potentially used as metabolite markers related to the quality of cassava root.
A high content of scopoletin can be used as a potential biomarker for tolerance to postharvest physiological deterioration (PPD) (Uarrota et al., 2014). In this study, the contents of scopoletin in the cassavas with light-yellow and yellow flesh were similar, whereas the content of scopoletin in the white-fleshed cassava was significantly lower. This suggests that the colored-flesh cassavas are more tolerant to PPD than the white-fleshed cassava. This finding is consistent with the observation that yellow cassava roots exhibit reduced or delayed PPD compared to white cassava roots (Ayetigbo et al., 2018, Sánchez et al., 2006).
Transcriptome is widely used to dissect the molecular mechanism underlying the metabolite accumulation. In this study, a total of 2927, 1581, and 2627 DEGs were identified in the comparisons of YT vs. WT, FT vs. WT, and YT vs. FT, respectively. The large number of DEGs in each comparison indicated that the gene expression profiles were significantly different among the cassavas with different flesh colors. KEGG enrichment analysis of the DEGs showed that carotenoid biosynthesis pathway was significantly enriched in the comparison of YT vs. FT, however, which was not significantly enriched in the compassion of YT vs. WT or FT vs. WT. Expression of gene encoding beta-carotene isomerase was significantly down-regulated in the comparisons of YT vs. FT and YT vs. WT, leading to accumulate more beta-carotene in the yellow-fleshed cassava. These results suggested that pigmentation of cassava flesh was potentially regulated at transcriptional level. Similar results were also reported in several horticultural crops (Yuan, Zhang, Nageswaran, & Li, 2015).
Biosynthesis of secondary metabolites was significantly enriched in the transcriptome comparisons of YT vs. FT and FT vs. WT, which was also enriched in their corresponding metabolome comparisons of YM vs. FM and FM vs. WM. Similar results were also observed in colored-flesh sweet potatoes (He, Liu, Liu, Zhang, Zhang, Sun, & Jia, 2020). Through biosynthesis of secondary metabolites was not significantly enriched in the transcriptome comparison of YT vs. WT, it was enriched in the metabolome comparison of YT vs. WT, indicating the presence of posttranscriptional regulatory activity. Taken together, these results demonstrated that cassava roots with different flesh colors exhibited different patterns of secondary metabolite compositions, which can be further mined in cassava breeding programs aiming at nutritional improvement.
Although vast amount of metabolites were identified in cassava roots in this study, the sample size was very limited, which cannot provide more comprehensive overview on the metabolic diversity present in cassava germplasm. With the decreasing cost of metabolome analysis, more efforts can be put on mining the metabolic diversity of cassava germplasm, which is of great significance for the cassava breeding programs aiming at improvement of nutritional values. Meanwhile, more biological replicates also can be adopted to improve the robustness of metabolome analysis.
5. Conclusion
Cassavas with different flesh colors exhibited distinct metabolic profiling. The light-yellow fleshed cassava contained higher contents of secondary metabolites, especially flavones, phenylpropanoids, and alkaloids, along with lower contents of primary metabolites with the exceptions of lipids and derivatives, alcohols and derivatives, vitamins and derivatives. The white-fleshed cassava had high contents of essential amino acids and organic acids compared to the cultivars with light-yellow and yellow flesh. The yellow-fleshed cassava contained relative higher contents of amino acid and derivatives but lower contents of phenylpropanoids and derivatives and nucleotides and derivatives. Integration of metabolome and transcriptome analysis demonstrated pathways of arginine and proline metabolism, beta-alanine metabolism, biosynthesis of secondary metabolites, and valine, leucine, and isoleucine degradation were regulated at the transcriptional level.
Acknowledgements
This work was supported by the National Key R&D Program of China (Grant No. 2019YFD1001100 and Grant No. 2019YFD1000500) and the National Natural Science Foundation Science Foundation of China (Grant No. 31960440).
Footnotes
Supplementary data to this article can be found online at https://doi.org/10.1016/j.fochms.2021.100016.
Contributor Information
Qiusheng Kong, Email: qskong@mail.hzau.edu.cn.
Huabing Yan, Email: h.b.yan@hotmail.com.
Appendix A. Supplementary data
The following are the Supplementary data to this article:
Supplementary figure 1.

Supplementary figure 2.
Supplementary figure 3.
References
- Ayetigbo O., Latif S., Abass A., Mueller J. Comparing characteristics of root, flour and starch of biofortified yellow-flesh and white-flesh cassava variants, and sustainability considerations: A review. Sustainability. 2018;10:3089. doi: 10.3390/su10093089. [DOI] [Google Scholar]
- Beyene G., Solomon F.R., Chauhan R.D., Gaitán-Solis E., Narayanan N., Gehan J.…Cahoon E.B. Provitamin A biofortification of cassava enhances shelf life but reduces dry matter content of storage roots due to altered carbon partitioning into starch. Plant Biotechnology Journal. 2018;16:1186–1200. doi: 10.1111/pbi.12862. [DOI] [PMC free article] [PubMed] [Google Scholar]
- Carvalho L., Agustini M.AV., Anderson J.V., Vieira E.A., de Souza C., Chen S.…Silva J.P. Natural variation in expression of genes associated with carotenoid biosynthesis and accumulation incassava (Manihot esculenta Crantz) storage root. BMC Plant Biology. 2016;16 doi: 10.1186/s12870-016-0826-0. [DOI] [PMC free article] [PubMed] [Google Scholar]
- Chen W., Gong L., Guo Z., Wang W., Zhang H., Liu X.…Luo J. A novel integrated method for large-scale detection, identification, and quantification of widely targeted metabolites: Application in the study of rice metabolomics. Molecular Plant. 2013;6:1769–1780. doi: 10.1093/mp/sst080. [DOI] [PubMed] [Google Scholar]
- Chen S., Zhou Y., Chen Y., Gu J. fastp: An ultra-fast all-in-one FASTQ preprocessor. Bioinformatics. 2018;34:884–890. doi: 10.1093/bioinformatics/bty560. [DOI] [PMC free article] [PubMed] [Google Scholar]
- Drapal M., Barros de Carvalho E., Ovalle Rivera T.M., Becerra Lopez-Lavalle L.A., Fraser P.D. Capturing biochemical diversity in cassava (Manihot esculenta Crantz) through the application of metabolite profiling. Journal of Agricultural and Food Chemistry. 2019;67:986–993. doi: 10.1021/acs.jafc.8b04769. [DOI] [PMC free article] [PubMed] [Google Scholar]
- Fang C., Fernie A.R., Luo J. Exploring the diversity of plant metabolism. Trends in Plant Science. 2019;24:83–98. doi: 10.1016/j.tplants.2018.09.006. [DOI] [PubMed] [Google Scholar]
- Fang C., Luo J., Wang S. The diversity of nutritional metabolites: Origin, dissection, and application in crop breeding. Frontiers in Plant Science. 2019;10:1028. doi: 10.3389/fpls.2019.01028. [DOI] [PMC free article] [PubMed] [Google Scholar]
- Guo Y.-J., Luo X.-L., Wei M.-G., Liu Z.-L., Fan W.-J., Zhai R.-N., Zhu Y.-M. RNA sequence analysis of cassava varieties with high-starch content using de novo assembly. Journal of Plant Growth Regulation. 2018;37:517–529. doi: 10.1007/s00344-017-9749-8. [DOI] [Google Scholar]
- He, L., Liu, X., Liu, S., Zhang, J., Zhang, Y., Sun, Y., … Jia, X., Transcriptomic and targeted metabolomic analysis identifies genes and metabolites involved in anthocyanin accumulation in tuberous roots of sweetpotato (Ipomoea batatas L.). Plant Physiology and Biochemistry 156 (2020) 323-332. DOI:10.1016/j.plaphy.2020.09.021. [DOI] [PubMed]
- Kong Q., Yuan J., Gao L., Liu P., Cao L., Huang Y.…Bie Z. Transcriptional regulation of lycopene metabolism mediated by rootstock during the ripening of grafted watermelons. Food Chemistry. 2017;214:406–411. doi: 10.1016/j.foodchem.2016.07.103. [DOI] [PubMed] [Google Scholar]
- Kumar V., Rani A., Goyal L., Pratap D., Billore S.D., Chauhan G.S. Evaluation of vegetable-type soybean for sucrose, taste-related amino acids, and isoflavones contents. International Journal of Food Properties. 2011;14:1142–1151. doi: 10.1080/10942911003592761. [DOI] [Google Scholar]
- Leyva-Guerrero E., Narayanan N.N., Ihemere U., Sayre R.T. Iron and protein biofortification of cassava: Lessons learned. Current Opinion in Biotechnology. 2012;23:257–264. doi: 10.1016/j.copbio.2011.12.009. [DOI] [PubMed] [Google Scholar]
- Li S., Yu X., Lei N., Cheng Z., Zhao P., He Y.…Peng M. Genome-wide identification and functional prediction of cold and/or drought-responsive lncRNAs in cassava. Scientific Reports. 2017;7:45981. doi: 10.1038/srep45981. [DOI] [PMC free article] [PubMed] [Google Scholar]
- Liao Y., Smyth G.K., Shi W. featureCounts: An efficient general purpose program for assigning sequence reads to genomic features. Bioinformatics. 2014;30:923–930. doi: 10.1093/bioinformatics/btt656. [DOI] [PubMed] [Google Scholar]
- Love M., Huber W., Anders S. Moderated estimation of fold change and dispersion for RNA-seq data with DESeq2. Genome Biology. 2014;15:550. doi: 10.1186/s13059-014-0550-8. [DOI] [PMC free article] [PubMed] [Google Scholar]
- Mangel N., Fudge J., Fitzpatrick T., Gruissem W., Vanderschuren H. Vitamin B1 diversity and characterization of biosynthesis genes in cassava. Journal of Experimental Botany. 2017;68:3351–3363. doi: 10.1093/jxb/erx196. [DOI] [PMC free article] [PubMed] [Google Scholar]
- Montagnac J., Davis C., Tanumihardjo S. Nutritional value of cassava for use as a staple food and recent advances for improvement. Comprehensive Reviews in Food Science and Food Safety. 2009;8:181–194. doi: 10.1111/j.1541-4337.2009.00077.x. [DOI] [PubMed] [Google Scholar]
- Moorthy S., Wenham J., Blanshard J. Effect of solvent extraction on the gelatinization properties of starch and flour of five cassava varieties. Journal of the Science of Food and Agriculture. 1996;72:329–336. 0022-5142/96/S09.00 [Google Scholar]
- Perez A.G., Rios J.J., Sanz C., Olias J.M. Aroma components and free amino acids in strawberry variety Chandler during ripening. Journal of Agricultural and Food Chemistry. 1992;40:2232–2235. doi: 10.1021/jf00023a036. [DOI] [Google Scholar]
- Perez-Fons L., Bohorquez-Chaux A., Irigoyen M.L., Garceau D.C., Morreel K., Boerjan W.…Fraser P.D. A metabolomics characterisation of natural variation in the resistance of cassava to whitefly. BMC Plant Biology. 2019;19 doi: 10.1186/s12870-019-2107-1. [DOI] [PMC free article] [PubMed] [Google Scholar]
- Pertea M., Kim D., Pertea G.M., Leek J.T., Salzberg S.L. Transcript-level expression analysis of RNA-seq experiments with HISAT. StringTie and Ballgown. Nature Protocols. 2016;11:1650–1667. doi: 10.1038/nprot.2016.095. [DOI] [PMC free article] [PubMed] [Google Scholar]
- Sánchez T., Chávez A.L., Ceballos H., Rodriguez-Amaya D.B., Nestel P., Ishitani M. Reduction or delay of post-harvest physiological deterioration in cassava roots with higher carotenoid content. Journal of the Science of Food and Agriculture. 2006;86:634–639. doi: 10.1002/jsfa.2371. [DOI] [Google Scholar]
- Schmittgen T.D., Livak K.J. Analyzing real-time PCR data by the comparative CT method. Nature Protocols. 2008;3:1101–1108. doi: 10.1038/nprot.2008.73. [DOI] [PubMed] [Google Scholar]
- Shiraishi M., Fujishima H., Chijiwa H. Evaluation of table grape genetic resources for sugar, organic acid, and amino acid composition of berries. Euphytica. 2010;174:1–13. doi: 10.1007/s10681-009-0084-4. [DOI] [Google Scholar]
- Sun F., Chen H., Chen D.a., Tan H., Huang Y., Cozzolino D. Lipidomic changes in banana (Musa cavendish) during ripening and comparison of extraction by Folch and Bligh-Dyer methods. Journal of Agricultural Food Chemistry. 2020;68:11309–11316. doi: 10.1021/acs.jafc.0c04236. [DOI] [PubMed] [Google Scholar]
- Tappiban P., Smith D., Triwitayakorn K., Bao J. Recent understanding of starch biosynthesis in cassava for quality improvement: A review. Trends in Food Science & Technology. 2019;83:167–180. doi: 10.1016/j.tifs.2018.11.019. [DOI] [Google Scholar]
- Tieman D., Taylor M., Schauer N., Fernie A., Hanson A., Klee H. Tomato aromatic amino acid decarboxylases participate in synthesis of the flavor volatiles 2-phenylethanol and 2-phenylacetaldehyde. Proceedings of the National Academy of Sciences of the United States of America. 2006;103:8287–8292. doi: 10.1073/pnas.0602469103. [DOI] [PMC free article] [PubMed] [Google Scholar]
- Uarrota, V., Maraschin, M. (2015), Metabolomic, enzymatic, and histochemical analyzes of cassava roots during postharvest physiological deterioration. BMC Research Notes 8 648-648. DOI:10.1186/s13104-015-1580-3. [DOI] [PMC free article] [PubMed]
- Uarrota V.G., Moresco R., Coelho B., Nunes E.d.C., Peruch L.A.M., Neubert E.d.O.…Maraschin M. Metabolomics combined with chemometric tools (PCA, HCA, PLS-DA and SVM) for screening cassava (Manihot esculenta Crantz) roots during postharvest physiological deterioration. Food Chemistry. 2014;161:67–78. doi: 10.1016/j.foodchem.2014.03.110. [DOI] [PubMed] [Google Scholar]
- Untergasser, A., Cutcutache, I., Koressaar, T., Ye, J., Faircloth, B., Remm, M., Rozen, S. (2012), Primer3--new capabilities and interfaces. Nucleic Acids Research 40 e115-e115. DOI:10.1093/nar/gks596. [DOI] [PMC free article] [PubMed]
- Wang S., Alseekh S., Fernie A.R., Luo J. The structure and function of major plant metabolite modifications. Molecular Plant. 2019;12:899–919. doi: 10.1016/j.molp.2019.06.001. [DOI] [PubMed] [Google Scholar]
- Wang Y., Wu X., An Y., Xie H., Hao F., Tang H. Quantitative metabonomic phenotypes in different structures of Mung Bean (Vigna radiate) seeds and their germination-associated dynamic changes. J. Protemome Research. 2020;19:3352–3363. doi: 10.1021/acs.jproteome.0c00236. [DOI] [PubMed] [Google Scholar]
- Wang D., Zhang L., Huang X., Wang X., Yang R., Mao J.…Li P. Identification of nutritional components in black sesame determined by widely targeted metabolomics and traditional Chinese medicines. Molecules. 2018;23:1180. doi: 10.3390/molecules23051180. [DOI] [PMC free article] [PubMed] [Google Scholar]
- Wilson, M., Mutka, A., Hummel, A., Berry, J., Chauhan, R., Vijayaraghavan, A., … Bart, R. (2017), Gene expression atlas for the food security crop cassava. New Phytologist 213 1632-1641. DOI:10.1111/nph.14443. [DOI] [PMC free article] [PubMed]
- Yu G., Wang L.-G., Han Y., He Q.-Y. clusterProfiler: An R package for comparing biological themes among gene clusters. Omics: A Journal of. Integrative Biology. 2012;16:284–287. doi: 10.1089/omi.2011.0118. [DOI] [PMC free article] [PubMed] [Google Scholar]
- Yuan H., Zhang J., Nageswaran D., Li L. Carotenoid metabolism and regulation in horticultural crops. Horticulture Research. 2015;2:15036. doi: 10.1038/hortres.2015.36. [DOI] [PMC free article] [PubMed] [Google Scholar]
- Zhang L., Ma C., Chao H., Long Y., Wu J., Li Z.…Li M. Integration of metabolome and transcriptome reveals flavonoid accumulation in the intergeneric hybrid between Brassica rapa and Raphanus sativus. Scientific Reports. 2019;9 doi: 10.1038/s41598-019-54889-2. [DOI] [PMC free article] [PubMed] [Google Scholar]
Associated Data
This section collects any data citations, data availability statements, or supplementary materials included in this article.