

Abstract

Here, we present a Gaussian-based method for estimation of protein–protein binding entropy to augment the molecular mechanics Poisson–Boltzmann surface area (MM/PBSA) method for computational prediction of binding free energy (ΔG). The method is termed f5-MM/PBSA/E, where “E” stands for entropy and f5 for five adjustable parameters. The enthalpy components of ΔG (molecular mechanics, polar and non-polar solvation energies) are computed from a single implicit solvent generalized Born (GB) energy minimized structure of a protein–protein complex, while the binding entropy is computed using independently GB energy minimized unbound and bound structures. It should be emphasized that the f5-MM/PBSA/E method does not use snapshots, just energy minimized structures, and is thus very fast and computationally efficient. The method is trained and benchmarked in 5-fold validation test over a data set consisting of 46 protein–protein binding cases with experimentally determined dissociation constant Kd values. This data set has been used for benchmarking in recently published protein–protein binding studies that apply conventional MM/PBSA and MM/PBSA with an enhanced sampling method. The f5-MM/PBSA/E tested on the same data set achieves similar or better performance than these computationally demanding approaches, making it an excellent choice for high throughput protein–protein binding affinity prediction studies.
1. Introduction
Protein–protein interactions (PPIs) are involved in diverse kinds of cellular processes, and any deviation from the wild-type PPIs may be deleterious. Thus, aberrant PPIs have been associated with various diseases, including cancer, neurodegenerative, and infectious diseases.1−3 Understanding the nature of PPIs and responsible features lays a foundation for studying their association with diseases and reveals the molecular mechanism causing it.4−7 Revealing these assists development of pharmaceutical interventions to modulate disease-associated dysfunctional PPIs and restores the wild-type function.1,8−15 However, only a tiny fraction of existing PPIs has been experimentally explored mainly because of sophisticated experimental setup, high cost, and labor-intensive requirements.16−18 Cost-effective and less resource-demanding computational methods provide an alternative by predicting binding affinity (or binding free energy ΔG).19−23
Despite the efforts and advancement in the computational methodologies, prediction of absolute protein–protein ΔG is a very challenging venture; protein–protein ΔG predictions show low correlation with experimentally determined ΔG.21−29 The poor correlation between predicted and experimental ΔG stems from two factors: quality of experimental data30 and accuracy of computational methods.31 One can frequently observe that experimental ΔG values reported for the same PPI by different researchers do not agree.32−35 Typically, this is due to different experimental conditions or experimental techniques32−36 which are not clearly reported in the corresponding publication. On the other hand, computational methods suffer from structural imperfections, insufficient sampling, an inability to incorporate adequate experimental conditions,31,37 imperfections/shortcomings in the energy functions,38 and approximations and idealizations made in the statistical mechanics treatment.39
The protein–protein ΔG prediction methods can be broadly grouped into two categories depending on the information used for making the predictions: (i) sequence-based methods21,25 and (ii) structure-based methods.22,23,27 The sequence-based methods for predicting PPI affinity utilize the sequence information of the binding proteins by extracting sequence features/patterns, evolutionary information, physicochemical properties of amino acids, and so on, for the proteins in the benchmarking data set. A subset of the benchmarking data set called the training set is used to learn the relationships between various features and ΔG. This learning phase of model generation is called training. In the next phase, the learned associations of features with ΔG are used for benchmarking the predictions for the test set examples in the data set.21,25 The second class of methods utilizes the protein structure information for developing a model for ΔG predictions, which can further be divided into two classes: empirical methods22,27 and physics-based methods which vary in physical plausibility, computational cost, and accuracy.23,26 Among the physics-based methods, the thermodynamic integration (TI) and free energy perturbation (FEP) are expected to have high accuracy but are computationally costly40 and have thus been mostly used for receptor–ligand binding free energy calculations.41 Alternatively, methods like molecular mechanics Poisson–Boltzmann surface areas (MM/PBSA),42 molecular mechanics generalized Born surface areas (MM/GBSA),43 and linear interaction energy (LIE)44 are computationally less demanding but are expected to be less accurate.45 This inaccuracy stems from the traditional protocol that (a) does not account for entropy and (b) neglects the effect of explicit waters. With regard to entropy, the failures of the MM/PBSA or MM/GBSA methods are considered to be due to approximations made in the statistical mechanical treatment,46,47 approximations and limitations of the entropy methods,48 inability to do statistically converged sampling of all of the relevant conformations of the systems, and so on.45,49 Correction of the effects of explicit waters can be partially done via appropriate modeling of the dielectric function,50−53 although this will not correct for specific water molecules’ interactions with the macromolecules. To partially address these issues of the traditional MM/PBSA protocol, here we report a single frame f5-MM/PBSA method complemented with an estimator of entropy. It is important to note that the method does not use snapshots taken from MD simulations; rather, it uses only the energy minimized structures of the complex and monomers.
The goal of this work is to develop a fast and accurate protocol for computing the absolute ΔG via calculating the average enthalpy and entropy associated with the binding. The Boltzmann averaged enthalpy in the traditional MM/PBSA method is calculated as the average of enthalpy over the frames (snapshots) taken from the corresponding MD simulations. This requires long MD simulations and sequential intensive energy modeling. However, we have shown in several works that energy minimized structures provide solvation energy which is very similar to the solvation energy obtained over an ensemble of MD snapshots.51,54,55 This is true for both traditional two-dielectric PB and Gaussian-based PB.50−52 We will use this observation in the current protocol and will model the enthalpy using a single frame, the energy minimized X-ray structure.
The second component of the method is the evaluation of entropy change caused by the binding. This is important, since proteins are not static molecules and, frequently, they experience significant conformational changes upon the binding. Thus, neglecting entropy in the protocol that predicts ΔG could have a large effect on the accuracy of the method.26 However, the evaluation of the change of entropy due to binding (or any other process) is not a trivial task. Most often, the entropy estimation requires extensive phase space sampling, through molecular dynamics (MD) simulations for the complex and the unbound monomers with simulation times often up to several microseconds.56−58
The application of parametric configurational entropy methods, e.g., normal mode analysis59 (NMA), quasi-harmonic analysis60 (QHA), and multiscale cell correlation61 (MCC), requires comparably lesser conformational sampling (usually several 100 ns to microseconds MD simulations); however, they fail to account for anharmonicity and multimodality of atomic fluctuations. Furthermore, these methods are still very computationally intensive to be applicable for large-scale calculations. Recently, a method called interaction entropy62 has also been reported which computes entropy from the fluctuations of interaction energies, bypassing the diagonalization of the Hessian matrix (in NMA) or coordinate covariance matrix (in QHA). However, it also requires the MD simulations to find the distributions of interaction energies. In addition to the above-mentioned methods which utilize the forces and fluctuation of atomic positions, a molecular-geometry-based method, the “solvent-accessible-surface-area-based method”, for estimating conformational entropy was also reported.63 However, this method also requires conformational sampling via MD simulations. The list of entropy estimation methods can be further extended, but practically all existing methods require significant simulation time. Here, we present a method that does not require extensive conformational sampling and thus is very fast. The proposed method uses the energy minimized structure of the protein–protein complex and corresponding unbound monomers. It is based on the Gaussian-based PB approach, where the density of protein molecules is modeled as a function of the atomic packing. Thus, in the core of the solute, the density is high and the ability of side chains to sample different conformations is highly restricted. In contrast, in low density regions, the residues are capable of sampling different conformations, since there is room for side chain reorientation. Thus, in this work, the entropy change upon complex formation is then estimated via the change of accessible side chain rotamers evaluated with Gaussian-based density calculations from unbound to bound states.
The method, f5-MM/PBSA/E (where E stands for entropy and f5 stands for five adjustable parameters), is benchmarked against a set of experimental ΔG values frequently used to assess the performance of ΔG predictors,23,26 and it is shown that the inclusion of entropy greatly improves the accuracy of predictions.
2. Results and Discussion
To check the sensitivity of results with respect to enthalpic and entropic contributions, we explored three energy formulas, as described by eqs 1–3. This was done to see the sensitivity of the results with respect to the different energy components, emphasizing the entropy component. Furthermore, the sensitivity of the results was tested for the solvation models, and three generalized Born (GB) models were utilized. The predictions done with each energy formula and GB model were tested against the data set PPI-46 (see the Materials and Methods section). Furthermore, the effects of other parameters, the value of the internal dielectric constant and the variance of the Gaussian distribution, were also tested by systematically varying them and predicting ΔG compared with experimental ones. Here, we assess the performance via comparing the performance of the three energy formulas via multiple linear regression (MLR). In contrast to the standard MM/PBSA model, these models are three-, four-, and five-parameter fitted models as expressed in eqs 1–3. To reflect it, we call these models f3-MM/PB (eq 1: model 1), f4-MM/PBSA (eq 2: model 2), f5-MM/PBSA – TΔSGaussianEntropy, or f5-MM/PBSA/E (eq 3: model 3).
| 1 |
| 2 |
| 3 |
Additionally, we used all three energy models over the PPI-46 data set for all three GB models for 5-fold repeated cross-validation, where 80% of the cases are randomly selected as a training set and the remaining are held for testing the model performance. The process is repeated 25 times, and the analysis results are discussed.
2.1. Benchmarks for the PPI-46 Data Set
We have evaluated the three energy models, f3-MM/PB, f4-MM/PBSA, and f5-MM/PBSA/E, over the PPI-46 benchmarking data set. The GBneck2 minimized structures performed best (for modeling enthalpy components) in terms of the Pearson correlation coefficient (PCC) and root mean squared error (RMSE) for all three models shown in Figure 1. Therefore, here we will discuss results only for the GBneck2 energy minimized structures set in the data set in detail for modeling enthalpy. At the same time, the effect of all three GB models will be presented in the case of entropy.
Figure 1.
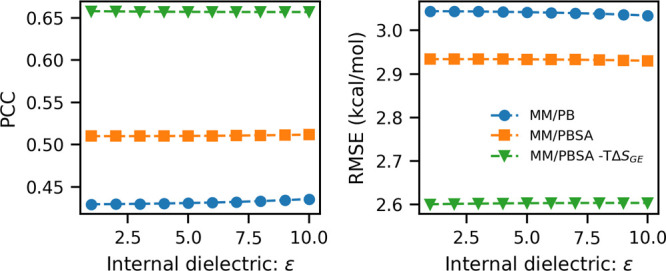
Summary of the performance of the three energy models (model 1, f3-MM/PB, i.e., eq 1; model 2, f4-MM/PBSA, i.e., eq 2; model 3, f5-MM/PBSA–TΔSGE, i.e., eq 3) with varying internal dielectric constant for the GBneck2 energy minimized set of structures of the PPI-46 benchmarking data set. (a) PCC vs internal dielectric constant value; (b) RMSE vs internal dielectric constant value.
We observe that model 1, which considers only ΔGMM and ΔGPB energy terms shows the lowest PCC = 0.429 and largest RMSE = 3.044 kcal/mol for solute dielectric constant ϵin = 1. Here slight improvement in the performance is observed when ϵin is varied from 1 to 10, as PCC goes to 0.436 from 0.429 and RMSE comes down to 3.034 kcal/mol from 3.044 kcal/mol. However, when the non-polar solvation energy term ΔGnon-polar is also included in it, i.e., model 2, not only does the performance of the model improve (increases the PCC to 0.51 and decreases the RMSE to 2.934 kcal/mol), but the effect of variation of solute dielectric constant is also absorbed. After that, we investigated the performance of model 3 which includes Gaussian-based binding entropy along with ΔGMM, ΔGPB, and ΔGnon-polar. We found that after the inclusion of entropy the prediction accuracy improves significantly, as PCC increases to 0.658 kcal/mol and RMSE decreases to 2.60 kcal/mol (Table 1). The constant coefficients in the models are summarized in Table 2. This implies that Gaussian-based entropy captures important information about the protein–protein binding which is missing in the conventional MM/PBSA. In this data set, we did not find any influence of variation of salt concentration on the performance of models evaluated in terms of PCC and RMSE (we varied the salt concentration from 0 to 0.3 M in increments of 0.02 M).
Table 1. Performance of Tested Energy Models and GB Model Combinations over the PPI-46 Data Seta.
| model 1b |
model 2c |
model 3d |
||||
|---|---|---|---|---|---|---|
| GB modele | PCCf | RMSEg | PCC | RMSE | PCC | RMSE |
| OBC-II | 0.423 | 3.054 | 0.498 | 2.957 | 0.593 | 2.779 |
| GBneck | 0.425 | 3.051 | 0.503 | 2.948 | 0.631 | 2.678 |
| GBneck2 | 0.429 | 3.044 | 0.510 | 2.934 | 0.658 | 2.600 |
Results of benchmarking the performance of three energy models (eqs 1–3) and the GB model used in energy minimizations are summarized for the PPI-46 data set with ϵin = 1; all of the RMSEs are reported in kcal/mol.
Generalized Born model used in energy minimization of the structures.
Pearson correlation coefficient.
Root mean squared error.
Table 2. Parameter Constant Coefficients in Models 1–3a.
| constant
coefficient parameter |
||||||
|---|---|---|---|---|---|---|
| GBb | EMc | c1 | c2 | c3 | c4 | c5 |
| OBC-II | model 1d | –9.515405 | 0.000148 | –0.001327 | ||
| model 2e | –7.151102 | 0.000159 | –0.000811 | 0.283298 | ||
| model 3f | –12.505926 | 0.000182 | –0.001518 | 0.971501 | 0.738526 | |
| GBneck | model 1 | –9.525939 | 0.000155 | –0.001369 | ||
| model 2 | –7.129749 | 0.00016 | –0.000882 | 0.288981 | ||
| model 3 | –11.449473 | 0.000184 | –0.001839 | 0.897985 | 0.680234 | |
| GBneck2 | model 1 | –9.511868 | 0.000153 | –0.0013835 | ||
| model 2 | –7.038626 | 0.000161 | –0.000852 | 0.296255 | ||
| model 3 | –12.070194 | 0.000147 | –0.001632 | 1.049871 | 0.777386 | |
We compare our results with other studies using the MM/PBSA protocol for the same data set64 to assess the performance of our method. Fu Chen et al. reported a MM/PB(GB)SA study over the same data set (PPI-46) using ff99, ff02, ff03, and ff14SB force fields, various ϵin values of 1, 2, 4, and 6, and implicit water and explicit water minimization and MD simulations and assessing the performance using a linear regression where the total binding energy predicted from their method is regressed against the experimental binding energy. This study found that MM/PBSA gives the best PCC value of 0.523, when the force field is ff03 and minimization is done in implicit water.64 We achieved a higher value of PCC = 0.658 over the same data set from single energy minimized structures using MM/PBSA combined with the Gaussian-based binding entropy (see Figure 2). However, here we used a different variation of standard MM/PBSA, which we denote as f5-MM/PBSA/E. All benchmarking results are summarized in Table 1.
Figure 2.

Summary of the performance of the three energy models at ϵin = 1 for the GBneck2 energy minimized set of structures of the PPI-46 benchmarking data set. Scatter plots are shown of predicted vs experimental for (left panel) model 1, (middle panel) model 2, and (right panel) model 3.
It should be noted that Gaussian entropy does not depend on solute dielectric and salt concentration, as it depends only on the local mean Gaussian densities. However, it depends on the Gaussian variance σ of the Gaussian dielectric model which is implemented in the Poisson–Boltzmann equation (PBE) solver DelPhi,65 the cutoff radius used to define the local region around the atoms, and the decay rate parameter r in exponential interpolation which controls the curvature of the interpolation curve (Figure 7a). The σ and cutoff radius parameters affect the mean Gaussian density computation, while r influences the number of effective conformations during the interpolation step of the method. Therefore, we also investigated the influence of parameters related to the Gaussian-density-based method of binding entropy estimation. The three related parameters—σ, the cutoff radius for defining the local region around the atoms, and the decay rate parameter r—are varied. The results of the variation of these parameters on the performance of model 3 are presented in Figure 3.
Figure 7.
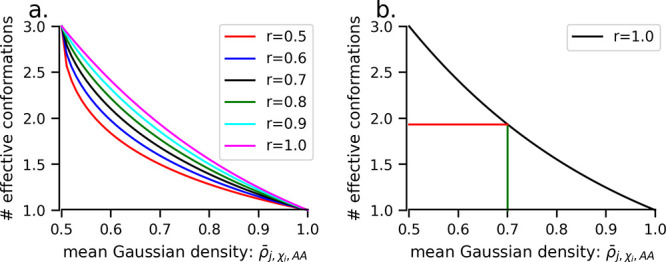
Illustration of the interpolation scheme. (a) The effect of the value of the decay rate parameter, r, on the curvature of the exponential decay curve. (b) Illustration of obtaining the number of effective conformations for an example case where the maximum conformations is 3 at a minimum mean Gaussian density of 0.5, with the number of effective conformations (≈2) corresponding to a mean Gaussian density of 0.7 shown.
Figure 3.

Influence of variation of the parameters Gaussian variance σ (a and b), cutoff radius for atom surrounding (c and d), and decay rate r (e and f) for Gaussian binding entropy on the PCC (a, c, and e) and RMSE (b, d, and f) of model 3 for the PPI-46 data set.
In the PPI-46 data set, the performance of model 3 improves with increasing values of the Gaussian variance parameter, which was varied from 1.0 to 1.30 in increments of 0.05. We obtained best results when σ = 1.20 (Figure 3a,b). Similarly, on varying the cutoff radius from 3.0 to 8.0 Å in steps of 0.5 Å, we observe improvement in the performance of model 3 which increases initially and after 3.5–4.0 Å starts decreasing with increasing cutoff radius (Figure 3c,d). The decay rate parameter for the exponential interpolation curve r used to infer the number of effective conformations as a function of the mean Gaussian density of the relevant atoms of a given side chain torsion χi of some residue j which is an amino acid AA is also systematically varied and the performance is tested. We obtained the best correlation at r = 0.8, when we varied it from 0.5 to 1.2 in increments of 0.1 (Figure 3e,f). In summary, we reached the optimal parameters for Gaussian-density-based binding entropy for the PPI-46 data set which are σ = 1.20, cutoff radius = 4.0 Å, and decay rate of interpolation curve r = 0.8. The best GB model for the PPI-46 data set is GBneck2; however, the effect on performance is small and PCC and RMSE are comparable among the GB models.
2.2. 5-Fold Cross-Validation of Models
After discussing the performance of the protocol on the whole PPI-46 data sets, we would like to discuss the validation of the protocol. The whole data set must be split into disjoint training and testing data sets for performance assessment. Considering the small size of the PPI-46 data set, we start by splitting the PPI-46 data set into the training set (80% randomly selected) and the remaining as the testing set. The process is repeated 25 times to give 25 different training and associated testing sets. The cases in the training set are used to find the parameter values for the f3-MM/PB, f4-MM/PBSA, and f5-MM/PBSA/E models for all three sets of GB energy minimized structures (using OBC-II, GBneck, and GBneck2), and these parameter values are used for making predictions for testing set cases. The PCC and RMSE values over the training and testing sets are recorded for each repetition, and average and standard deviations of values are tabulated (Table 3) and discussed hereafter.
Table 3. Summary of Cross-Validation Results of the Combinations of Three Energy Models and the GB Model Used for Energy Minimizationa.
| training |
testing |
||||
|---|---|---|---|---|---|
| GBb | EMc | PCC | RMSE | PCC | RMSE |
| OBC-II | model 1d | 0.440 ± 0.045 | 3.065 ± 0.104 | 0.496 ± 0.241 | 3.245 ± 0.672 |
| model 2e | 0.513 ± 0.044 | 2.968 ± 0.094 | 0.519 ± 0.178 | 3.295 ± 0.832 | |
| model 3f | 0.596 ± 0.040 | 2.818 ± 0.098 | 0.651 ± 0.151 | 2.958 ± 0.894 | |
| GBneck | model 1 | 0.442 ± 0.045 | 3.061 ± 0.106 | 0.495 ± 0.242 | 3.246 ± 0.678 |
| model 2 | 0.520 ± 0.044 | 2.955 ± 0.098 | 0.522 ± 0.182 | 3.313 ± 0.867 | |
| model 3 | 0.653 ± 0.042 | 2.657 ± 0.151 | 0.609 ± 0.205 | 3.175 ± 1.130 | |
| GBneck2 | model 1 | 0.447 ± 0.045 | 3.053 ± 0.106 | 0.503 ± 0.241 | 3.255 ± 0.694 |
| model 2 | 0.527 ± 0.044 | 2.941 ± 0.010 | 0.529 ± 0.180 | 3.306 ± 0.884 | |
| model 3 | 0.675 ± 0.040 | 2.586 ± 0.135 | 0.653 ± 0.151 | 3.091 ± 1.103 | |
As shown in Table 3, the f3-MM/PB (model 1) shows the mean PCC between 0.440 and 0.447 for all three GB minimized structure sets for the training sets, RMSE is between 3.065 and 3.053 kcal/mol, and there are similar average values of PCC and RMSE also for the testing sets (Table 3). The four-parameter model f4-MM/PBSA (model 2) shows better performance in terms of PCC (higher) and RMSE (smaller). After inclusion of entropy as in the f5-MM/PBSA/E (model 3), we consistently observe a significant increase in PCC and decrease in RMSE for all three sets of GB minimized structures across the training and testing sets (Table 3). The improvement for both the training and testing set performance implies that Gaussian entropy provides important information about the binding which is missing in f4-MM/PBSA, and thus, the improvement is not merely due to the increased number of parameters used in the model.
2.3. Computation Time
To analyze the computational requirements of the Gaussian-based method of entropy reported here, we recorded the execution time for all of the protein–protein cases in the PPI-46 data set. The computations are performed on compute nodes of the Palmetto Cluster of Clemson University. The nodes used for computation have Intel Xeon E5520 processors which have 8 MB cache and 2.26 GHz frequency. All of the jobs are run on a single core of a node, and the maximum memory reserved for a job was 24 GB. The computations were run three times for each case, and the average times taken in minutes vs the number of residues in the protein–protein complex are shown in Figure 4. Each of these involves running three DelPhi runs and associated Gaussian-based entropy computation for the complex, and the corresponding two unbound proteins.
Figure 4.
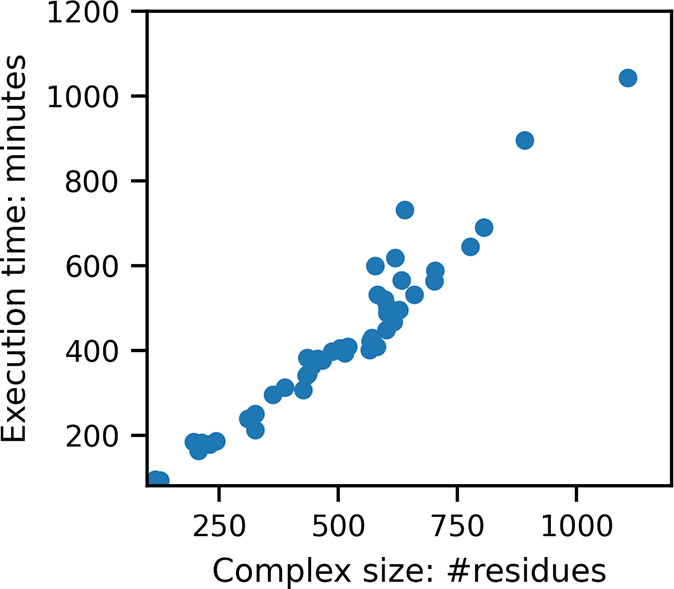
Number of residues in the protein–protein complex vs total computation time for running DelPhi and computing entropy from the Gaussian-density map data.
As shown in Figure 4, the data set contains a very wide range of sizes of protein–protein complexes varying from 116 to 1107 residues. For all of the cases, the total computation time taken in minutes is linearly related to the size of the complex. These computations do not require parallel processing and are very computation time and memory efficient. Thus, these can be performed even on standard desktops, in contrast to other entropy methods which require significantly higher computation resources and time.
3. Materials and Methods
3.1. Overview of the Method
The proposed method combines MM/PBSA with an estimator of entropy. It does not use multiple structures obtained via MD simulations, but rather, it deals with a single structure (Figure 5). Thus, the enthalpy components, the MM/PBSA energies, were computed using the energy minimized 3D structure of the protein–protein complex and utilizing a rigid-body approach; i.e., the structures of unbound monomers were taken from the energy minimized 3D structure of the complex. Thus, the bonded energy cancels out and is not calculated (Figure 5a). In parallel, we tested a protocol that does independent energy minimization of separated monomers. However, the results were found to be less accurate (data not shown) than the rigid-body approach, and thus, in the rest of the paper, we present only the results obtained with enthalpy components modeled with the rigid-body protocol. In the case of entropy estimation, it was found that the rigid-body protocol does not perform well, and thus, the structures of the monomers were energy minimized independently from the energy minimization of the complex and used for entropy change calculations (Figure 5b). Further discussion is provided in the conclusions section of the manuscript.
Figure 5.

Schematic representation of protocols used for computing enthalpy and entropy components of protein–protein binding free energy. (a) The enthalpy energy components are computed over the energy minimized complex structure, and monomers are extracted from it. (b) The entropy estimation is done in a protocol that the complex and two monomers are energy minimized independently.
3.2. Benckmarking Data Set
In the present work, we will be using a binding affinity benchmarking data set of 46 protein–protein experimental ΔG values published by Kastritis et al.28,66 This data set lists the PDB ID of the structure, chains of protein 1 and protein 2, equilibrium dissociation constant Kd, experimental temperature, and pH for most of the cases. The PDB IDs, chains of proteins, and pKd values are provided in the Supporting Information (Table S1). This data set has been used for benchmarking MM/PBSA and MM/GBSA methods in combination with several force fields.64 We will refer to this data set as PPI-46 from now on. This data set covers a broad range (10 orders of magnitude) of experimental binding affinities.
3.3. Structure Preparation and Minimization
The structures of the protein–protein complexes in the PPI-46 data set were downloaded from the RCSB Protein Data Bank,67,68 and chains mentioned in the data set were extracted. All of the water and hetero atoms were deleted from the structures. All titratable residues were protonated according to the neutral pH state, and all of the histidine residues were kept neutral by placing a proton at the epsilon position. The charges and parameters were kept consistent with the AMBER ff14SB69 force field. For structure minimizations, we have used three OBC-II,70 GB-neck,71 and GB-neck272 implicit solvent generalized Born (GB) models implemented in AMBER.73 The parameter+topology (.prmtop) and starting coordinate (.inpcrd) files were created using the LEaP program in AmberTools18.73 The starting structures were energy minimized using each of the three GB models to yield three sets of structures for protein–protein complexes. The energy minimization is performed in two stages first while restraining all of the heavy atoms using a 10 kcal·mol–1·Å–2 harmonic potential for 8000 steps of steepest descent (SD) and 2000 steps of conjugate gradient (CG) followed by 8000 steps of SD and 2000 CG without restraint. We have used the rigid-body protocol for the computation of enthalpy components of the MM/PBSA approach, and the unbound protein structures were extracted from the energy minimized complex structures. However, the entropy component of the binding energy which has great sensitivity to conformational changes upon complex formation24,74,75 was estimated from separately minimized unbound proteins and complexes. The unbound protein structures were extracted from each complex in the data set prior to energy minimization of the complex. These structures were also prepared and energy minimized using the same protocol to yield three sets corresponding to the above-mentioned three GB models.
3.4. Binding Free Energy Computation (Enthalpy Component)
| 4 |
| 5 |
| 6 |
Here, the molecular mechanics (MM) part of the binding energy (ΔGMM) is computed using the rigid-body protocol so ΔGbonded = 0. The unbound protein structures are extracted from the energy minimized structure of the complex by removing the partner protein. The nonbonded terms of the binding energy (ΔGnonbonded) and polar solvation energy (ΔGpolar) are computed using the popular numerical Poisson–Boltzmann equation solver DelPhi65,76 employing the traditional two-dielectric model using charge and radii from the AMBER ff14SB69 force field, a grid spacing of 0.5 Å, the longest solute dimension filling of 70% of the grid box, and a solvent dielectric constant of 80; hence, it will be referred to as ΔGPB hereafter. The traditional two-dielectric model was applied instead of the Gaussian-based model50,52,77 because the Gaussian-based atomic density model is used to estimate the entropy as outlined below. The solute dielectric constant and the salt concentration are varied to study the influence of these parameters on the prediction accuracy of the method. The non-polar solvation energy (ΔGnon-polar) is estimated from the change of the solvent accessible surface area (SASA) (eq 7).
| 7 |
The change in SASA (ΔSASA) is computed as the difference of the SASA of unbound proteins from complex in Å2; the surface tension γ = 0.00542 kcal·mol–1·Å–2 and the correction term b = 0.92 kcal/mol are used. The SASA with a solvent probe radius of 1.4 Å is computed using Visual Molecular Dynamics.78
3.5. Estimation of Entropy Change upon Binding
The basic idea is to estimate the change of the side chain entropy change upon the binding by evaluating the accessible rotamers of the corresponding amino acids in monomeric versus bound states. To avoid the complexity associated with continuum conformation space, each amino acid side chain is considered to have a finite number of rotamers taken from Dunbrack library of rotamers.79 When an amino acid is free in the water phase, it is considered that its side chain can sample all rotamers provided in the Dunbrack library79 (see the left panel in Figure 6). When it is part of the bound structure (protein–protein complex) or unbound structure (protein structure obtained after removing the binding partner structure from the complex), not all rotamers are accessible because of the presence of atoms of neighboring residues (right panel in Figure 6b). Thus, the change of accessible rotamers from unbound to bound states for each amino acid of the proteins forming a complex is used to estimate the entropy change upon the binding. Below, we outline the details about (i) modeling atomic density (which will be used to decide if a rotamer is accessible or not), (ii) building a reference library of atomic densities for free amino acids, and (iii) estimation of accessible rotamers.
Figure 6.
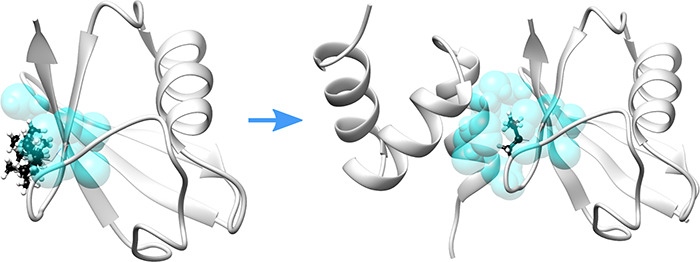
A schematic representation of the idea of Gaussian-based entropy. An ILE residue of a protein is shown in black and white ball and stick. Neighboring atoms in radius 4 Å are shown with semitransparent cyan spheres. Left panel: all possible side chain conformations of ILE in unbound protein. Right panel: only one rotamer of the same ILE is accessible due to the presence of neighboring atoms of the binding partner.
(i) Modeling Atomic Density: Here we build upon our previously proposed Gaussian-density-based model of atoms.50,52 In the Gaussian-based model of an atom, an atom is represented as a probability density ρi(r⃗) at any arbitrary point r⃗ in space due to the ith atom, the ρi(r⃗) is maximum, i.e., 1 at its center, and it decreases according to a Gaussian distribution as we move away from it (eq 8 and Figure S1). In a multiatomic molecule, the Gaussian density at any point in space r⃗ is resultant of atomic densities due to all of the atoms (eq 9)
| 8 |
where Ri is the van der Waals radius of the ith atom and σ is the variance of the Gaussian distribution.
| 9 |
The Gaussian density varies from 0 to 1 in space and expresses the extent of atomic packing; a value of 0 corresponds to a point where there are no atoms of the molecule and 1 corresponds to centers of atoms of the molecule, with any other value in the range corresponding to a higher density of atoms for a higher Gaussian density.
(ii) Building a Reference Gaussian Density Library: The ability to occupy different conformational states for each side chain torsion angle of each amino acid (AA) is hindered due to spatial packing around the corresponding atoms. Thus, the first step is to identify atoms that participate in the side chain torsion angles of each of 20 standard amino acids (Table S2 in the Supporting Information). Then, the average Gaussian density is computed using the 3D structure of the isolated amino acid and applying the Gaussian subroutine implemented in the PBE solver DelPhi.65 The mean Gaussian density is computed as the average of Gaussian densities on all of the grid points in a cutoff radius (say 5 Å) from the center of all relevant atoms (as described above) to χi of a given AA and averaged to obtain the mean Gaussian density (ρ̅χi,AA). The ρ̅χi,AA computed from the isolated amino acid structure is called the minimum mean Gaussian density minρ̅χi,AA. The maximum number of conformations to a given χi of amino acid AA, i.e., nConfχi,AA, is obtained from the Dunbrack rotamer library.79 The pair of minρ̅χi,AA and nConfχi,AA for each χi of each amino acid AA is saved in the library for later use for obtaining the effective number of conformations via interpolation.
(iii) Computation of Effective Number of Conformations: The corresponding protein structure (the bound and unbound structures/structure of protein obtained after removing the binding partner structure from the complex; see Figure 5b) is energy minimized using the protocol described above. The mean Gaussian density ρ̅j,χi,AA for each χi of each residue j is computed. Then, an effective number of conformations is obtained by the exponential interpolation scheme (Figure 7b) having two boundary points: (a) the maximum number of conformations (maxnConfχi,AA) that are available in isolated residue AA for side chain torsion χi and the yield associated mean Gaussian density termed “minimum mean Gaussian density” and (b) the minimum number of conformations (minnConfχi,AA), i.e., 1 when the mean Gaussian density is the maximum possible value of 1. The increase in ρ̅j,χi,AA in protein w.r.t. minρ̅χi,AA due to more compact “dense” surrounding relevant atoms causes a decrease in the effective number of conformations as expressed in eq 10
| 10 |
where d = (ρ̅j,χi,AA – minρχi,AA)/(1 – minρχi,AA), k = log(maxnConfχi,AA/minnConfχi,AA), a = 1/exp(−k), and r is the decay rate parameter of the interpolation curve (Figure 7a).
The effective number of conformations of every side chain torsion χi of the residue j which is amino acid AA are multiplied to obtain the effective number of conformations of the residue in the protein (eq 11).
| 11 |
Finally, we take the logarithm of the effective number of conformations nConfj,AA of the residue j to get its entropy Sj in the protein (eq 11). The sum of the entropy of all of the residues in the protein yields the entropy of the protein (eq 13).
| 12 |
| 13 |
| 14 |
Thus, the entropies of the protein–protein complex Scomplex and unbound proteins Sprotein1 and Sprotein2 are computed and then the binding entropy (ΔSbind) is obtained via subtracting the sum of entropy of unbound proteins from that of the complex (eq 14).
4. Conclusions
In this work, we presented a Gaussian-density-based method for estimation of the entropy change caused by protein–protein binding. This method hypothesizes that isolated amino acid side chains are free to rotate and occupy all of the accessible conformations equiprobably; however, this ability is restricted to a certain extent due to increased atomic packing (estimated via Gaussian density) when the amino acid is a part of a protein or a protein–protein complex. Thus, the change of accessible conformers from unbound to bound states is used to estimate the entropy change induced by the binding. Combining the entropy change with MM/PBSA enthalpic components resulted in the f5-MM/PBSA/E method which was tested on a popular data set PPI-46. It is important to mention that the MM/PBSA/E method uses energy minimized structures of the complex and unbound monomers only, not snapshots obtained via MD simulations, and thus, it is fast and less computationally demanding than traditional MM/PBSA methods. Despite that, the f5-MM/PBSA/E method achieves a similar or better performance than other methods, as benchmarked against experimentally determined ΔG values from the PPI-46 data set.
The protocol, the f5-MM/PBSA/E, considers both enthalpic and entropic contributions to the free energy of binding. However, the optimal conditions for modeling enthalpic and entropic components were found to be different: the best performance was obtained with the rigid-body protocol for enthalpic component calculations, while the optimal performance for the entropic component was achieved when bound and unbound structures were independently energy minimized. The main reason why the rigid-body approach worked better for enthalpic components modeling was the cancellation of bonded interactions. Our attempt to use independently minimized bound and unbound structures for enthalpic calculations resulted in large “bonded interaction” energies which dominated all other components. In contrast, the best performance in estimating the entropy change caused by the binding was found when one uses independently minimized bound and unbound structures. This observation reflects the nature of the Gaussian-based method for entropy estimation, which is geometry-based. Thus, small structural changes caused by independently minimizing bound and unbound structures have a significant effect on the entropy change calculations. This indicates that further improvement may be expected if one extends the Gaussian-based entropy estimator method to include backbone changes from unbound to bound states.
Acknowledgments
We acknowledge the Palmetto Cluster, Clemson University, for providing computational resources. We thank Shannon Bonomi for proofreading the manuscript. The work was supported by a grant from NIH, grant number R01GM093937.
Supporting Information Available
The Supporting Information is available free of charge at https://pubs.acs.org/doi/10.1021/acsomega.1c07037.
Figure S1, the variation of Gaussian density around an atom as a function of distance from the center and the impact of the change of the Gaussian variance parameter on the modeled atom density; Table S1, the table of PDB ID, protein chains, and pKd of protein–protein complexes in PPI-46; Table S2, information of relevant atoms for each side chain torsion of each amino acid (PDF)
Author Contributions
S.K.P. designed the computational study and carried the computational work. E.A. supervised the work. All authors have given approval to the final version of the manuscript.
The authors declare no competing financial interest.
Notes
All of the data and software used in this work can be accessed from the following URLs: All of the PDB files used in this work were downloaded from the RCSB Protein Data Bank (https://www.rcsb.org/). All of the structure preparation for energy minimizations and energy minimizations discussed in this work were performed using open source AmberTools18 (version 18), the latest version of which can be obtained from (https://ambermd.org/GetAmber.php#ambertools) free of charge by following the instructions provided on the page. All of the Poisson–Boltzmann equations are solved using a Poisson–Boltzmann equation solver, DelPhi C++ (version 8.5), which can be obtained from http://compbio.clemson.edu/lab/delphisw/ by accessing the Delphi Download menu, providing user information, and following the instructions provided. The Gaussian-based entropy is calculated using an in-house python script. The script and the library of minimum mean Gaussian densities for ff14SB force fields for OBC-II (igb = 5), GBneck (igb = 7), and GBneck2 (igb = 8) GB models are available free of charge from http://compbio.clemson.edu/media/download/gaussian-based-entropy.tar as an archive.
Supplementary Material
References
- Lu H.; Zhou Q.; He J.; Jiang Z.; Peng C.; Tong R.; Shi J. Recent advances in the development of protein–protein interactions modulators: mechanisms and clinical trials. Signal Transduct. Target. Ther. 2020, 5, 213. 10.1038/s41392-020-00315-3. [DOI] [PMC free article] [PubMed] [Google Scholar]
- White A. W.; Westwell A. D.; Brahemi G. Protein–protein interactions as targets for small-molecule therapeutics in cancer. Expert Rev. Mol. Med. 2008, 10, e8 10.1017/S1462399408000641. [DOI] [PubMed] [Google Scholar]
- Rosell M.; Fernández-Recio J. Hot-spot analysis for drug discovery targeting protein-protein interactions. Expert Opin. Drug Discovery 2018, 13, 327–338. 10.1080/17460441.2018.1430763. [DOI] [PubMed] [Google Scholar]
- Ryan D. P.; Matthews J. M. Protein-protein interactions in human disease. Curr. Opin. Struct. Biol. 2005, 15, 441–446. 10.1016/j.sbi.2005.06.001. [DOI] [PubMed] [Google Scholar]
- Lage K. Protein-protein interactions and genetic diseases: The interactome. Biochim. Biophys. Acta - Mol. Basis Dis. 2014, 1842, 1971–1980. 10.1016/j.bbadis.2014.05.028. [DOI] [PMC free article] [PubMed] [Google Scholar]
- Kuzmanov U.; Emili A. Protein-protein interaction networks: Probing disease mechanisms using model systems. Genome Med. 2013, 5, 37. 10.1186/gm441. [DOI] [PMC free article] [PubMed] [Google Scholar]
- Yeger-Lotem E.; Sharan R. Human protein interaction networks across tissues and diseases. Front. Genet. 2015, 6, 1–5. 10.3389/fgene.2015.00257. [DOI] [PMC free article] [PubMed] [Google Scholar]
- Voter A. F.; Keck J. L.. Advances in Protein Chemistry and Structural Biology, 1st ed.; Elsevier, Inc.: 2018; Vol. 111, pp 197–222. 10.1016/bs.apcsb.2017.07.005. [DOI] [PMC free article] [PubMed] [Google Scholar]
- Dorr P.; Westby M.; Dobbs S.; Griffin P.; Irvine B.; Macartney M.; Mori J.; Rickett G.; Smith-Burchnell C.; Napier C.; Webster R.; Armour D.; Price D.; Stammen B.; Wood A.; Perros M. Maraviroc (UK-427,857), a potent, orally bioavailable, and selective small-molecule inhibitor of chemokine receptor CCR5 with broad-spectrum anti-human immunodeficiency virus type 1 activity. Antimicrob. Agents Chemother. 2005, 49, 4721–4732. 10.1128/AAC.49.11.4721-4732.2005. [DOI] [PMC free article] [PubMed] [Google Scholar]
- Korycka-Wolowiec A.; Wolowiec D.; Kubiak-Mlonka A.; Robak T. Venetoclax in the treatment of chronic lymphocytic leukemia. Expert Opin. Drug Metab. & Toxicol. 2019, 15, 353–366. 10.1080/17425255.2019.1606211. [DOI] [PubMed] [Google Scholar]
- Reck M.; Rodríguez-Abreu D.; Robinson A. G.; Hui R.; Csőszi T.; Fülöp A.; Gottfried M.; Peled N.; Tafreshi A.; Cuffe S.; O’Brien M.; Rao S.; Hotta K.; Leiby M. A.; Lubiniecki G. M.; Shentu Y.; Rangwala R.; Brahmer J. R. Pembrolizumab versus Chemotherapy for PD-L1–Positive Non–Small-Cell Lung Cancer. N. Engl. J. Med. 2016, 375, 1823–1833. 10.1056/NEJMoa1606774. [DOI] [PubMed] [Google Scholar]
- Borghaei H.; Paz-Ares L.; Horn L.; Spigel D. R.; Steins M.; Ready N. E.; Chow L. Q.; Vokes E. E.; Felip E.; Holgado E.; Barlesi F.; Kohlhäufl M.; Arrieta O.; Burgio M. A.; Fayette J.; Lena H.; Poddubskaya E.; Gerber D. E.; Gettinger S. N.; Rudin C. M.; Rizvi N.; Crinò L.; Blumenschein G. R.; Antonia S. J.; Dorange C.; Harbison C. T.; Graf Finckenstein F.; Brahmer J. R. Nivolumab versus Docetaxel in Advanced Nonsquamous Non–Small-Cell Lung Cancer. N. Engl. J. Med. 2015, 373, 1627–1639. 10.1056/NEJMoa1507643. [DOI] [PMC free article] [PubMed] [Google Scholar]
- Boyerinas B.; Jochems C.; Fantini M.; Heery C. R.; Gulley J. L.; Tsang K. Y.; Schlom J. Antibody-dependent cellular cytotoxicity activity of a Novel Anti-PD-L1 antibody avelumab (MSB0010718C) on human tumor cells. Cancer Immunol. Res. 2015, 3, 1148–1157. 10.1158/2326-6066.CIR-15-0059. [DOI] [PMC free article] [PubMed] [Google Scholar]
- Socinski M. A.; Jotte R. M.; Cappuzzo F.; Orlandi F.; Stroyakovskiy D.; Nogami N.; Rodríguez-Abreu D.; Moro-Sibilot D.; Thomas C. A.; Barlesi F.; Finley G.; Kelsch C.; Lee A.; Coleman S.; Deng Y.; Shen Y.; Kowanetz M.; Lopez-Chavez A.; Sandler A.; Reck M. Atezolizumab for First-Line Treatment of Metastatic Nonsquamous NSCLC. N. Engl. J. Med. 2018, 378, 2288–2301. 10.1056/NEJMoa1716948. [DOI] [PubMed] [Google Scholar]
- Antonia S. J.; Villegas A.; Daniel D.; Vicente D.; Murakami S.; Hui R.; Yokoi T.; Chiappori A.; Lee K. H.; de Wit M.; Cho B. C.; Bourhaba M.; Quantin X.; Tokito T.; Mekhail T.; Planchard D.; Kim Y.-C.; Karapetis C. S.; Hiret S.; Ostoros G.; Kubota K.; Gray J. E.; Paz-Ares L.; de Castro Carpeño J.; Wadsworth C.; Melillo G.; Jiang H.; Huang Y.; Dennis P. A.; Özgüroğlu M. Durvalumab after Chemoradiotherapy in Stage III Non–Small-Cell Lung Cancer. N. Engl. J. Med. 2017, 377, 1919–1929. 10.1056/NEJMoa1709937. [DOI] [PubMed] [Google Scholar]
- Peng X.; Wang J.; Peng W.; Wu F. X.; Pan Y. Protein-protein interactions: detection, reliability assessment and applications. Brief. Bioinform. 2016, 18, 798–819. 10.1093/bib/bbw066. [DOI] [PubMed] [Google Scholar]
- Zhou M.; Li Q.; Wang R. Current Experimental Methods for Characterizing Protein-Protein Interactions. ChemMedChem. 2016, 11, 738–756. 10.1002/cmdc.201500495. [DOI] [PMC free article] [PubMed] [Google Scholar]
- Poluri K. M.; Gulati K.; Sarkar S.. Protein-Protein Interactions: Principles and Techniques: Vol. I; Springer: Singapore, 2021; pp 197–264. 10.1007/978-981-16-1594-8_5. [DOI] [Google Scholar]
- Kastritis P. L.; Moal I. H.; Hwang H.; Weng Z.; Bates P. A.; Bonvin A. M.; Janin J. A structure-based benchmark for protein-protein binding affinity. Protein Sci. 2011, 20, 482–491. 10.1002/pro.580. [DOI] [PMC free article] [PubMed] [Google Scholar]
- Ballester P. J.; Schreyer A.; Blundell T. L. Does a More Precise Chemical Description of Protein–Ligand Complexes Lead to More Accurate Prediction of Binding Affinity?. J. Chem. Inf. Model. 2014, 54, 944–955. 10.1021/ci500091r. [DOI] [PMC free article] [PubMed] [Google Scholar]
- Yugandhar K.; Gromiha M. M. Protein-protein binding affinity prediction from amino acid sequence. Bioinformatics 2014, 30, 3583–3589. 10.1093/bioinformatics/btu580. [DOI] [PubMed] [Google Scholar]
- Vangone A.; Bonvin A. M. Contacts-based prediction of binding affinity in proteinprotein complexes. eLife 2015, 4, 1–15. 10.7554/eLife.07454. [DOI] [PMC free article] [PubMed] [Google Scholar]
- Sheng Y.-j.; Yin Y.-w.; Ma Y.-q.; Ding H.-m. Improving the Performance of MM/PBSA in Protein–Protein Interactions via the Screening Electrostatic Energy. J. Chem. Inf. Model. 2021, 61, 2454–2462. 10.1021/acs.jcim.1c00410. [DOI] [PubMed] [Google Scholar]
- Luo J.; Guo Y.; Zhong Y.; Ma D.; Li W.; Li M. A functional feature analysis on diverse protein-protein interactions: Application for the prediction of binding affinity. J. Comput. Aided. Mol. Des. 2014, 28, 619–629. 10.1007/s10822-014-9746-y. [DOI] [PubMed] [Google Scholar]
- Abbasi W. A.; Yaseen A.; Hassan F. U.; Andleeb S.; Minhas F. U. A. A. ISLAND: in-silico proteins binding affinity prediction using sequence information. BioData Min. 2020, 13, 1–13. 10.1186/s13040-020-00231-w. [DOI] [PMC free article] [PubMed] [Google Scholar]
- Wang E.; Weng G.; Sun H.; Du H.; Zhu F.; Chen F.; Wang Z.; Hou T. Assessing the performance of the MM/PBSA and MM/GBSA methods. 10. Impacts of enhanced sampling and variable dielectric model on protein-protein Interactions. Phys. Chem. Chem. Phys. 2019, 21, 18958–18969. 10.1039/C9CP04096J. [DOI] [PubMed] [Google Scholar]
- Moal I. H.; Jimenez-Garcia B.; Fernandez-Recio J. CCharPPI web server: Computational characterization of protein-protein interactions from structure. Bioinformatics 2015, 31, 123–125. 10.1093/bioinformatics/btu594. [DOI] [PubMed] [Google Scholar]
- Kastritis P. L.; Bonvin A. M. J. J. Are Scoring Functions in Protein-Protein Docking Ready to Predict Interactomes? Clues from a Novel Binding Affinity Benchmark. J. Proteome Res. 2011, 10, 921–922. 10.1021/pr101118t. [DOI] [PubMed] [Google Scholar]
- Kastritis P. L.; Rodrigues J. P.; Folkers G. E.; Boelens R.; Bonvin A. M. Proteins feel more than they see: Fine-tuning of binding affinity by properties of the non-interacting surface. J. Mol. Biol. 2014, 426, 2632–2652. 10.1016/j.jmb.2014.04.017. [DOI] [PubMed] [Google Scholar]
- Jarmoskaite I.; Alsadhan I.; Vaidyanathan P. P.; Herschlag D. How to measure and evaluate binding affinities. eLife 2020, 9, 1–34. 10.7554/eLife.57264. [DOI] [PMC free article] [PubMed] [Google Scholar]
- Siebenmorgen T.; Zacharias M. Computational prediction of protein-protein binding affinities. WIREs Comput. Mol. Sci. 2020, 10, 1–18. 10.1002/wcms.1448. [DOI] [Google Scholar]
- Otzen D. E.; Fersht A. R. Analysis of protein-protein interactions by mutagenesis: Direct versus indirect effects. Protein Eng. 1999, 12, 41–45. 10.1093/protein/12.1.41. [DOI] [PubMed] [Google Scholar]
- Jackson S. E.; Fersht A. R. Contribution of Residues in the Reactive Site Loop of Chymotrypsin Inhibitor 2 to Protein Stability and Activity. Biochemistry 1994, 33, 13880–13887. 10.1021/bi00250a042. [DOI] [PubMed] [Google Scholar]
- Piehler J.; Schreiber G. Mutational and structural analysis of the binding interface between type I interferons and their receptor ifnar2. J. Mol. Biol. 1999, 294, 223–237. 10.1006/jmbi.1999.3230. [DOI] [PubMed] [Google Scholar]
- Piehler J.; Roisman L. C.; Schreiber G. New structural and functional aspects of the type I interferon-receptor interaction revealed by comprehensive mutational analysis of the binding interface. J. Biol. Chem. 2000, 275, 40425–40433. 10.1074/jbc.M006854200. [DOI] [PubMed] [Google Scholar]
- Kiel C.; Selzer T.; Shaul Y.; Schreiber G.; Herrmann C. Electrostatically optimized Ras-binding Ral guanine dissociation stimulator mutants increase the rate of association by stabilizing the encounter complex. Proc. Natl. Acad. Sci. U. S. A. 2004, 101, 9223–9228. 10.1073/pnas.0401160101. [DOI] [PMC free article] [PubMed] [Google Scholar]
- Gromiha M. M.; Yugandhar K.; Jemimah S. Protein–protein interactions: scoring schemes and binding affinity. Curr. Opin. Struct. Biol. 2017, 44, 31–38. 10.1016/j.sbi.2016.10.016. [DOI] [PubMed] [Google Scholar]
- Abriata L. A.; Dal Peraro M. Assessment of transferable forcefields for protein simulations attests improved description of disordered states and secondary structure propensities, and hints at multi-protein systems as the next challenge for optimization. Comput. Struct. Biotechnol. J. 2021, 19, 2626–2636. 10.1016/j.csbj.2021.04.050. [DOI] [PMC free article] [PubMed] [Google Scholar]
- Liu C. Approximations, Idealizations, and Models in Statistical Mechanics. Erkenntnis 2004, 60, 235–263. 10.1023/B:ERKE.0000012883.07507.32. [DOI] [Google Scholar]
- Kollman P. Free energy calculations: Applications to chemical and biochemical phenomena. Chem. Rev. 1993, 93, 2395–2417. 10.1021/cr00023a004. [DOI] [Google Scholar]
- Mobley D. L.; Dill K. A. Binding of Small-Molecule Ligands to Proteins: “What You See” Is Not Always “What You Get. Structure 2009, 17, 489–498. 10.1016/j.str.2009.02.010. [DOI] [PMC free article] [PubMed] [Google Scholar]
- Srinivasan J.; Cheatham T. E.; Cieplak P.; Kollman P. a.; Case D. a. Continuum solvent studies of the stability of DNA, RNA, and phosphoramidate-DNA helices. J. Am. Chem. Soc. 1998, 120, 9401–9409. 10.1021/ja981844+. [DOI] [Google Scholar]
- Bashford D.; Case D. A. Generalized born models of macromolecular solvation effects. Annu. Rev. Phys. Chem. 2000, 51, 129–52. 10.1146/annurev.physchem.51.1.129. [DOI] [PubMed] [Google Scholar]
- Aqvist J.; Marelius J. The linear interaction energy method for predicting ligand binding free energies. Comb. Chem. High Throughput Screen. 2001, 4, 613–626. 10.2174/1386207013330661. [DOI] [PubMed] [Google Scholar]
- Gilson M. K.; Zhou H.-X. Calculation of protein-ligand binding affinities. Annu. Rev. Biophys. Biomol. Struct. 2007, 36, 21–42. 10.1146/annurev.biophys.36.040306.132550. [DOI] [PubMed] [Google Scholar]
- Swanson J. M. J.; Henchman R. H.; McCammon J. A. Revisiting free energy calculations: a theoretical connection to MM/PBSA and direct calculation of the association free energy. Biophys. J. 2004, 86, 67–74. 10.1016/S0006-3495(04)74084-9. [DOI] [PMC free article] [PubMed] [Google Scholar]
- Genheden S.; Ryde U. The MM/PBSA and MM/GBSA methods to estimate ligand-binding affinities. Expert Opin. Drug Discovery 2015, 10, 449–461. 10.1517/17460441.2015.1032936. [DOI] [PMC free article] [PubMed] [Google Scholar]
- Suárez D.; Díaz N. Direct methods for computing single-molecule entropies from molecular simulations. Wiley Interdiscip. Rev. Comput. Mol. Sci. 2015, 5, 1–26. 10.1002/wcms.1195. [DOI] [Google Scholar]
- Wereszczynski J.; McCammon J. A. Statistical mechanics and molecular dynamics in evaluating thermodynamic properties of biomolecular recognition. Q. Rev. Biophys. 2012, 45, 1–25. 10.1017/S0033583511000096. [DOI] [PMC free article] [PubMed] [Google Scholar]
- Li L.; Li C.; Zhang Z.; Alexov E. On the Dielectric “Constant” of Proteins: Smooth Dielectric Function for Macromolecular Modeling and Its Implementation in DelPhi. J. Chem. Theory Comput. 2013, 9, 2126–2136. 10.1021/ct400065j. [DOI] [PMC free article] [PubMed] [Google Scholar]
- Chakravorty A.; Jia Z.; Li L.; Zhao S.; Alexov E. Reproducing the Ensemble Average Polar Solvation Energy of a Protein from a Single Structure: Gaussian-Based Smooth Dielectric Function for Macromolecular Modeling. J. Chem. Theory Comput. 2018, 14, 1020–1032. 10.1021/acs.jctc.7b00756. [DOI] [PMC free article] [PubMed] [Google Scholar]
- Chakravorty A.; Jia Z.; Peng Y.; Tajielyato N.; Wang L.; Alexov E.. Gaussian-Based Smooth Dielectric Function: A Surface-Free Approach for Modeling Macromolecular Binding in Solvents. Front. Mol. Biosci. 2018, 10.3389/fmolb.2018.00025. [DOI] [PMC free article] [PubMed] [Google Scholar]
- Hazra T.; Ahmed Ullah S.; Wang S.; Alexov E.; Zhao S. A super-Gaussian PoissonBoltzmann model for electrostatic free energy calculation: smooth dielectric distribution for protein cavities and in both water and vacuum states. J. Math. Biol. 2019, 79, 631–672. 10.1007/s00285-019-01372-1. [DOI] [PMC free article] [PubMed] [Google Scholar]
- Chakravorty A.; Panday S.; Pahari S.; Zhao S.; Alexov E. Capturing the Effects of Explicit Waters in Implicit Electrostatics Modeling: Qualitative Justification of Gaussian-Based Dielectric Models in DelPhi. J. Chem. Inf. Model. 2020, 60, 2229–2246. 10.1021/acs.jcim.0c00151. [DOI] [PMC free article] [PubMed] [Google Scholar]
- Panday S. K.; Shashikala M. H. B.; Chakravorty A.; Zhao S.; Alexov E. Reproducing ensemble averaged electrostatics with Super-Gaussian-based smooth dielectric function: application to electrostatic component of binding energy of protein complexes. Commun. Inf. Syst. 2019, 19, 405–423. 10.4310/CIS.2019.v19.n4.a4. [DOI] [Google Scholar]
- Killian B. J.; Yundenfreund Kravitz J.; Gilson M. K. Extraction of configurational entropy from molecular simulations via an expansion approximation. J. Chem. Phys. 2007, 127, 024107 10.1063/1.2746329. [DOI] [PMC free article] [PubMed] [Google Scholar]
- King B. M.; Silver N. W.; Tidor B. Efficient calculation of molecular configurational entropies using an information theoretic approximation. J. Phys. Chem. B 2012, 116, 2891–904. 10.1021/jp2068123. [DOI] [PMC free article] [PubMed] [Google Scholar]
- Panday S. K.; Ghosh I. Application and Comprehensive Analysis of Neighbor Approximated Information Theoretic Configurational Entropy Methods to Protein-Ligand Binding Cases. J. Chem. Theory Comput. 2020, 16, 7581–7600. 10.1021/acs.jctc.0c00764. [DOI] [PubMed] [Google Scholar]
- López-Blanco J. R.; Miyashita O.; Tama F.; Chacón P.. eLS; John Wiley & Sons, Ltd: Chichester, U.K., 2014; p 9. 10.1002/9780470015902.a0020204.pub2. [DOI] [Google Scholar]
- Gohlke H.; Case D. a. Converging free energy estimates: MM-PB(GB)SA studies on the protein-protein complex Ras-Raf. J. Comput. Chem. 2004, 25, 238–50. 10.1002/jcc.10379. [DOI] [PubMed] [Google Scholar]
- Chakravorty A.; Higham J.; Henchman R. H. Entropy of proteins using multiscale cell correlation. J. Chem. Inf. Model. 2020, 60, 5540–5551. 10.1021/acs.jcim.0c00611. [DOI] [PubMed] [Google Scholar]
- Sun Z.; Yan Y. N.; Yang M.; Zhang J. Z. Interaction entropy for protein-protein binding. J. Chem. Phys. 2017, 146, 124124. 10.1063/1.4978893. [DOI] [PubMed] [Google Scholar]
- Wang J.; Hou T. Develop and test a solvent accessible surface area-based model in conformational entropy calculations. J. Chem. Inf. Model. 2012, 52, 1199–1212. 10.1021/ci300064d. [DOI] [PMC free article] [PubMed] [Google Scholar]
- Chen F.; Liu H.; Sun H.; Pan P.; Li Y.; Li D.; Hou T. Assessing the performance of the MM/PBSA and MM/GBSA methods. 6. Capability to predict protein-protein binding free energies and re-rank binding poses generated by protein-protein docking. Phys. Chem. Chem. Phys. 2016, 18, 22129–22139. 10.1039/C6CP03670H. [DOI] [PubMed] [Google Scholar]
- Li C.; Jia Z.; Chakravorty A.; Pahari S.; Peng Y.; Basu S.; Koirala M.; Panday S. K.; Petukh M.; Li L.; Alexov E. DelPhi Suite: New Developments and Review of Functionalities. J. Comput. Chem. 2019, 40, 2502–2508. 10.1002/jcc.26006. [DOI] [PMC free article] [PubMed] [Google Scholar]
- Kastritis P. L.; Bonvin A. M. J. J. Are Scoring Functions in Protein-Protein Docking Ready To Predict Interactomes? Clues from a Novel Binding Affinity Benchmark. J. Proteome Res. 2010, 9, 2216–2225. 10.1021/pr9009854. [DOI] [PubMed] [Google Scholar]
- Berman H. M.; Westbrook J.; Feng Z.; Gilliland G.; Bhat T. N.; Weissig H.; Shindyalov I. N.; Bourne P. E. The protein data bank. Nucleic Acids Res. 2000, 28, 235–242. 10.1093/nar/28.1.235. [DOI] [PMC free article] [PubMed] [Google Scholar]
- Burley S. K.; Bhikadiya C.; Bi C.; Bittrich S.; Chen L.; Crichlow G. V.; Christie C. H.; Dalenberg K.; Di Costanzo L.; Duarte J. M.; Dutta S.; Feng Z.; Ganesan S.; Goodsell D. S.; Ghosh S.; Green R. K.; Guranovic V.; Guzenko D.; Hudson B. P.; Lawson C. L.; Liang Y.; Lowe R.; Namkoong H.; Peisach E.; Persikova I.; Randle C.; Rose A.; Rose Y.; Sali A.; Segura J.; Sekharan M.; Shao C.; Tao Y. P.; Voigt M.; Westbrook J. D.; Young J. Y.; Zardecki C.; Zhuravleva M. RCSB Protein Data Bank: Powerful new tools for exploring 3D structures of biological macromolecules for basic and applied research and education in fundamental biology, biomedicine, biotechnology, bioengineering and energy sciences. Nucleic Acids Res. 2021, 49, D437–D451. 10.1093/nar/gkaa1038. [DOI] [PMC free article] [PubMed] [Google Scholar]
- Maier J. a.; Martinez C.; Kasavajhala K.; Wickstrom L.; Hauser K. E.; Simmerling C. ff14SB: Improving the Accuracy of Protein Side Chain and Backbone Parameters from ff99SB. J. Chem. Theory Comput. 2015, 11, 3696–3713. 10.1021/acs.jctc.5b00255. [DOI] [PMC free article] [PubMed] [Google Scholar]
- Onufriev A.; Bashford D.; Case D. a. Exploring protein native states and large-scale conformational changes with a modified generalized born model. Proteins 2004, 55, 383–94. 10.1002/prot.20033. [DOI] [PubMed] [Google Scholar]
- Mongan J.; Simmerling C.; McCammon J. A.; Case D. A.; Onufriev A. Generalized born model with a simple, robust molecular volume correction. J. Chem. Theory Comput. 2007, 3, 156–169. 10.1021/ct600085e. [DOI] [PMC free article] [PubMed] [Google Scholar]
- Nguyen H.; Roe D. R.; Simmerling C. Improved generalized born solvent model parameters for protein simulations. J. Chem. Theory Comput. 2013, 9, 2020–2034. 10.1021/ct3010485. [DOI] [PMC free article] [PubMed] [Google Scholar]
- Case D.; Aktulga H.; Belfon K.; Ben-Shalom I.; Brozell S.; Cerutti D.; Cheatham I. T.; Cisneros G.; Cruzeiro V.; Darden T.; Duke R.; Giambasu G.; Gilson M.; Gohlke H.; Goetz A.; Harris R.; Izadi S.; Izmailov S.; Jin C.; Ka K.; Kollman P.. AMBER 18; University of California: San Francisco, CA, 2018.
- Gaudreault F.; Chartier M.; Najmanovich R. Side-chain rotamer changes upon ligand binding: Common, crucial, correlate with entropy and rearrange hydrogen bonding. Bioinformatics 2012, 28, i423–i430. 10.1093/bioinformatics/bts395. [DOI] [PMC free article] [PubMed] [Google Scholar]
- Chellgren B. W.; Creamer T. P. Side-chain entropy effects on protein secondary structure formation. Proteins Struct. Funct. Genet. 2006, 62, 411–420. 10.1002/prot.20766. [DOI] [PubMed] [Google Scholar]
- Panday S. K.; Shashikala M. H.; Koirala M.; Pahari S.; Chakrvorty A.; Peng Y.; Li L.; Jia Z.; Li C.; Alexov E. Modeling electrostatics in molecular biology: A tutorial of DelPhi and associated resources [Article v1.0]. Living J. Comput. Mol. Sci. 2019, 1, 1–24. 10.33011/livecoms.1.2.10841. [DOI] [Google Scholar]
- Jia Z.; Li L.; Chakravorty A.; Alexov E. Treating ion distribution with Gaussian-based smooth dielectric function in DelPhi. J. Comput. Chem. 2017, 38, 1974–1979. 10.1002/jcc.24831. [DOI] [PMC free article] [PubMed] [Google Scholar]
- Humphrey W.; Dalke A.; Schulten K. VMD: visual molecular dynamics. J. Mol. Graph. 1996, 14, 33–38. 10.1016/0263-7855(96)00018-5. [DOI] [PubMed] [Google Scholar]
- Shapovalov M.; Dunbrack R. L. A Smoothed Backbone-Dependent Rotamer Library for Proteins Derived from Adaptive Kernel Density Estimates and Regressions. Structure 2011, 19, 844–858. 10.1016/j.str.2011.03.019. [DOI] [PMC free article] [PubMed] [Google Scholar]
Associated Data
This section collects any data citations, data availability statements, or supplementary materials included in this article.