Abstract
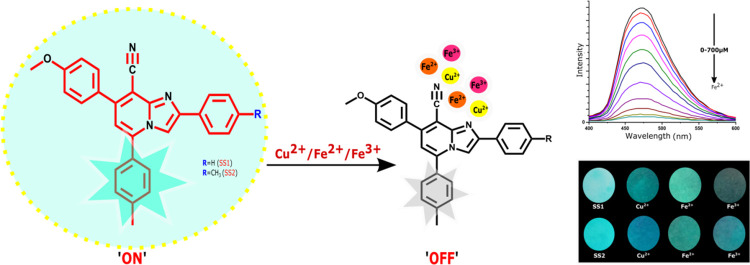
Two cyanoimidazopyridine-based sensors (SS1 and SS2) were explored for the colorimetric and fluorometric detection of Fe2+, Fe3+, and Cu2+ ions in the semi-aqueous medium. The “turn-off” fluorescence response of both sensors to these ions was due to the restriction in internal charge transfer. Job’s plot and semi-empirical calculations revealed that SS1 and SS2 complexed with Cu2+ ions in a 1:1 ratio and Fe2+/3+ ions in a 2:1 ratio, respectively. The sensors were found to have high binding constant (Ka) values and low detection limit values. FMO analysis using the semi-empirical quantum mechanics method revealed the decrease in energy gap after complexation with metal ions. Sensor-coated filter paper strips were prepared and analyzed, where the color changes in the strips could be utilized for the real-time detection of Fe2+, Fe3+, and Cu2+ ions.
1. Introduction
The selective ligand design for complexation with metal ions is active research in supramolecular chemistry.1 The ions and molecules play an essential role in both chemical and biological systems and their imbalanced concentration can lead to many health issues.2 Monitoring their concentration in vitro and in vivo is really beneficial as these ions are directly involved in biological and chemical processes.3,4 Various analytical techniques, such as X-ray spectroscopy, fluorescence spectrometry, voltammetry, atomic absorption spectrometry (AAS), atomic fluorescence spectrometry, flow injection analysis (FIA), electrothermal atomization atomic absorption spectrometry (ETAAS), inductively coupled plasma mass spectroscopy, and ion-pair chromatography,5−9 have been developed to detect metal ions in biological and environmental samples. These techniques suffer from drawbacks, such as requiring skilled technicians, being time-consuming, being expensive, and having complicated instrumentation, thereby making them less desirable for direct assays. On the other hand, colorimetric and fluorometric techniques are highly demanding. They have attracted researchers worldwide to detect various analytes because of easy fabrication, easy operation, short detection time, technical simplicity, instant responses, naked-eye detection, and high sensitivity and selectivity. Literature studies10−17 have shown that a large number of fluorometric- and colorimetric-based sensors have been developed for the detection of various analytes. Compared to a single analyte detector,18−21 the probes capable of simultaneous detection of two or more analytes have several advantages such as analytical time reduction and cost effectiveness.22−24 Therefore, it is highly desirable to develop sensors with multiple ion detection behavior.
Copper (Cu2+) and iron (Fe2+ and Fe3+) play a vital role in various biological processes. Copper is directly involved in enzymatic catalysis, induction of signal transduction, electron transfer, and growth and development of connective tissues, brain, heart, and many other body organs. Iron, one of the most abundant elements in the human body, plays a crucial role in oxygen transport, cellular metabolism, and energy generation and serves as an essential component in myoglobin, hemoglobin, siderophores, and cytochromes.25−34 Living cells should maintain the optimum concentration of these ions as their imbalance can cause severe diseases. For instance, the presence of unregulated copper and disrupted copper ion homeostasis can lead to numerous neurodegenerative diseases35 such as Alzheimer’s disease,36 Menke’s syndrome, Wilson’s syndrome,37 amyotrophic lateral sclerosis, prion disease, and Parkinson’s disease.38 On the other hand, the imbalance/alteration in the concentration of iron may lead to severe diseases like restless leg syndrome,39 Alzheimer’s disease, Parkinson’s disease,40 β-thalassemia, Friedreich’s ataxia,41 anemia, heart diseases, liver and kidney damage, and diabetes.42 In addition to the physiological role, the imbalanced concentration of these ions in soil and water adversely affects the environment.43,44 Therefore, the development of chromofluorogenic chemosensors, which can be used to evaluate ion levels in environmental and biological systems, is of great significance.
Imidazo[1,2-a]pyridine-based scaffolds have drawn considerable attention due to their potential applications in materials science.45 Owing to the immense significance of the imidazo[1,2-a]pyridine nucleus and as a part of our research, our group has reported the synthesis of imidazopyridines46−48 including highly conjugated triarylimidazo[1,2-a]pyridine-8-carbonitriles.49 While working with triarylimidazopyridines, it was observed that these molecules exhibit high fluorescence in solution. The intense fluorescence nature may be attributed to the presence of large delocalization in these compounds. Moreover, the architecture of these compounds allows the nitrogen atom and cyano group to be in the vicinity of each other for chelating to metal ions. Both features coupled with serendipitously visibly high fluorescence properties prompted us to explore these compounds for metal sensing applications.
Herein, we report two highly fluorescent derivatives of triarylimidazo[1,2-a]pyridine-8-carbonitrile, SS1 and SS2, with N and CN as coordinating sites for the detection of Fe2+, Fe3+, and Cu2+ among other cations (Li+, Na+, K+, Ca2+, Mg2+, Co2+, Zn2+, and Hg2+) in the THF/water medium using absorption and fluorescence spectroscopy. The binding ability of these compounds was analyzed using semi-empirical quantum calculations. Moreover, the practical applicability of SS1 and SS2 is demonstrated by the colorimetric response of sensors toward Fe2+ and Fe3+ ions using a filter paper-based study.
2. Results and Discussion
2.1. Design and Synthesis of SS1 and SS2
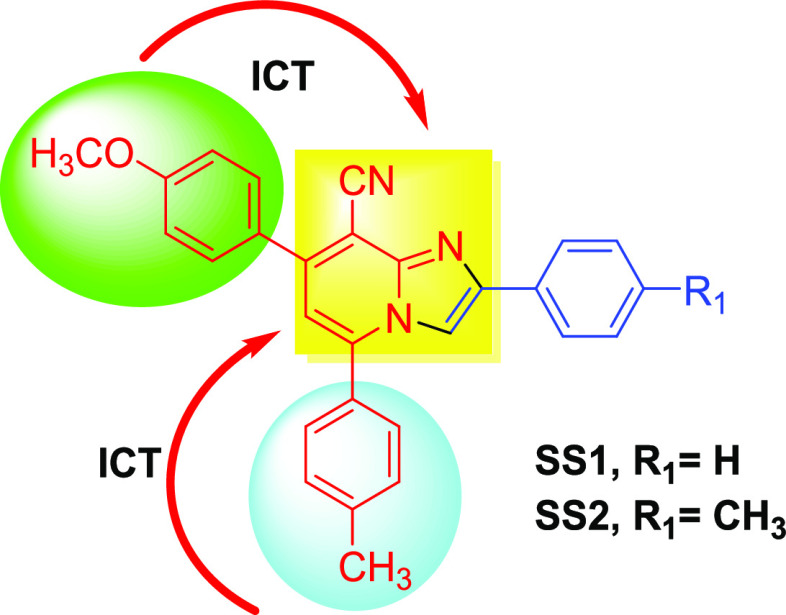
It is widely recognized that designing of an optical chemosensor for metal ions requires the presence of a chromophore or fluorophore as a signaling unit along with metal-chelating centers as a recognition unit. The interaction of the designed sensor with metal ions leads to changes in the absorption and emission properties of the sensor, which will be manifested as signals in UV–Vis and fluorescence spectroscopy. On the basis of this, the design strategy involves the incorporation of highly conjugated aromatic systems as a fluorophore and a basic electronically depleted imidazopyridine core within the same molecule. The electron donation by aryl groups at positions 5 and 7 and electron acceptance by the imidazopyridine nucleus might create a significant push–pull system within the molecule. The electron-accepting tendency of the imidazopyridine nucleus is further enhanced by the introduction of the cyano group at position 8. Moreover, the position of the cyano group and nitrogen atom is very suitable for chelation to metal ions (Figure 1).
Figure 1.
Proposed sensors showing internal charge transfer.
Therefore, we have synthesized the cyanoimidazopyridine-based sensors (SS1 and SS2) with fused signaling and recognition sites (CN and N) to probe for their use in detection of Fe2+, Fe3+, and Cu2+ ions in THF/water (7:3, v/v).
The route for the synthesis of SS1 and SS2 is shown in (Scheme 1). The synthesized sensors were characterized by the IR, 1H, 13C, and mass spectra (Figures S1–S6).
Scheme 1. Chemical Synthesis of SS1 and SS2.
2.2. UV–Vis Studies of SS1 and SS2 with Metal Ions
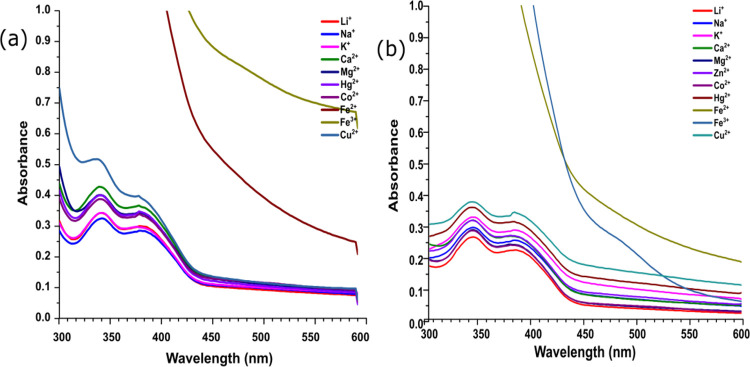
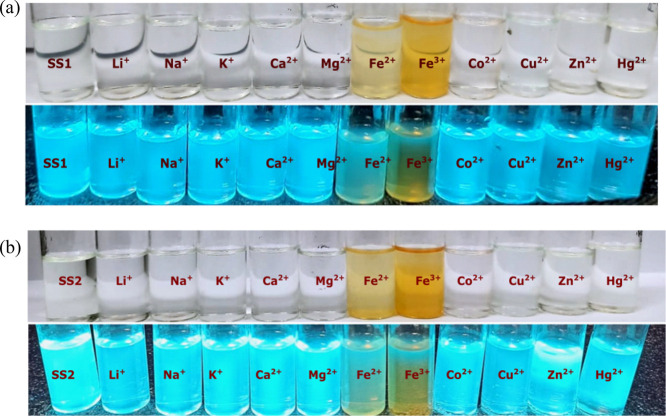
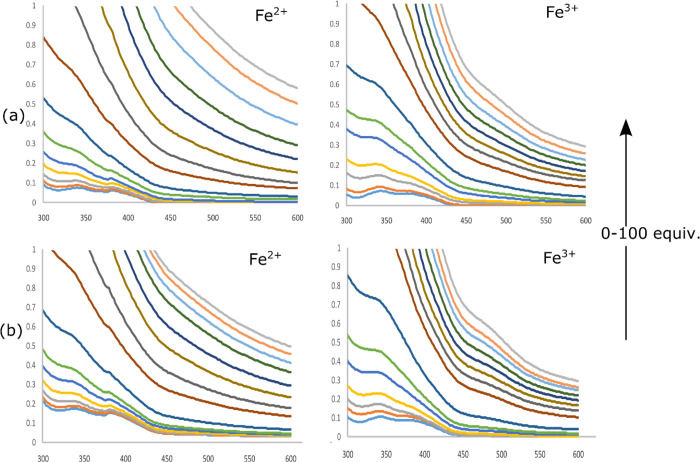
To understand how different metal ions modulate the photophysical properties of sensors, we performed emission and absorption spectroscopy. The UV spectrum of both the sensors (SS1 and SS2) displayed absorption maxima at 342 nm in THF/water (7:3, v/v) (with ε = 2.16 × 10⁴ and 3.28 × 10⁴ mol/dm3, respectively). This band may be attributed to internal charge transfer (ICT). To check the selectivity of sensors toward metal ions, the UV response of sensors toward various metal ions was checked, and among all the scanned cations (Li+, K+, Na+, Ca2+, Mg2+, Fe2+, Fe3+, Co2+, Cu2+, Zn2+, and Hg2+), only Fe2+ and Fe3+ affected the absorption spectra with the complete disappearance of the band at 342 nm (Figure 2). Other metal ions did not show any significant change in the UV spectra. Moreover, a colorimetric response of SS1 and SS2 for Fe2+ and Fe3+ was also observed with a sharp color change from fluorescent aqua-green to yellow in visible light as well as under UV illumination, hence showing the sensing of these ions by SS1 and SS2. Other metal ions were unable to produce such color changes. These changes are photographed and shown in Figure 3. The UV titration of both the sensors with Fe2+ and Fe3+ showed that as the concentration of metal ions (0–100 equiv) increased, the absorption band at 342 nm started disappearing with a large increase in the absorbance, suggesting the complexation of Fe2+ and Fe3+ with sensors (Figure 4).
Figure 2.
(a) UV–Vis spectra of SS1 (10 μM) with different metal ions in THF/water (7:3, v/v) solution; (b) UV–Vis spectra of SS2 (10 μM) with different metal ions in THF/water (7:3, v/v) solution.
Figure 3.
(a) Color changes of SS1 (10 μM) with different metal ions in THF/water (7:3, v/v) solution; (b) color changes of SS2 (10 μM) with different metal ions in THF/water (7:3, v/v) solution.
Figure 4.
(a) UV–Vis spectrum changes of SS1 (3 μM) on increasing concentration of Fe2+ and Fe3+ ions (0–100 equiv) in THF/water (7:3, v/v) solution; (b) UV–Vis spectrum changes of SS2 (3 μM) on increasing concentration of Fe2+ and Fe3+ ions (0–100 equiv) in THF/water (7:3, v/v) solution.
The complete disappearance of the absorption band could be explained on the basis of distortions produced in the ground state of the sensor due to the formation of a bulkier complex with Fe2+ and Fe3+ ions. The complexation of the sensor with these ions restricted the internal charge transfer responsible for the generation of the absorption band.
2.3. Fluorescence Studies of SS1 and SS2 with Metal Ions
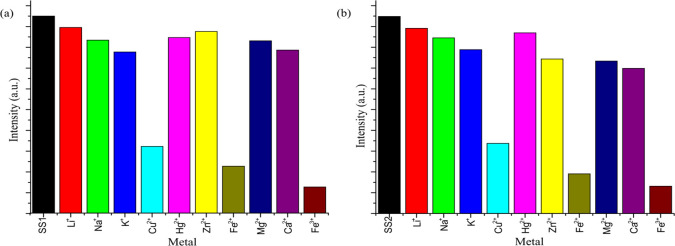
The emission spectra of SS1 and SS2 (10 μM) sensors have been studied in the absence and presence of different metal cations in THF/water (7:3, v/v) solution by exciting the solutions at 340 nm and measuring the emission spectra in the range of 400–600 nm. Both the sensors displayed highly intense emission bands at 470 nm. The fluorescence quantum yield values of free sensors SS1 and SS2 were found to be 0.878 and 0.420, respectively. The fluorescence response of sensors was studied by adding an equal concentration (100 equiv) of different ions (Li+, K+, Na+, Ca2+, Mg2+, Fe2+, Fe3+, Co2+, Cu2+, Zn2+, and Hg2+). Significant quenching of the emission band at 470 nm was observed only with Fe2+, Fe3+, and Cu2+ ions (Figure 5), suggesting the specific sensing of these ions by the sensors among other tested metal ions. A probable mechanism for the quenching of the emission band might be attributed to a decrease in the π-conjugation and charge transfer within the system on interaction with these ions, which might be responsible for the high luminescence intensity of the free sensor.
Figure 5.
Bar graph representing the emission intensity of (a) SS1 and (b) SS2 (10 μM) on treatment with various metal ions (100 equiv) in THF/water (7:3, v/v).
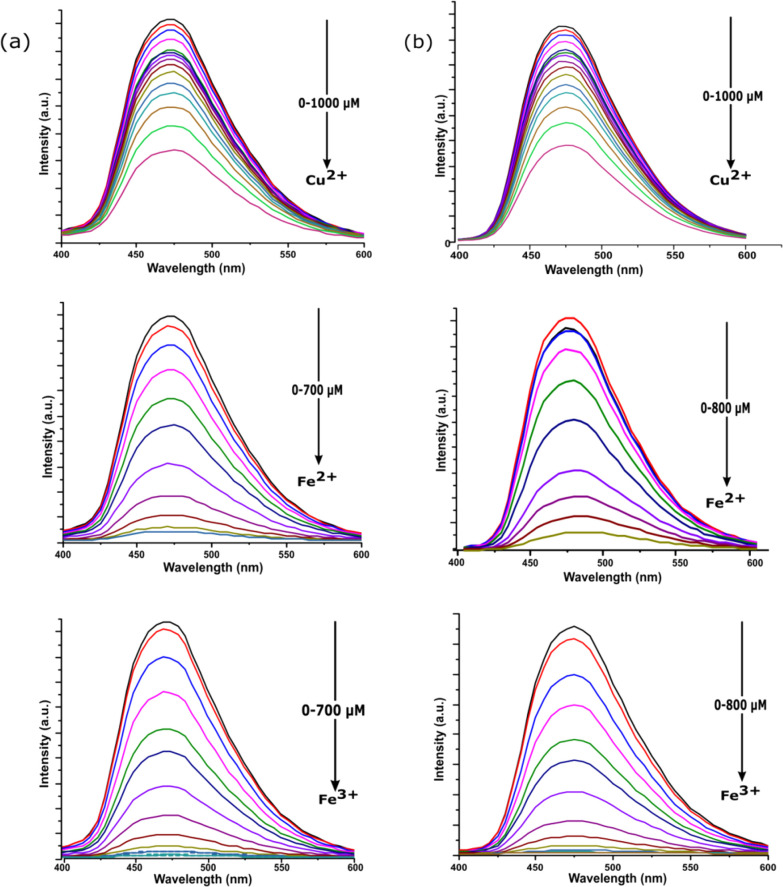
A comparative analysis from Figure 5 showed the maximum quenching response of SS1 and SS2 toward Fe3+ followed by Fe2+ and then Cu2+ ions. The quantum yield values of metal-bound sensors and relative quenching (%) of sensors by these metal ions are collected in Table 1. After the multimetal sensing experiment, the fluorescence titration experiment of both the sensors (SS1 and SS2) was performed separately with Fe2+, Fe3+, and Cu2+ ions (0–100 equiv) (Figure 6). The results indicated a gradual decrease in the intensity of the emission band at 470 nm on the incremental addition of corresponding metal ions (0–100 equiv), and a saturation signal was attained beyond a certain concentration of metal ions, indicating the complete chelation between the sensor and corresponding metal ions (Figure S7).
Table 1. Quantum Yield and Relative Quenching Values.
| metal used | none | Cu2+ | Fe2+ | Fe3+ |
|---|---|---|---|---|
| QY for SS1 | 0.820 | 0.224 | 0.045 | 0.009 |
| QY for SS2 | 0.597 | 0.240 | 0.037 | 0.004 |
| relative quenching (%)a (SS1) | 60.58% | 94.78% | 98.16% | |
| relative quenching (%)a (SS2) | 54.95% | 76.13% | 98.89% |
Formula used: (Io – I/Io) × 100.
Figure 6.
(a) Emission spectrum changes of SS1 (10 μM) on increasing concentration of Cu2+, Fe2+, and Fe3+ ions in THF/water (7:3, v/v) solution; (b) emission spectrum changes of SS2 (10 μM) on increasing concentration of Cu2+, Fe2+, and Fe3+ ions in THF/water (7:3, v/v) solution.
2.4. Determination of Binding Stoichiometry, Binding Constant (Ka), Limit of Detection, and Limit of Quantification
The binding stoichiometry, binding constants (Ka), quantification limits, and detection limits were determined from fluorescence studies. To confirm the binding ratio between [SS1-Mn+] and [SS2-Mn+], where Mn+ = Fe2+, Fe3+, and Cu2+, the method of continuous variation (Job’s plot) was carried out by varying the mole fraction of metal ions added from 0.1 to 0.9 and keeping the total concentration of the sensor and metal constant at 50 μM in THF/water (7:3, v/v). As shown in Figure S8a–f, different plots were obtained with distinct inflection points. The corresponding binding ratios were then determined from these points, and they are summarized in Table 2, which shows that with Fe2+ and Fe3+, both the sensors combine in a 2:1 ratio, whereas with copper ions, the combination ratio is found to be 1:1. The values of association constants were calculated using the Benesi–Hildebrand plot for [SS1-Mn+] and [SS2-Mn+], where Mn+ = Fe2+, Fe3+, and Cu2+ are collected in Table 3 and their linear fit graphs are shown in Figure S9a–f. Binding constants were calculated in 104 M–1 order, indicating good interaction between the sensor and metal ions. Both the sensors showed similar results with a maximum Ka value for Fe3+ ions and a minimum value with Cu2+ ions.
Table 2. Inflection Points Obtained from Job’s Plot and Their Corresponding Binding Ratio.
| metal ion | Cu2+ | Fe2+ | Fe3+ |
|---|---|---|---|
| SS1 | 0.40 | 0.60 | 0.60 |
| SS2 | 0.40 | 0.58 | 0.60 |
| binding ratio (sensor:ion) | 1:1 | 2:1 | 2:1 |
Table 3. Values of Binding Constants Calculated from the Benesi–Hildebrand Plot.
| metal | Cu2+ | Fe2+ | Fe3+ |
|---|---|---|---|
| Ka for SS1 | 0.451 × 10⁴ M–1 | 0.58 × 10⁴ M–1 | 1.17 × 10⁴ M–1 |
| Ka for SS2 | 0.216 × 10⁴ M–1 | 0.61 × 10⁴ M–1 | 0.92 × 10⁴ M–1 |
Further, to determine the limits of detection and quantification of SS1 and SS2 for Fe2+, Fe3+, and Cu2+, the fluorescence titration of sensors (10 μM) in the presence of different concentrations of corresponding metal ions (0–100 equiv) was recorded, as shown in Figure 6a,b. The limits of detection and quantification for sensing Fe2+, Fe3+, and Cu2+ were calculated by using the formulas 3σ/S and 10σ/S, respectively. Each titration was repeated three times and the data was recorded. The standard deviation of the blank measurements σ was calculated from recorded data and the slope (S) was calculated from the linear graph plotted between fluorescence intensity at 470 nm and the varying concentration of metal ions (Figure S10a,b). The values of LOD and LOQ are summarized in Table 4. The results showed that the proposed sensors exhibit detection and quantification limit values in the micromolar range for Cu2+, Fe2+, and Fe3+ ions.
Table 4. Limit of Detection and Limit of Quantification Values.
| sensor | metal ion | limit of detection | limit of quantification |
|---|---|---|---|
| SS1 | Cu2+ | 252 × 10–6 M | 842 × 10–6 M |
| Fe2+ | 55 × 10–6 M | 183.9 × 10⁻⁶ M | |
| Fe3+ | 36.64 × 10⁻⁶ M | 121.13 × 10⁻⁶ M | |
| SS2 | Cu2+ | 177 × 10–6 M | 590 × 10–6 M |
| Fe2+ | 22.15 × 10⁻⁶ M | 73.86 × 10⁻⁶ M | |
| Fe3+ | 14.33 × 10⁻⁶ M | 47.79 × 10⁻⁶ M |
2.5. Stern–Volmer Analysis
To evaluate the quenching process of complexes [SS1-Mn+] and [SS2-Mn+], where Mn+ = Fe2+, Fe3+, and Cu2+, Stern–Volmer analysis was done using the fluorescence titration method. The addition of these metal ions resulted in the decrease in fluorescence intensity from Io to I, and the required graphs were plotted between Io/I against different concentrations of metal ions [Mn+], where Mn+ = Fe2+, Fe3+, and Cu2+. The plots (Figure S10a,b) showed a good linear relationship with different KSV values, which are collected in Table 5. The linear relationships obtained for Fe2+ and Fe3+ along with the changes in the UV spectra suggested the static type of quenching. On the other hand, with Cu2+ ions, the insignificant change in the UV spectra suggested the dynamic quenching.
Table 5. KSV Values of SS1 and SS2 with Different Metal Ions at 470 nm.
| metal used | Cu2+ | Fe2+ | Fe3+ |
|---|---|---|---|
| KSV for SS1 | 1.95 × 10³ | 0.87 × 10² | 1.31 × 10² |
| KSV for SS2 | 1.12 × 10³ | 0.88 × 10² | 1.36 × 10² |
2.6. Effect of pH on the Emission of SS1 and SS2
The fluorescence response of SS1 and SS2 as a function of pH was recorded. The emission spectra of both SS1 and SS2 at different pH values showed similar behavior. The emission spectra of sensors were recorded with a variation in pH by 0.5 units. Changing pH showed a negligible effect on the intensity as well as on the wavelength of the emission band. Even extreme acidic and basic conditions were unable to produce any appreciable changes in the emission spectra (Figure S11). These observations led us to infer that the sensors could find wide utility under all physiological and environmental conditions.
2.7. Comparative Studies
The comparative analysis of sensors (SS1 and SS2) with some of the reported sensors showed almost comparable results in terms of association constants (104 M–1) and LOD (10–6 M) (Table 6). Some of the advantages offered by the proposed sensors are as follows:
Multianalyte signaling (Fe2+, Fe3+, and Cu2+ ions).
Broad operational pH range.
Dual detection response (colorimetrically as well as fluorometrically).
Table 6. Comparison of Our Sensor to Some of Imidazole-Based Chemosensors Reported in the Literature for Sensing Cu2+, Fe2+, and Fe3+.
| sensor | method | ions | media used | binding constant | LOD | binding ratio | mechanism involved | ref. |
|---|---|---|---|---|---|---|---|---|
| (E)7(diethylamino)3((2phenylimidazo[1,2-a]pyridinylimino)methyl)-2H-chromen-2-one | colorimetric and fluorometric | Cu2+ | DMSO, water | 4.859 × 10³ M–1 | 4.6 × 10⁻⁸ M | 1:1 | ICT and CHEF | (56) |
| triazole-appended imidazopyridine sensor | fluorometric | Cu2+, CN– | CH3CN, water | 3.12 × 10⁻⁸ M–1 | 18.17× 10⁻⁶ M | 1:1 | MLCT | (57) |
| furan-2-yl substituted imidazoazine-based sensor | colorimetric and fluorometric | Cu2+ | CH3OH, water | ∼104 M–1 | ∼10–7 M | 1:1 | paramagnetic quenching | (58) |
| 2-(3-(tert-butylamino)imidazo[1,2-a]pyridin-2yl) phenol | colorimetric and fluorometric | Al3+, Fe3+,Cr3+ | CH3CN | 2.77 × 10⁶ M–1 | 1.9 × 10⁻⁹ M | 1:1 | attainment of coplanarity and CHEF | (59) |
| 3-(4-methoxyphenyl)- 1-phenylbenzo[4,5]imidazo[1,2-a]-pyridine | fluorometric | Fe3+, Hg2+ | EtOH, water | 1.09 × 10⁵ M1 | 4.0 ppb | 1:1 | LMCT and CHEF | (60) |
| (E)-5-((4-(diethylamino)-2-hydroxybenzyldene)amino)-1H-imidazole-4-carboxamide | colorimetric | Fe3+, Fe2+ | bis–tris buffer | 5.0 × 10¹⁰ M–1 (Fe3+) and 1.0 × 10¹⁰ M–1 (Fe2+ ) | 0.73 μM (Fe3+) 1.11 μM (Fe2+) | 2:1 | (61) | |
| 3,4-dimethoxyphenyl)(4-(3,4-dimethoxyphenyl)-1H-imidazol-2-yl) methanone oxime | fluorometric | Fe3+ | DMSO | 1:1 | ESIPT and LMCT | (62) | ||
| present sensors (SS1 and SS2) | colorimetric and fluorometric | Cu 2+, Fe2+, Fe3+ | THF, water | ∼104 | ∼10–6 | 1:1 (Cu2+), 2:1 (Fe2+, Fe3+) | ICT |
2.8. Computational Studies
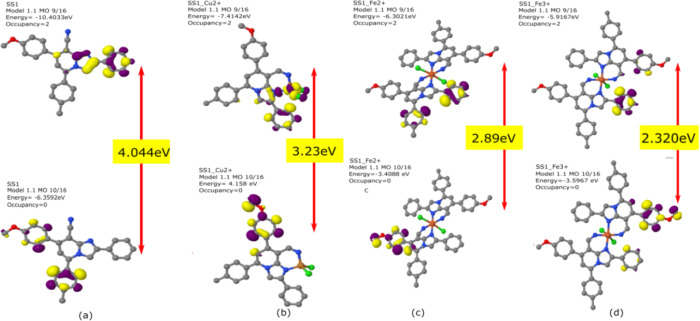
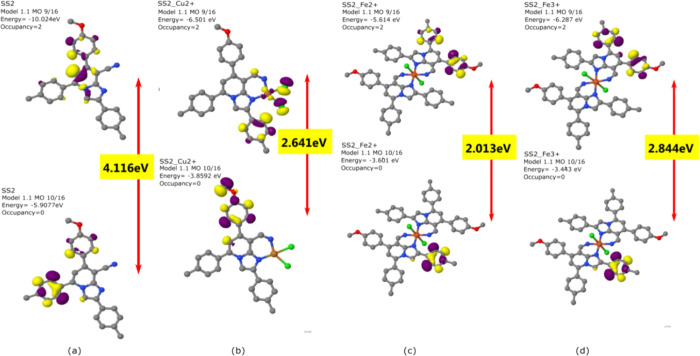
To obtain the optimized structures of SS1 and SS2, semi-empirical calculations using MOPAC 2016 were carried out as shown in Figures 7 and 8. The analysis of frontier molecular orbitals for the calculation of HOMO–LUMO energy and their gap (ΔE) was done by plotting the HOMO–LUMO orbitals of SS1 and SS2 before and after complexation. The ΔE values for SS1 and SS2 were found to be 4.044 and 4.116 eV, respectively. On the interaction with metal ions (Cu2+, Fe2+, and Fe3+), the energy gaps were found to decrease to 3.23, 2.89, and 2.320 eV in SS1 and to 2.641, 2.013, and 2.84 in SS2, respectively. The prominent reduction in energy gaps on binding with Cu2+, Fe2+, and Fe3+ indicated the effective interaction of SS1 and SS2 with these metal ions. The results revealed that the interaction of both SS1 and SS2 with metal ions leads to the stabilization of the complex. The changes in the energies of the system were due to the differences in the π-electron distribution in the complex.
Figure 7.
HOMO–LUMO energy gaps of (a) the free sensor (SS1), (b) SS1-Cu2+ complex, (c) SS1-Fe2+ complex, and (d) SS1-Fe3+ complex.
Figure 8.
HOMO–LUMO energy gaps of (a) the free sensor (SS2), (b) SS2-Cu2+ complex, (c) SS2-Fe2+ complex, and (d) SS2-Fe3+ complex.
2.9. Filter Paper-Based Analysis
To explore the practical utility of the sensor, the filter paper-based analysis was performed where the circular filter papers (Whatman cellulose nitrate paper, size of 0.2 μm) of 3 cm in approximate diameter were immersed in sensor’s solution (SS1 and SS2) for 5 h, followed by air drying. These sensor-coated filter papers were then subsequently immersed in the respective metal ion (100 μM) solution and air-dried, and the color changes were analyzed both in ambient light as well by illuminating under a UV lamp.
A significant visual fluorescence color change and quenching in filter papers were observed after treatment with Cu2+, Fe2+, and Fe3+ salt solution when analyzed under UV illumination (Figure 9). This observation led to the conclusion that both the proposed sensors could be applied for the on-scene detection of metal ions.
Figure 9.
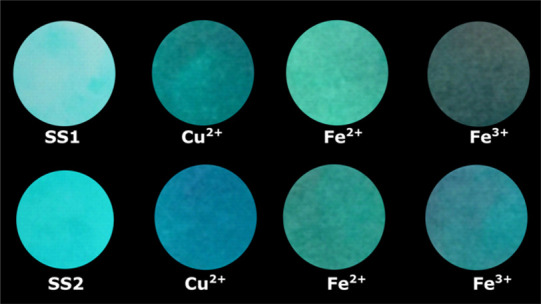
Fluorescence photograph of filter paper strips before and after treatment with respective salt solution under a UV lamp.
3. Conclusions
In conclusion, we explored the metal ion sensing ability of cyanoimidazopyridine-based sensors (SS1 and SS2) by fluorometric and colorimetric measurements. These sensors showed quenching behavior toward Fe2+, Fe3+, and Cu2+ among other cations as depicted by the emission spectra. The quenching process was also observed with naked ions as well as under UV illumination. The quenching mechanism could be attributed to the restriction in intramolecular charge transfer in sensors after complexation with metal ions. The quenching mechanisms were also explored on the basis of the Stern–Volmer plots. In both SS1 and SS2, significant changes in the UV spectrum were observed with Fe2+ and Fe3+, where the fine spectra with maxima at 342 nm were lost and a broad spectrum was observed. The pH titration profile of both the sensors indicated that they could be operational in wide pH conditions, e.g., in the acidic condition also. The 1:1 complexation of both the sensors with Cu2+ ions and 2:1 complexation with Fe2+ and Fe3+ were confirmed by Job’s plot. HOMO–LUMO energy gap calculation showed a decrease in energy gaps after complexation, and hence, a good and stable complex formation was observed. The values of binding constants of the order of 104 M–1 suggested the good binding affinity of SS1 and SS2 toward Fe2+, Fe3+, and Cu2+ with a low limit of detection in micromolar range. Additionally, for the practical applicability of sensors, filter paper strip-based studies were done for the colorimetric detection of Fe2+, Fe3+, and Cu2+. Currently, we are exploring the biological applications of these sensors.
4. Materials and Methods
4.1. Reagents and Instruments
The commercially available chemicals were bought from Aldrich. Solvents were distilled before their use in extraction and purification, and further, a rotary evaporator was used to remove them. For photophysical characterization (UV–Vis absorption and fluorescence emission), spectroscopic grade solvents (Merck or Aldrich) and deionized water were used. Melting point (°C) measurement was done using glass capillaries. The reaction was monitored using the thin-layer chromatography (TLC) plates (60 F254, Merck). Spots were visualized using ultraviolet light (UV) light at 365 and 254 nm. The other visualizing materials include an iodine vapor chamber, Draggendorff reagent, and anisaldehyde reagent. The crude product purification was done by column chromatography (silica gel, 60–120 mesh) and ethyl acetate/petroleum ether (eluting solvent). The IR spectra (ν, cm–1) were performed using a PerkinElmer FTIR spectrophotometer aided by KBr discs. The 13C and 1H NMR proton-decoupled spectra were recorded in CDCl3 on a Bruker AC-400 spectrometer where the working frequencies were set at 400 and 100 MHz, respectively. The internal standard used was tetramethylsilane (TMS). The UV–Vis and fluorescence spectra were recorded with a U-2900 spectrophotometer and a PTIQM40 spectrofluorometer, respectively, using quartz cuvettes with an optical path length of 10 × 4 mm. Deionized water was obtained from a Direct-Q3 UV deionizer from Millipore. All pH measurements of samples were carried out using a digital pH meter.
4.2. Synthesis and Spectroscopic Characterization of Chemosensors (SS1 and SS2)
The synthesis of SS1 and SS2 was carried out by our earlier reported protocol49 (Scheme 1). The compound 2-amino-4-(4-methoxyphenyl)-6-(p-tolyl)nicotinonitrile (1; 1 mmol) was reacted with 1 mmol of corresponding 1-aryl-2-nitroethylene (2) in 20 mol % FeCl3 at 120 °C under solvent-free conditions. The temperature throughout the course of the reaction was maintained at 120 °C. The reaction progress was analyzed using TLC and the reaction was completed in 30 min (SS1) and 60 min (SS2). The crude mixture purification was done using silica gel column chromatography with the solvent system of ethyl acetate and petroleum ether (10:90) to give the pure product (SS1 and SS2) in 72–75% yield. The product obtained was then characterized using FTIR, 1H NMR, 13C NMR, and mass spectroscopy data (for spectroscopic details, see Figures S1–S6, Supporting Information).
4.2.1. Characterization of SS1 and SS2
4.2.1.1. SS1: 7-(4-Methoxyphenyl)-2-phenyl-5-p-tolylimidazo[1,2-a]pyridine-8-carbonitrile
Physical appearance: yellow solid; yield: 75%. M.pt.: 211–213 °C.
1H NMR (400 MHz, CDCl3) δ 8.03–8.00 (m, 3H), 7.72 (d, J = 8.7 Hz, 2H), 7.64 (d, J = 8.0 Hz, 2H), 7.46–7.43 (m, 4H), 7.36 (m, 1H), 7.08 (d, J = 8.8 Hz, 2H), 6.92 (s, 1H), 3.91 (s, 3H), 2.53 (s, 3H).
13C NMR (100 MHz, CDCl3) δ 160.82, 147.46, 144.86, 141.43, 141.23, 132.94, 130.33, 130.18, 130.09, 128.74, 128.70, 128.51, 128.06, 126.40, 115.94, 114.49, 113.69, 107.39, 96.81, 55.48, 21.56.
IR (KBr, υmax cm–1): 2954, 2924, 2852, 2219, 1742, 1606, 1511, 1461, 1376, 1256, 1180.
Mass (ESI): calculated for C28H21N3O [M + H]+, 416.17; found: 416.70.
4.2.1.2. SS2: 7-(4-Methoxyphenyl)-2,5-dip-tolylimidazo[1,2-a]pyridine-8-carbonitrile
Physical appearance: yellow solid; yield: 72%. M.pt.: 358–360 °C.
1H NMR (400 MHz, CDCl3) δ 7.97 (s, 1H), 7.92 (d, J = 8.1 Hz, 2H), 7.72 (d, J = 8.7 Hz, 2H), 7.63 (d, J = 8.0 Hz, 2H), 7.45 (d, J = 8.0 Hz, 2H), 7.26 (d, J = 8.0 Hz, 2H), 7.08 (d, J = 8.8 Hz, 2H), 6.91 (s, 1H), 3.91 (s, 3H), 2.53 (s, 3H), 2.41 (s, 3H).
13C NMR (100 MHz, CDCl3) δ 160.77, 147.55, 145.26, 144.64, 141.34, 141.15, 138.42, 130.38, 130.15, 130.11, 130.08, 129.39, 128.78, 128.08, 126.27, 116.04, 114.44, 113.57, 106.99, 96.58, 55.47, 21.57, 21.40.
IR (KBr, υmax cm–1): 2954, 2924, 2852, 2224, 1742, 1606, 1511, 1461, 1376, 1256, 1180.
Mass (ESI): calculated for C29H23N3O [M + H]+, 430.18; found: 430.75.
4.3. General Procedure for Metal Binding, Quantum Yield, Stern–Volmer Plot, Binding Constant (Ka), Job’s Plot, and Limit of Detection and Quantification Studies
For absorption and emission titration studies, a stock solution (1.0 × 10⁻⁴ M) of SS1 and SS2 was prepared in an optimized THF/water solution (7:3, v/v) and 10 μM was set as the working concentration. Stock solutions with concentrations of 10 × 10–2 and 1.0 × 10⁻² M of various metal salts (LiCl, KCl, NaCl, CaCl2, MgCl2·6H2O, FeSO4·7H2O, FeCl3·6H2O, CoCl2·6H2O, CuCl2·2H2O, ZnCl2, and HgCl2) were prepared in deionized water. All the spectral measurements were carried out at room temperature. To study the binding behavior of SS1 and SS2 toward different metal cations, 100 equiv of metal salts (100 μL) was added independently to 1 mL of 10 μM sensor’s solution in a quartz cuvette. Before taking the electronic absorption as well as fluorescence spectra, the solutions were mixed properly. For UV experiments, the slit width of the instrument was set at 1.50 nm, and for fluorescence studies, slit widths of both excitation and emission were set at 1.00 nm with excitation wavelength λex = 340 nm. Titration studies were performed by varying the concentration of metal ions (2–100 equiv) and keeping the sensor’s concentration constant at 10 μM to get the required molar ratios between the sensor and the metal ions. The total volume of the solution used for the measurements was maintained at ∼1 mL throughout the experiment. Dilution was not allowed to exceed by more than a factor of 10% to minimize the dilution effects.
4.4. Quantum Yield Calculation
The quantum yield values of sensors (SS1 and SS2) in the absence and presence of metal ions were determined by employing a relative method,50 and the quantum yield of the required sample, ϕS, was calculated by using eq 1
| 1 |
Here, the subscripts S and R stand for the sample and reference, respectively, ϕS refers to the emission quantum yield of the sample, ϕR refers to the reference emission quantum yield obtained from the literature, A is the absorbance when excited, F represents the emission band areas, and ηS and ηR are the solvent refractive indices of the sample and reference, respectively. The reference used for the measurement of fluorescence quantum yield was quinine sulfate (ϕS = 0.546 in 0.1 N H2SO4).51 A working concentration was set at 10 μM and the excitation wavelength was set at 350 nm for both the reference and sample.
4.5. Stern–Volmer Plot
The fluorescence quenching nature of the sensors (SS1 and SS2), when exposed to certain specific metal ions Mn+ = Fe2+, Fe3+, and Cu2+, was explained by constructing the Stern–Volmer plot52 according to eq 2
| 2 |
Here, Io and I refer to the fluorescence intensities at 470 nm in the absence and presence of a quencher, respectively. KSV (M–1) refers to the Stern–Volmer constant, which indicates the quenching efficiency, and [Q] is the concentration of the quencher.
4.6. Binding Stoichiometry and Binding Constant (Ka) Calculation
The binding ratio and binding constant (Ka) for the complexes (SS1-Mn+) and (SS2-Mn+), where Mn+ = Fe2+, Fe3+, and Cu2+, were determined from fluorescence titration studies by using Job’s continuous variation method and the Benesi–Hildebrand equation, respectively.53,54 For constructing Job’s plot, various solutions of (SS1-Mn+) and (SS2-Mn+), where Mn+ = Fe2+, Fe3+, and Cu2+ with different sensor–metal ion mole ratios, were prepared by holding the overall concentration and volume of solution constant [50 μM and 1 mL (THF/water, 7:3 v/v)]. The fluorescence spectra of each solution were recorded and the graph was plotted between ΔI · Χsensor versus Χsensor (ΔI is the change of the fluorescence intensity of the sensor at 470 nm with the change in mole fraction of metal ions and Χsensor is the mole fraction of the sensor in each case). The value of the mole fraction of the sensor corresponding to the inflection point in the plots was then analyzed for the determination of binding stoichiometry for each complex. The binding constant values were determined from the Benesi–Hildebrand plot according to eq 3
| 3 |
Here, F0 represents the fluorescence intensity of the free sensor (SS1 and SS2), F represents the fluorescence intensity of the sensor in the presence of different concentrations [Mn+] of metal ions in the solution (Fe2+, Fe3+, and Cu2+), and Fmin is the fluorescence intensity at 470 nm at the maximum concentration of the respective metal ion in solution. Ka represents the binding constant, which was determined from the linear graph’s slope and intercept plotted between 1/(F0 – F) and 1/[Mn+].
4.7. Measurement of Limits of Detection (LD) and Limits of Quantification (LQ)
To determine the detection and quantification limits, fluorescence titration of SS1 and SS2 with metal ions Mn+ = Fe2+, Fe3+, and Cu2+ was performed at 470 nm. The detection and quantification limits were calculated by using eqs 4 and 5
| 4 |
| 5 |
Here, σ represents the standard deviation of the reference and S refers to the calibration curve slope.55S was determined using the plot of (F/F0) versus the metal ion concentration [Mn+] (Mn+ = Fe3+, Fe2+, and Cu2+). Here, F0 refers to the fluorescence intensity of the sensor without a metal and F refers to the fluorescence intensity at different metal Mn+ ion concentrations. The concentration of the sensor during the fluorescence titration experiments was kept at 10 μM [THF/water (7:3, v/v)]. Each fluorescence titration was repeated twice.
Acknowledgments
The authors acknowledge the CSIR-Institute of Microbial Technology (grant OLP0136 to R.P.) and University of Jammu for financial support and DST for the NMR facility under PURSE. T.C. is grateful to CSIR for Junior Research Fellowship. S.S, D.T., and A.G. are grateful to University of Jammu for fellowship.
Supporting Information Available
The Supporting Information is available free of charge at https://pubs.acs.org/doi/10.1021/acsomega.1c07193.
1H NMR spectra of SS1 (Figure S1); 13C NMR of SS1 (Figure S2); mass spectra of SS1 (Figure S3); 1H NMR spectra of SS2 (Figure S4); 13C NMR of SS2 (Figure S5); mass spectra of SS2 (Figure S6); fluorescence spectra with mean and standard deviation of SS1 and SS2 with Cu2+, Fe2+, and Fe3+ (Figure S7); Job’s plot of SS1 and SS2 with Cu2+, Fe2+, and Fe3+ (Figure S8); Benesi–Hildebrand plot of SS1 and SS2 with Cu2+, Fe2+, and Fe3+ (Figure S9); Stern–Volmer plots of SS1 and SS2 with Cu2+, Fe2+, and Fe3+ (Figure S10); fluorescence response of SS1 and SS2 as a function of pH (Figure S11) (PDF)
Author Contributions
§ S.S. and T.C. contributed equally to this work.
The authors declare no competing financial interest.
Supplementary Material
References
- Patel U.; Abbas M. A.; McMillen C. D.; Brumaghim J. L. Selective cation and anion guest binding in host selenazamacrocycles. Dalton Trans. 2018, 47, 12066–12070. 10.1039/C8DT02110D. [DOI] [PubMed] [Google Scholar]
- Lippard S. J.; Berg J. M.. Principles of bioinorganic chemistry; University Science Books: Mill Valley, California, 1994. [Google Scholar]
- Que E. L.; Domaille D. W.; Chang C. J. Metals in Neurobiology: Probing Their Chemistry and Biology with Molecular Imaging. Chem. Rev. 2008, 108, 1517–1549. 10.1021/cr078203u. [DOI] [PubMed] [Google Scholar]
- Klatka M.; Blazewicz A.; Partyka M.; Kollataj W.; Zienkiewicz E.; Kocjan R. Concentration of selected metals in whole blood, plasma, and urine in short stature and healthy children. Biol. Trace Elem. Res. 2015, 166, 142–148. 10.1007/s12011-015-0262-2. [DOI] [PubMed] [Google Scholar]
- Lu Y.; Liang X.; Niyungeko C.; Zhou J.; Xu J.; Tian G. A review of the identification and detection of heavy metal ions in the environment by voltammetry. Talanta 2018, 178, 324–338. 10.1016/j.talanta.2017.08.033. [DOI] [PubMed] [Google Scholar]
- Ghaseminezhad S.; Afzali D.; Taher M. A. Flame atomic absorption spectrometry for the determination of trace amount of rhodium after separation and preconcentration onto modified multiwalled carbon nanotubes as a new solid sorbent. Talanta 2009, 80, 168–172. 10.1016/j.talanta.2009.06.049. [DOI] [PubMed] [Google Scholar]
- Kenduzler E.; Ates M.; Arslan Z.; McHenry M.; Tchounwou P. B. Determination of mercury in fish otoliths by cold vapor generation inductively coupled plasma mass spectrometry (CVG-ICP-MS). Talanta 2012, 93, 404–410. 10.1016/j.talanta.2012.02.063. [DOI] [PMC free article] [PubMed] [Google Scholar]
- Gomez-Ariza J. L.; Sánchez-Rodas D.; Giráldez I.; Morales E. A comparison between ICP-MS and AFS detection for arsenic speciation in environmental samples. Talanta 2000, 51, 257–268. 10.1016/S0039-9140(99)00257-X. [DOI] [PubMed] [Google Scholar]
- Anawar H. M. Arsenic Speciation in Environmental Samples by Hydride Generation and Electrothermal Atomic Absorption Spectrometry. Talanta 2012, 88, 30–42. 10.1016/j.talanta.2011.11.068. [DOI] [PubMed] [Google Scholar]
- Orojloo M.; Amani S. Synthesis and studies of selective chemosensor for naked-eye detection of anions and cations based on a new Schiff-base derivative. Talanta 2016, 159, 292–299. 10.1016/j.talanta.2016.06.042. [DOI] [PubMed] [Google Scholar]
- McNaughton D. A.; Fares M.; Picci G.; Gale P. A.; Caltagirone C. Advances in fluorescent and colorimetric sensors for anionic species. Coord. Chem. Rev. 2021, 427, 213573–213616. 10.1016/j.ccr.2020.213573. [DOI] [Google Scholar]
- Mandegani F.; Zali-Boeini H.; Khayat Z.; Scopelliti R. A smart low molecular weight gelator for the triple detection of copper (II), mercury (II), and cyanide ions in water resources. Talanta 2020, 219, 121237. 10.1016/j.talanta.2020.121237. [DOI] [PubMed] [Google Scholar]
- Ye Q.; Ren S.; Huang H.; Duan G.; Liu K.; Liu J.-B. Fluorescent and Colorimetric Sensors Based on the Oxidation of o-Phenylenediamine. ACS Omega 2020, 5, 20698–20706. 10.1021/acsomega.0c03111. [DOI] [PMC free article] [PubMed] [Google Scholar]
- Samanta T.; Shunmugam R. Colorimetric and fluorometric probes for the optical detection of environmental Hg(II) and As(III) ions. Mater. Adv 2021, 2, 64–95. 10.1039/D0MA00521E. [DOI] [Google Scholar]
- Zhou Y.; Xu Z.; Yoon J. Fluorescent and colorimetric chemosensors for detection of nucleotides, FAD and NADH: highlighted research during 2004–2010. Chem. Soc. Rev. 2011, 40, 2222–2235. 10.1039/c0cs00169d. [DOI] [PubMed] [Google Scholar]
- Zhang J. F.; Zhou Y.; Yoon J.; Kim J. S. Recent progress in fluorescent and colorimetric chemosensors for detection of precious metal ions (silver, gold and platinum ions). Chem. Soc. Rev. 2011, 40, 3416–3429. 10.1039/c1cs15028f. [DOI] [PubMed] [Google Scholar]
- Wan L.; Shu Q.; Zhu J.; Jin S.; Li N.; Chen X.; Chen S. A new multifunctional Schiff-based chemosensor for mask-free fluorimetric and colorimetric sensing of F– and CN–. Talanta 2016, 152, 39–44. 10.1016/j.talanta.2016.01.045. [DOI] [PubMed] [Google Scholar]
- Jiao Y.; Zhou L.; He H.; Yin J.; Gao Q.; Wei J.; Duan C.; Peng X. A novel rhodamine B-based “off-on” fluorescent sensor for selective recognition of copper (II) ions. Talanta 2018, 184, 143–148. 10.1016/j.talanta.2018.01.073. [DOI] [PubMed] [Google Scholar]
- Zhang C.; Zhang H.; Li M.; Zhou Y.; Zhang G.; Shi L.; Yao Q.; Shuang S.; Dong C. A turn-on reactive fluorescentprobe for Hg2+ in 100% aqueous solution. Talanta 2019, 197, 218–224. 10.1016/j.talanta.2019.01.016. [DOI] [PubMed] [Google Scholar]
- Tehrani T.; Meghdadi S.; Salarvand Z.; Tavakoli B.; Eskandari K.; Amirnasr M. An anthracene–quinoline based dual-mode fluorometric–colorimetric sensor for the detection of Fe3+ and its application in live cell imaging. New J. Chem. 2021, 45, 8109–8117. 10.1039/D1NJ00178G. [DOI] [Google Scholar]
- Kaur P.; Kaur M.; Singh K. Ferrocene based chemosensor for Cu2+- A dual channel signaling system. Talanta 2011, 85, 1050–1055. 10.1016/j.talanta.2011.05.026. [DOI] [PubMed] [Google Scholar]
- Hossain S. M.; Dam G. K.; Mishra S.; Singh A. K. Nano-Molar Level Fluorogenic and Oxidation-State Selective Chromogenic Dual Reversible Chemosensor for Multiple Targets Cu2+/S2- and Fe3+/F- ion. New J. Chem. 2020, 44, 15186–15194. 10.1039/D0NJ02777D. [DOI] [Google Scholar]
- Wang Y.; Mao P.-D.; Wua W.-N.; Mao X.-J.; Fan Y.-C.; Zhao X. L.; Xu Z.-Q.; Xu Z.-H. New pyrrole-based single-molecule multianalyte sensor for Cu2+, Zn2+, and Hg2+ and its AIE activity. Sens. Actuator B 2018, 255, 3085–3092. 10.1016/j.snb.2017.09.133. [DOI] [Google Scholar]
- Saravanan P.; Saravanamoorthy S.; Mahalingam A.; Velmathi S. Colorimetric and fluorescent sensing of multi metal ions and anions by salicylaldimine based receptors. J. Lumin. 2012, 132, 979–986. 10.1016/j.jlumin.2011.09.051. [DOI] [Google Scholar]
- Linder M. C.; Zerounian N. R.; Moriya M.; Malpe R. Iron and copper homeostasis and intestinal absorption using the Caco2 cell model. BioMetals 2003, 16, 145–160. 10.1023/A:1020729831696. [DOI] [PubMed] [Google Scholar]
- Koval I. A.; Gamez P.; Belle C.; Selmeczi K.; Reedijk J. Synthetic models of the active site of catechol oxidase: mechanistic studies. Chem. Soc. Rev. 2006, 35, 814–840. 10.1039/b516250p. [DOI] [PubMed] [Google Scholar]
- Camaschella C.; Pagani A. Advances in understanding iron metabolism and its crosstalk with erythropoiesis. Br. J. Haematol. 2018, 182, 481–494. 10.1111/bjh.15403. [DOI] [PubMed] [Google Scholar]
- van Swelm R. P. L.; Wetzels J. F. M.; Swinkels D. W. The multifaceted role of iron in renal health and disease. Nat. Rev. Nephrol. 2020, 16, 77–98. 10.1038/s41581-019-0197-5. [DOI] [PubMed] [Google Scholar]
- Beutler E.; Felitti V.; Gelbart T.; Ho N. Genetics of iron storage and hemochromatosis. Drug Metab. Dispos. 2001, 29, 495–499. [PubMed] [Google Scholar]
- Cairo G.; Pietrangelo A. Iron regulatory proteins in pathobiology. Biochem. J. 2000, 352, 241–250. 10.1042/bj3520241. [DOI] [PMC free article] [PubMed] [Google Scholar]
- Linder M. C.; Hazegh-Azam M. Copper biochemistry and molecular biology. Am. J. Clin. Nutr. 1996, 63, 797S–811S. 10.1093/ajcn/63.5.797. [DOI] [PubMed] [Google Scholar]
- Malmstrom B. G.; Leckner J. The chemical biology of copper. Curr. Opin. Chem. Biol. 1998, 2, 286–292. 10.1016/S1367-5931(98)80071-9. [DOI] [PubMed] [Google Scholar]
- Osredkar J.; Sustar N. Copper and zinc, biological role and significance of copper/zinc imbalance. J. Clin. Toxicol. 2011, S3, 001–018. [Google Scholar]
- Lutsenko S.; Gupta A.; Burkhead J. L.; Zuzel V. Cellular multitasking: the dual role of human Cu-ATPases in cofactor delivery and intracellular copper balance. Arch. Biochem. Biophys. 2008, 476, 22–32. 10.1016/j.abb.2008.05.005. [DOI] [PMC free article] [PubMed] [Google Scholar]
- Waggoner D. J.; Bartnikas T. B.; Gitlin J. D. The role of copper in neurodegenerative disease. Neurobiol. Dis. 1999, 6, 221–230. 10.1006/nbdi.1999.0250. [DOI] [PubMed] [Google Scholar]
- Hung Y. H.; Bush A. I.; Cherny R. A. Copper in the brain and Alzheimer’s disease. J. Biol. Inorg. Chem. 2010, 15, 61–76. 10.1007/s00775-009-0600-y. [DOI] [PubMed] [Google Scholar]
- DiDonato M.; Sarkar B. Copper transport and its alterations in Menkes and Wilson diseases. Biochim. Biophys. Acta Mol. Basis Dis. 1997, 1360, 3–16. 10.1016/S0925-4439(96)00064-6. [DOI] [PubMed] [Google Scholar]
- Gaggelli E.; Kozlowski H.; Valensin D.; Valensin G. Copper homeostasis and neurodegenerative disorders (Alzheimer’s, prion, and Parkinson’s diseases and amyotrophic lateral sclerosis). Chem. Rev. 2006, 106, 1995–2044. 10.1021/cr040410w. [DOI] [PubMed] [Google Scholar]
- Zhu X.-Y.; Wu T.-T.; Wang H.-M.; Li X.; Ni L.-Y.; Chen T.-J.; Qiu M.-Y.; Shen J.; Liu T.; Ondo W. G.; Wu Y.-C. Correlates of Nonanemic Iron Deficiency in Restless Legs Syndrome. Front. Neurol. 2020, 11, 298–307. 10.3389/fneur.2020.00298. [DOI] [PMC free article] [PubMed] [Google Scholar]
- Savelieff M. G.; Nam G.; Kang J.; Lee H. J.; Lee M.; Lim M. H. Development of Multifunctional Molecules as Potential Therapeutic Candidates for Alzheimer’s Disease, Parkinson’s Disease, and Amyotrophic Lateral Sclerosis in the Last Decade. Chem. Rev. 2019, 119, 1221–1322. 10.1021/acs.chemrev.8b00138. [DOI] [PubMed] [Google Scholar]
- Costain G.; Ghosh M. C.; Maio N.; Carnevale A.; Si Y. C.; Rouault T. A.; Yoon G. Absence of iron-responsive element-binding protein 2 causes a novel neurodegenerative syndrome. Brain 2019, 142, 1195–1202. 10.1093/brain/awz072. [DOI] [PMC free article] [PubMed] [Google Scholar]
- Zimmermann M. B.; Hurrell R. F. Nutritional iron deficiency. Lancet 2007, 370, 511–520. 10.1016/S0140-6736(07)61235-5. [DOI] [PubMed] [Google Scholar]
- Rehman M.; Liu L.; Wang Q.; Saleem M. H.; Bashir S.; Ullah S.; Peng D. Copper environmental toxicology, recent advances, and future outlook: a review. Environ. Sci. Pollut. Res. Int. 2019, 26, 18003–18016. 10.1007/s11356-019-05073-6. [DOI] [PubMed] [Google Scholar]
- Rout G. R.; Sahoo S. ROLE OF IRON IN PLANT GROWTH AND METABOLISM. Reviews in Agricultural Science 2015, 3, 1–24. 10.7831/ras.3.1. [DOI] [Google Scholar]
- Wan J.; Zheng C.-J.; Fung M.-K.; Liu X.-K.; Lee C.-S.; Zhang X.-H. Recent advances of the emitters for high performance deep-blue organic light-emitting diodes. J. Mater. Chem. 2015, 3, 4502–4944. 10.1039/C4TC02474E. [DOI] [Google Scholar]
- Kour D.; Gupta A.; Kapoor K. K.; Gupta V. K.; Rajnikant D. S.; Das P. Iodine–NH4OAc mediated regioselective synthesis of 2-aroyl-3-arylimidazo[1,2-a]pyridines from 1,3-diaryl-prop-2-en-1-ones. Org. Biomol. Chem. 2018, 16, 1330–1336. 10.1039/C7OB02750H. [DOI] [PubMed] [Google Scholar]
- Kour D.; Kapoor R. K. K. K. Iodine–ammonium acetate promoted reaction between 2-aminopyridine and aryl methyl ketones: a novel approach towards the synthesis of 2-arylimidazo[1,2-a]pyridine. Tetrahedron Lett. 2016, 57, 4464–4467. 10.1016/j.tetlet.2016.08.058. [DOI] [Google Scholar]
- Kour D.; Sasan S.; Kapoor K. K. Graphene oxide: an efficient carbocatalyst for the solvent-free synthesis of 2-(substituted benzoyl)-3-(substituted phenyl)imidazo[1,2-a]pyridines. J. Chem. Sci. 2020, 132, 12. 10.1007/s12039-019-1702-x. [DOI] [Google Scholar]
- Gupta A.; Sasan S.; Kour A.; Nelofar N.; Mondhe D. M.; Kapoor K. K. Synth. Commun. 2019, 49, 1813–1822. 10.1080/00397911.2019.1605445. [DOI] [Google Scholar]
- Williams A. T. R.; Winfield S. A.; Miller J. N. Relative fluorescence quantum yields using a computer-controlled luminescence spectrometer. The Analyst 1983, 108, 1067–1071. 10.1039/AN9830801067. [DOI] [Google Scholar]
- Velapoldi R. A.; Tonnesen H. H. Corrected emission spectra and quantum yields for a series of fluorescent compounds in the visible spectral region. J. Fluoresc. 2004, 14, 465–472. 10.1023/B:JOFL.0000031828.96368.c1. [DOI] [PubMed] [Google Scholar]
- Rahman M.; Harmon H. J. Absorbance change and static quenching of fluorescence of meso-tetra(4-sulfonatophenyl)porphyrin (TPPS) by trinitrotoluene (TNT), Spectrochim. Spectrochim. Acta, Part A 2006, 65, 901–906. 10.1016/j.saa.2006.01.029. [DOI] [PubMed] [Google Scholar]
- Goswami S.; Chakraborty S.; Paul S.; Halder S.; Panja S.; Mukhopadhyay S. K. A new pyrene based highly sensitive fluorescence probe for copper(II) and fluoride with living cell application. Org. Biomol. Chem. 2014, 12, 3037–3044. 10.1039/c4ob00067f. [DOI] [PubMed] [Google Scholar]
- Zhang H.; Zhong T.; Jiang N.; Zhang Z.; Gong X.; Wang G. Study on the photochromism, photochromic fluorescence switch,fluorescent and colorimetric sensing for Cu2+ of naphthopyrandiaminomaleonitriledyad and recognition Cu2+ in living cells. Spectrochim. Acta, Part A 2020, 233, 118191. 10.1016/j.saa.2020.118191. [DOI] [PubMed] [Google Scholar]
- Shrivastava A.; Gupta V. Methods for the determination of limit of detection and limit of quantitation of the analytical methods. Chron.Young Sci. 2011, 2, 21–25. 10.4103/2229-5186.79345. [DOI] [Google Scholar]
- Shaily A.; Kumar N.; Ahmed N. Ahmed,Imidazo[1,2-a]pyridine-substituted coumarin as a selective ratiometric sensor for Cu2+ ion. Supramol. Chem. 2017, 29, 146–152. 10.1080/10610278.2016.1190453. [DOI] [Google Scholar]
- Mala R.; Nandhagopal M.; Narayanasamy M.; Thennaras S. An Imidazo[1,2-a]pyridine Derivative That Enables Selective and Sequential Sensing of Cu2+and CN Ions in Aqueous and Biological Samples. ChemistrySelect 2019, 4, 13131–13137. 10.1002/slct.201903064. [DOI] [Google Scholar]
- Kumawat L. K.; Kumar M.; Bhatt P.; Sharma A.; Asif M.; Gupta V. K. An easily accessible optical chemosensor for Cu2+ based on novel imidazoazine framework, its performance characteristics and potential applications. Sens. Actuators B Chem. 2017, 240, 365–375. 10.1016/j.snb.2016.08.184. [DOI] [Google Scholar]
- Mala R.; Suman K.; Nandhagopal M.; Narayanasamy M.; Thennarasu S. Chelation of specific metal ions imparts coplanarity and fluorescence in two imidazo[1,2-a]pyridine derivatives: Potential chemosensors for detection of metal ions in aqueous and biosamples. Spectrochim. Acta A 2019, 222, 117236–117237. 10.1016/j.saa.2019.117236. [DOI] [PubMed] [Google Scholar]
- Srivastava S.; Thakur N.; Singh A.; Shukla P.; Maikhuri V. K.; Garg N.; Prasad A.; Pandey R. Development of a fused imidazo[1,2-a]pyridine based fluorescent probe for Fe3+ and Hg2+ in aqueous media and HeLa cells. RSC Adv. 2019, 9, 29856–29863. 10.1039/C9RA04743C. [DOI] [PMC free article] [PubMed] [Google Scholar]
- Yun J. Y.; Chae J. B.; Kim M.; Lim M. H.; Kim C. A multiple target chemosensor for the sequential fluorescence detection of Zn2+and S2–and the colorimetric detection of Fe3+/2+in aqueous media and living cells. PhotochemPhotobioSci 2019, 18, 166–176. [DOI] [PubMed] [Google Scholar]
- Kuzu B.; Tan M.; Ekmekci Z.; Menges N. A novel fluorescent sensor based on imidazole derivative for Fe3+ ions. J. Lumin. 2017, 192, 1096–1103. 10.1016/j.jlumin.2017.08.057. [DOI] [Google Scholar]
Associated Data
This section collects any data citations, data availability statements, or supplementary materials included in this article.


