

Abstract
We have investigated the possible connection between “dynamical anomaly” observed in time-resolved fluorescence measurements of reactive and nonreactive solute-centered relaxation dynamics in aqueous binary mixtures of different amphiphiles and the solution intra- and interspecies H-bond fluctuation dynamics. Earlier studies have connected the anomalous thermodynamic properties of binary mixtures at very low amphiphile concentrations to the structural distortion of water. This is termed as “structural anomaly.” Interestingly, the abrupt changes in the composition-dependent average rates of solute relaxation dynamics occur at amphiphile mole fractions approximately twice as large as those where structural anomalies appear. We have investigated this anomalous solution dynamical aspect by considering (water + tertiary butanol) as a model system and performed molecular dynamics simulations at several tertiary butanol (TBA) concentrations covering the extremely dilute to the moderately concentrated regimes. The “dynamical anomaly” has been followed via monitoring the composition dependence of the intra- and interspecies H-bond fluctuations and reorientational relaxations of TBA and water molecules. Solution structural aspects have been followed via examining the tetrahedral order parameter, radial and spatial distribution functions, numbers of H bonds per water and TBA molecules, and the respective populations participating in H-bond formation. Our simulations reveal abrupt changes in the H-bond fluctuations and reorientational dynamics and tetrahedral order parameter at amphiphile concentrations differing approximately by a factor of 2 and corroborates well with the steady-state and the time-resolved spectroscopic measurements. This work therefore explains, following a uniform and cogent manner, both the experimentally observed structural and dynamical anomalies in microscopic terms.
1. Introduction
Numerous measurements on aqueous binary mixtures of different amphiphilic molecules have repeatedly revealed anomalous changes in thermodynamic properties1−7 that cannot be explained employing the concept of random mixing.8 This means that the Boltzmann equation would be insufficient for estimating the entropy of mixing for these systems because the enthalpy of mixing is not zero or negligible. This in turn indicates that the presence of one species is strongly influencing the interaction among molecules of the other species (same species interaction), rendering statistical mechanical calculations based on the random mixing theory untenable for such solutions. A binary mixture of triethylamine (TEA) and water is a classic example9 wherein water–TEA H-bonding interactions contribute significantly to the enthalpy of mixing. Another important factor that critically regulates the mixing is the hydrophobic interaction arising from the ethyl groups. Hydrophobic interactions coupled with hydrophobic hydration and the interspecies H-bonding interactions therefore jointly govern the physical chemistry of aqueous amphiphilic solutions. Naturally, solution structure and dynamics reflect mixture composition dependence that commensurates with the internal balance between the H-bonding and hydrophobic interactions in such macroscopically homogeneous binary systems.
The structural aspects of aqueous amphiphilic solutions have been explored via neutron diffraction measurements10−13 by employing tertiary butanol (TBA) as a model amphiphile. The water rich-region has been specially investigated in these measurements to understand how hydrophobic interaction of tertiary butyl (−CMe3, Me=CH3) groups among TBA molecules and the corresponding hydrophobic hydration modifies the three-dimensional tetrahedral H-bonding network structure of water. These studies then proceeded further to connect the anomalous mixture composition dependence of different thermodynamic quantities, particularly those measured at very low TBA concentrations, to the modifications in water structure in such solutions. Several simulation and computational studies have examined the hydrophobic hydration-induced modification in solution structure and the role of interspecies H-bonding in binary aqueous mixtures of TBA14−23 and other alcohols.24−29 Interestingly, studies employing TBA as an amphiphile are relatively more in number, although investigations employing other amphiphiles also focused on solute-induced distortion of water structure, solution heterogeneity, and solution dynamics.30−32 The reason for employing TBA emerges from the fact that TBA possesses the largest aliphatic group among monohydroxy alcohols that are miscible with water at any proportion. Because of the presence of both the hydrophobic tertiary butyl group and the hydrophilic hydroxyl (−OH) moiety, TBA molecules can simultaneously participate in hydrophobic and hydrophilic interactions with water. This leads to the segregation of the aqueous solution into microscopic polar and nonpolar domains.33
Steady-state UV–Vis absorption measurements34−37 of aqueous solutions of different amphiphiles employing fluorescent probe molecules in the last several years have repeatedly not only shown unexpected spectral shifts (of probe absorption spectra) upon successive addition of amphiphilic molecules in water but also demonstrated an abrupt change in the direction of the spectral shift (first downward and then upward) at a particular amphiphile concentration. This “passing through a minimum” for absorption spectral shifts occurs at a very low concentration of the amphiphile and is specific to amphiphilic hydrophobicity. This is shown in Table 1, wherein xcosolventmin represents this concentration in mole fraction for a variety of amphiphiles that include 2-butoxyethanol (2-BE),35 TBA,34,36−38 tetrahydrofuran (THF),39 1,4-dioxane (dioxane),39 tetramethylurea (TMU),40 and ethanol.34 The composition-dependent spectral shift in these systems is reproduced in the upper panel of Figure 1 from earlier literature.34−40 The reason for this red shift in absorption spectra in the upper panel is that the local environment gets stiffened at low mole fractions during the accommodation of amphiphiles in the three-dimensional hydrogen-bond network of water. This is felt by the fluorescence solute as an “increase” in the local density that causes a red shift. Notice that for TBA in water, xcosolvent is quite close to the mole fraction of TBA at which the maximum anomaly in the measured thermodynamic quantities has been detected;2,41−46 subsequent neutron diffraction and neutron scattering studies10,13,47,48 have indicated dominance of hydrophobic hydration and hydrophobic interaction-induced solute association at that low mole fraction. Mixture composition-dependent water structure, probed later14 via simulations of the tetrahedral order parameter, reveals a linear decrease of tetrahedrally coordinated water with xTBA in the concentration range studied. One may extend this idea and assume that a similar mechanism of mixing and solvation could be responsible for hosting the other amphiphiles, as shown in Table 1, at very low concentrations in their respective aqueous solutions.
Table 1. Amphiphile Mole Fractions in Binary Aqueous Mixtures Wherein Abrupt Changes Occur in the Steady-State UV–Vis Absorption Spectral Properties and Dynamical Quantities (Average Rate of Population and/or Rotational Relaxations) from Time-Resolved Fluorescence Measurements Employing Neutral Dipolar Fluorophores.
Figure 1.

Amphiphile mole fraction dependence of UV–vis absorption spectral frequencies of a neutral dipolar fluorescent solute, coumarin 153 (C153), in aqueous solutions of BE, EtOH, TBA, and TMU (upper panel), and the average excited-state fluorescence lifetimes (⟨τlife⟩) of the same solute in these aqueous solutions (lower panel). Dotted lines in the upper panel guide the eyes to connect the data for a particular aqueous solution. Vertical broken lines in the lower panel indicate the amphiphile mole fractions at which the abrupt changes in the slopes occur. All data are color-coded.
However, another intriguing observation appears when one carefully examines the corresponding time-resolved fluorescence data reported for these aqueous amphiphilic solutions. These data include mixture composition-dependent average excited-state fluorescence lifetimes (⟨τf⟩) and average rotational correlation times (⟨τr⟩) of a nonreactive probe solute, coumarin 153 (C153), dissolved at micromolar concentrations and have been accessed via monitoring the excited-state population relaxations and dynamic fluorescence anisotropies of the dissolved probe solutes.34−36,38 A reproduction of composition-dependent fluorescence lifetimes (⟨τf⟩) for some systems is provided in the lower panel of Figure 1 from earlier literature34−40 for a better understanding. A simple survey of these composition-dependent average relaxation times (⟨τf⟩ and ⟨τr⟩) immediately reveals that these dynamical quantities exhibit a sharp change in their respective slopes when plotted as a function of amphiphile concentration. The mole fractions at which this sharp changes for ⟨τf⟩ and ⟨τr⟩ occur are denoted by xcosolventdyn in Table 1, and the corresponding experimental values34,35 for aqueous binary mixtures of 2-BE, TBA, THF, dioxane, TMU, and ethanol are summarized. Notice that xcosolvent values are different for different amphiphiles and uniformly greater by approximately a factor of 2 than the corresponding xcosolventmin values. Studies with other nonreactive probe solutes49,50 and solutes that undergo excited-state intramolecular charge transfer reactions36−38 have also reported similar amphiphile concentration dependence. This is intriguing and might very well represent a generic feature for aqueous macroscopically homogeneous amphiphilic solutions. This general observation also suggests that sharp changes are possibly accompanying the solution dynamics at or around these amphiphile mole fractions (xcosolvent).
The probable reasons that lead to connecting the above anomalous composition dependence of ⟨τf⟩ and ⟨τr⟩ to the fluctuations in solution dynamics are as follows. First, the available neutron scattering studies for aqueous alcoholic solutions10−12 do not indicate any qualitative anomaly in the solution structural aspect around xcosolventdyn. Second, the simulated amphiphile–water clusters can persist only for a few to several picoseconds,17,24 and therefore, they cannot probably generate the anomaly in the measured ⟨τf⟩ and ⟨τr⟩ values that are in the sub-nanosecond to a few nanosecond regime.34,35 Third, no anomalous composition dependence of radiative (kr) and nonradiative (knr) population relaxation rates of C153 in binary aqueous mixtures of TBA and ethanol has been found in earlier measurements.34 Fourth, the composition-dependent viscosities51−55 and diffusion56−59 of these solutions cannot be the source for this anomalous mole fraction dependence as the composition-dependent viscosities, as shown in Figure S1, do not indicate any extrema around xcosolvent. The origin of this “dynamical anomaly” may therefore originate from a more fundamental solution aspect than the interlayer momentum transfer60 of component particles. In such a scenario and in the absence of any other studies probing local solution dynamics, it is natural to speculate that fluctuations in the intra- and interspecies H-bond dynamics in these aqueous amphiphilic solutions may bear a connection to this experimental observation that has been termed here as “dynamical anomaly.”
In this work, we have followed the intra- and interspecies H-bond dynamics and solution structural aspects of an amphiphile–water system at various amphiphile concentrations by employing TBA as a model amphiphile. We have monitored the composition dependence of fluctuations in terms of standard deviation by performing computer simulations at 12 TBA mole fractions including the neat systems. These mole fractions are xTBA = 0, 0.01, 0.02, 0.03, 0.04, 0.06, 0.1, 0.13, 0.15, 0.17, 0.2 and 1. Such a closely spaced xTBA has been employed to track the structural and dynamical fluctuations in a fine concentration grid so that the simulation findings can provide microscopic insight into the experimental spectroscopic data already discussed.
Note that such a thorough composition-dependent simulation study probing the H-bond fluctuation dynamics and their connections to the experimentally detected anomalous composition dependence of solute-centered relaxation times in such alcohol–water mixtures and other aqueous amphiphilic systems has not been explored. This is notable considering that several studies20−22,55 have already investigated mixture composition dependence hydrogen-bond dynamics and other solution properties. We have made an attempt here to establish a connection between the simulated solution structure and H-bond fluctuation dynamics and the spectral shifts and the relaxation times reported by the relevant steady-state and time-resolved fluorescence measurements. This is the new aspect of the present work.
The choice of TBA as a model amphiphile is motivated by the availability of neutron scattering studies for aqueous solutions of TBA for very low to low TBA mole fractions which could be used as a benchmark to verify the predictions on structural aspects by the present simulations. In addition, existing simulation results of the TBA–water system employing different model potentials for TBA can provide an idea about the “degree of correctness” of the present simulations. To make the study internally consistent and self-contained, we have monitored the composition-dependent spatial and radial distribution functions, the tetrahedral order parameter, and the relative populations of water and TBA that are participating in the intra- and the interspecies H-bonding in these solutions. All of these together provide cogent and molecular-level explanations for the structural and dynamical anomalies exhibited respectively by the steady-state UV–Vis absorption and the time-dependent fluorescence measurements34−38 discussed above.
2. Methods
2.1. Simulation Details
All-atom model potential for TBA reported in earlier simulations16 has been employed in the present study. In this potential, the anharmonicity in O–H bond stretching has been incorporated via a Morse-type potential. This model potential has been found to successfully reproduce the aggregation behavior of TBA in aqueous solutions.17,61,62 The interaction potential corresponding to this all-atom TBA model has been implemented via the following expression
 |
1 |
where the last term represents the bonded interaction in the form of morse potential for O–H bonds with ρ = 2.44 Å–1 taken from earlier work.62
The four-site TIP4P/2005 model63 of water is employed here, as this rigid four-site model best represents the tetrahedral hydrogen-bond structure of water.64 A total of 10 000 molecules, comprising water and TBA were used in all of the 10 binary mixtures studied. Simulations of neat water were also carried out using 10 000 TIP4P/2005 model water molecules. For neat TBA, simulations employing 128 molecules were carried out. Numbers of participant water and TBA molecules simulated in different compositions are given in Table S1. All force field parameters and the numbers of water and TBA molecules at different compositions used in this work are summarized in Tables S2–S4.
The simulations were performed at 298 K, employing the periodic boundary conditions65 and a Nosé–Hoover thermostat66,67 (with a time constant of 2 ps). The equations of motion were integrated using the velocity-Verlet algorithm65 with a timestep of 1 fs. Electrostatic interactions were calculated using the particle mesh Ewald method of order 4 and with a Fourier spacing of 0.1 nm–1. The nearest-neighbor cutoff for calculations of both the van der Waals and electrostatic interactions was considered as 0.9 nm. All systems were equilibrated for 1 ns in the NPT ensemble. The pressure was kept constant at 1 bar, and the compressibility was maintained at 5 × 10⁻⁵ bar –1 using a Perriello–Rahman barostat with a time constant of 2 ps. Trajectories were saved at every 0.1 ps time gap throughout the production run of 10 ns, after equilibration of 2 ns in the NVT ensemble. For the calculations of H-bond fluctuation dynamics, separate trajectories were generated using the NVT ensemble with the pre-equilibrated trajectories. This time the trajectories were saved at a regular time interval of 0.01 ps to better track the faster relaxation dynamics. We performed block averaging over ten blocks with different time origins while calculating the variance of hydrogen-bond timescales.
The equilibrated density of all of the simulated systems along with experimentally available densities and earlier simulated density of neat TBA is provided in Table S5. The agreement between the simulations and experimental data is satisfactory. The GROMACS 4.5.6 simulation package68−72 was used for simulation studies reported here. For calculations and visualization of the surface distribution functions (SDFs), TRAVIS73 and VMD74 software packages were used.
2.2. Coordination Numbers and Tetrahedral Order Parameters
Coordination numbers of a species (j) around another the same/different species molecule (i) have been calculated via a formula wherein we have used the first minimum distances of RDFs as shell radii for the relevant calculations
| 2 |
where gij(r) denotes the intra- and interspecies RDFs at various solution mole fractions studied. Note that the CN calculated in this way represents the number of jth particles in the first solvation shell of the ith particle in a binary mixture and is different from the total coordination number that accounts for molecules of both the components that together constitute the full solvation shell.
The tetrahedral order parameter (Q) is defined as follows75
| 3 |
where Qi is the tetrahedral order parameter of the ith water molecule and θijk is the angle subtended by each pair (designated by j and k) of the nearest four water molecules on the central ith water molecule. For a random and uniform distribution of these angles, Q = 0; for a perfect tetrahedral structure, on the other hand, Q = 1. A schematic diagram for the general description of the tetrahedral angle and three-dimensional tetrahedral structure of the H-bond network in the bulk water is shown in Figure S2.
The following conditions76,77 have been followed to detect H bonds between water molecules: (a) the distance between the donor oxygen atom and the acceptor oxygen atom is less than 0.35 nm, (b) the O–H (donor)–O (acceptor) angle is less than 30°, and (c) the distance between the oxygen (O) and hydrogen (H) atoms must be less than 0.245 nm.
For monitoring alcohol–alcohol hydrogen bonding, the geometrical criteria78 that have been considered are as follows: (a) the distance between the donor and acceptor oxygen atoms is less than 0.35 nm, (b) the O–H (acceptor)–O (donor) angle is less than 30°, and (c) the distance between O (donor) and H (acceptor) is less than 0.28 nm.
The above criteria for detecting H-bonding between TBA molecules have also been employed for monitoring TBA–water H-bonding. The fractions of TBA and water molecules participating in intra- and interspecies H-bonding have been calculated to find nonparticipation of any of the species at any mixture composition. Results obtained from this analysis are expected to complement the results on xTBA dependence of the average number of H bonds per TBA or water. While calculating the average number of hydrogen bonds per molecule, we have considered only the participant molecules, not all of the molecules of a given species that are present in a solution at a particular TBA mole fraction.
2.3. Hydrogen-Bond Lifetimes
To characterize TBA–water and water–water H-bond dynamics, we have monitored two H-bond autocorrelation functions, namely, continuous and structural H-bond relaxation.
The lifetime of a continuous H bond has been calculated from the time-correlation function (SHB(t))76,79,80
| 4 |
H(t), a hydrogen-bond population operator, is unity when the particular tagged pair of molecules is hydrogen-bonded and zero otherwise. H(t) takes a value 1 if the tagged pair of molecules, for which h(0) is calculated, remains continuously H-bonded for a time t or else H(t) = 0. SHB(t) describes the probability that a tagged pair of molecules remains H-bonded for a timespan t, and it approaches zero when continuity of the H bond between them breaks down. The average continuous H-bond lifetime is then obtained via the time integration of SHB(t)
| 5 |
Structural H-bond relaxation dynamics has been followed via the dynamic correlation function (CHB(t))
| 6 |
Here, the reformation of a hydrogen bond with another neighboring molecule, after the rupture of a hydrogen bond with an initial partner, is allowed and accounted for. The average structural H-bond lifetimes (⟨τCHB⟩avg) are then obtained by time integrating the multiexponential fit functions that adequately describe the simulated decays of the correlation function
| 7 |
The fluctuations (or variance) in these average timescales are calculated as follows
| 8 |
For calculating variance, the block averaging method has been adapted. The continuous H-bond relaxation (SHB(t)) and the structural counterpart (CHB(t)) have been calculated for ten time blocks.
2.4. Reorientational Time-Correlation Function (RTCF)
To correlate the hydrogen-bond dynamics with rotation
of OH vector of both TBA and water molecules, we calculate the collective
single-particle RTCF of rank  via the following prescription
| 9 |
where  denotes the Legendre polynomial
of rank
denotes the Legendre polynomial
of rank  and ui is a unit vector
parallel to the OH bond
vector of both water and TBA molecules. Here, also, we have calculated
composition-dependent average reorientational times (⟨τrot⟩) of rank
and ui is a unit vector
parallel to the OH bond
vector of both water and TBA molecules. Here, also, we have calculated
composition-dependent average reorientational times (⟨τrot⟩) of rank  and the corresponding variances associated
with them following eqs 7 and 8 described earlier.
and the corresponding variances associated
with them following eqs 7 and 8 described earlier.
3. Results and Discussion
As we have already stated, the main focus of this work is to thoroughly investigate the microscopic reasons behind the abrupt changes in the mole fraction dependent average relaxation times reported in measurements employing a fluorescent solute in aqueous amphiphilic solutions, and we followed the H-bond relaxation dynamics in detail. However, structural details have also been carefully examined to explain the mole fraction dependence of the steady-state absorption spectral shifts, which is connected to the structural anomaly. This is done to make the study uniform and internally consistent.
3.1. Radial Distribution Function (RDF) and Coordination Number (CN)
The composition dependence of the center-of-mass (COM) RDFs for TBA–TBA, TBA–water, and water–water has been monitored for this aqueous amphiphilic solution. All of these RDFs are depicted in Figure S3. The simulated RDF peak values, representing the RDF value at contact ((g(σ)) σ being the distance of the closest approach between the central molecule and another molecule as the nearest neighbor), are shown as a function of the TBA mole fraction (xTBA) in the upper panel of Figure S4. Numbers corresponding to Figure S4 are provided in Table S6. The inset of this panel shows the composition-dependent ratio between g(σ) at a given xTBA and that for neat TBA, Rpeak = [g(σ)]xTBA/[g(σ)]xTBA = 1. The g(σ) values for neat TBA and neat water are summarized in Table S7. The nonmonotonic dependence of the RDF peak indicates aggregation of TBA molecules in dilute aqueous solutions, the extent of aggregation being the maximum at xTBA ∼ 0.04. This is the mole fraction at which the UV–vis absorption spectra of reactive and nonreactive fluorescent probes showed minima before reversing the direction of the composition dependence upon further addition of TBA in water.34,37,38 This nonmonotonicity has been found in earlier simulation studies14,15,18,81−84 and explained in terms of TBA aggregation following observations from the relevant neutron scattering measurements.10,48,85 The interesting aspect here, however, is the simulation predictions of appreciable TBA aggregation even at extremely low concentrations, xTBA < 0.04, a mole fraction range not accessible to neutron scattering measurements because of low signal-to-noise ratios.10 Data in the inset suggests a sharp increase of (σ), from ∼1.5 times with respect to that for neat TBA (g(σ) = 2.03 for neat TBA) to ∼2.5 times for changing xTBA from 0.01 to 0.03 in the aqueous solution. In this mole fraction regime, the TBA–water g(σ) decreases sharply (middle panel), indicating hydrophobic hydration of the aggregated TBA cluster. This is reinforced by the concomitant increase in the water–water g(σ) (lower panel), although the inset shows that the increase is limited to ∼20% over the value for neat water. This increase in TBA–TBA and water–water g(σ) with a simultaneous decrease in TBA–water g(σ) upon successive addition of TBA in aqueous solution in the very low TBA mole fraction regime indicates hydrophobicity-driven aggregation of TBA followed by hydrophobic solvation, a conclusion in agreement with the general observation of several existing simulation14,15,81−83 and experimental10,48,85,86 studies.
The next question we investigate is what happens to this hydrophobicity-driven TBA aggregation at xTBA > 0.04? The TBA–TBA g(σ) clearly decreases as xTBA is further increased. Interestingly, this aggregation is not completely diminished even at xTBA = 0.2, a TBA concentration at which one expected that the solution structure would be governed by alcohol–alcohol interactions.10 The value of TBA–TBA g(σ) at xTBA = 0.2 being 1.5 times larger than that in neat TBA suggests that hydrophobic interaction among alcohol molecules is still operative and the subsequent hydrophobic hydration leads to a continuous increase of water–water g(σ) (lower panel) and a consequent decrease of TBA–water g(σ). The water–water g(σ) being ∼2.4 times larger at xTBA = 0.2 than that for neat water reflects the inherent demixing at the microscopic level between these two mixture components. The extent of demixing is different for different model potentials, and this is the reason, for example, behind predicting uniformly lower TBA–TBA g(σ) values in this xTBA range employing the Lee–van der Vegt potential in simulation studies reported earlier.81
Next, we investigate the xTBA dependences of intra- and interspecies coordination numbers and the intraspecies percentages of populations in the nearest neighbor. This is done to closely examine whether the first solvation shells and thus the local solution structures themselves carry the imprint of structural anomalies that are then reflected in the steady-state and time-resolved spectroscopic studies. The numbers of TBA molecules around a central TBA molecule (CNTT), water molecules around a central TBA molecule (CNTW), and water molecules around a central water molecule (CNWW) have been estimated as a function of xTBA via eq 2.
The simulated coordination numbers and fraction populations at different xTBA are summarized in Figure 2. Table S7 shows the corresponding quantities for neat water and neat TBA. All CNs and corresponding participating populations plotted in Figure 2 are given in Table S8. It is quite interesting to note that the TBA–TBA coordination number (left upper panel) shows a mild hump at xTBA ∼0.04, which becomes a distinct peak in the curve showing the xTBA dependence of percentage population in the first solvation shell (right upper panel). This relative increase of percentage population in the first solvation shell for mixtures up to xTBA ≤ 0.04, followed by an exponential-like decrease upon further increase of TBA concentration, reflects hydrophobicity-induced TBA aggregation in very dilute aqueous TBA solutions. Such nonmonotonic xTBA dependence is absent for the simulated population percentage of water molecules in the first solvation shell of TBA, and a gradual decrease with TBA concentration is noticed for both the coordination number and the population (middle panels). The water–water coordination number, on the other hand, shows a sharp change in the direction of alcohol concentration dependence at xTBA ∼0.04 (lower left panel); this sharp change becomes a flat minimum around this mole fraction for the simulated water–water percentage population (lower right panel).
Figure 2.

Composition-dependent coordination numbers
(left column) and the
corresponding fraction of particles within the first solvation shell
(right column). The upper panel presents simulated data for TBA–TBA,
the middle panel presents simulated data for TBA–water, and
the lower panel presents simulated data for water–water. Insets
show the data ratioed against the values in the respective neat solvents,  . Note here that the neat solvent appearing
in the denominator is neat TBA for the upper panels (left and right)
and neat water for the lower panels (left and right).
. Note here that the neat solvent appearing
in the denominator is neat TBA for the upper panels (left and right)
and neat water for the lower panels (left and right).
3.2. Number of H Bonds and Participating Populations
The solution structure is further investigated by probing the intra-and interspecies H-bonding interactions and the percentage of respective populations participating in such interactions. The geometric conditions for detecting a hydrogen bond between a donor and acceptor are discussed in detail in Section 2.2. A variety of H-bonded molecular complexes can coexist in these binary mixtures because of the presence of −OH groups in both TBA and water, which can simultaneously act as a H-bond donor and a H-bond acceptor. This gives rise to the possible existence of both exclusively intraspecies H-bonded complexes (for example, via TBA–TBA and water–water interactions) and mixed interspecies H-bonded complexes (via TBA interactions both with water and TBA molecules) in these aqueous amphiphilic solutions. Our aim here is to clarify whether at extremely low TBA concentrations there exist any direct TBA–TBA contacts or it is the neighboring water molecules that host each of the TBA molecules separately in clathrate-type environments. In addition, one would like to know what happens to water–water direct contacts, and its tetrahedral network structure as xTBA is successively increased in solutions. More importantly, one would like to know whether the average H-bond properties of any of the H-bonded complexes exhibit anomalous TBA concentration dependence that can be explained in microscopic terms by the steady-state and time-resolved spectroscopic data discussed here.
Figure 3 depicts the composition-dependent number of hydrogen bonds per molecule Ni–jHB (left panel) and fractions of the populations (in percentage) that are participating and not participating in forming inter-molecular H bonds (right panel). The average number of intermolecular H bonds between TBA–TBA in neat TBA (NT–T) and water–water in neat water (NW–WHB) and the corresponding population percentages are simulated and summarized in Table S9. Notice that NT–T increases with xTBA and approaches toward the value for neat TBA (upper panel in Figure 3). Interestingly again, the increase in NT–THB with xTBA is much sharper for solutions with xTBA ≤ 0.04 than those at higher mole fractions. The TBA population that participates in TBA–TBA H-bonding (P, upper right panel in Figure 3) is gradually approaching with xTBA toward the neat value (54%) but not before showing a different slope of increase for solutions with xTBA ≤ 0.04. The nonparticipating population (NP) depicts, as expected, the mirror image of the xTBA dependence found for the participating population. At extremely dilute solutions (xTBA ≤ 0.03), the TBA–TBA direct H-bonding is very rare, and in this regime, the H-bonding requirement is satisfied via interacting exclusively with water (middle panel of Figure 3). The overwhelming domination of TBA–water interaction via ∼100% participation of water at these mixture compositions provides a further support to the view of clathrate-type structure formation in aqueous solutions at extremely dilute amphiphile concentrations. The xTBA-dependent number of water–water H bonds, NW–W, on the other hand, shows a mild kink at xTBA ∼0.12 (lower left panel of Figure 3), whose signature can also be found for the number of H bonds between TBA and water per TBA molecule, NT–WHB (middle panel of Figure 3). Participation of each of the water molecules in forming a H bond with another water molecule across the xTBA studied (lower right panel of Figure 3) only confirms the irresistible tendency of water molecules in forming H bonds with its neighbors and preserving its three-dimensional tetrahedral network structure.
Figure 3.

Composition-dependent number of H bonds per molecule (left column) and fractional participating (P) and nonparticipating (NP) populations in the formation of H bonds (right column). Insets represent data ratioed against the corresponding values for the neat solvents.
TBA possesses the hydroxyl (−OH) group and
therefore, like
water, can act as both a donor and an acceptor for H-bonding. This
gives rise to the possibility of TBA forming (i) H bonds only with
water, (ii) only with TBA, (iii) simultaneously both with water and
TBA, and (iv) remaining free (not H-bonded) in these binary mixtures.
Since the anomalous mole fraction dependent thermodynamic properties
of these amphiphilic aqueous solutions have been believed to reflect
the underlying microscopic solution structure, a close examination
of these H-bonded complexes may provide a clue to explain the composition-dependent
steady-state and time-resolved spectroscopic properties. We present
in Figure 4 the simulated
populations of TBA molecules that have participated in the intra-
and inter-molecular H-bonding, and those not interacting via H-bonding
in solutions at different mole fractions. Numbers depicted in Figure 4 are summarized in Table S10. The composition-dependent respective
populations shown in the upper panel of Figure 4 indicate that the TBA population H-bonded
exclusively with water (water–TBA–water) dominates the
solution up to xTBA ≤ 0.15, while
the population of TBA interacting simultaneously with both water and
TBA (water–TBA–TBA) remains the least across the mole
fraction studied. The population denoting the exclusive interaction
of TBA with water (water–TBA–water) decreases with xTBA, whereas TBA–TBA–TBA, water–TBA–TBA,
and non-H-bonded TBA populations increase, with varying extent, upon
successive addition of TBA in the aqueous solution. Interestingly,
the composition dependence of these populations in solutions with xTBA ≤ 0.04 is rather irregular and somewhat
different from that at higher mole fractions. We note here that the
mixed H-bonded population, TBA–TBA–water, remains within
∼5% of the total population and appears to be nearly insensitive
to xTBA. When this rather weak dependence
is magnified in the lower panel of Figure 4, two peaks, one well-formed and the other
somewhat diffused, are clearly visible at xTBA ∼0.04 and ∼0.10, respectively. This double-peak behavior
of the composition dependence becomes more prominent in the inset
where the rate of change of population with TBA mole fraction,  , is shown as a function of xTBA. For a proper estimation of errors associated with
this interesting double-peak feature, we provide the error bars (standard
deviation) in the lower panel of Figure 4.
, is shown as a function of xTBA. For a proper estimation of errors associated with
this interesting double-peak feature, we provide the error bars (standard
deviation) in the lower panel of Figure 4.
Figure 4.

(a) Composition-dependent fraction of TBA molecules (in %) H-bonded only to TBA (T–T), only to water (T–W), both to TBA and water (T–T–W), and not H-bonded to any one of them (T). (b) TBA population H-bonded to both TBA and water molecules (T–T–W) shown in an expanded scale with associated errors (standard deviation). The inset depicts the composition-dependent slope of the T–T–W population.
3.3. Tetrahedral Order Parameter
Next, we explore the impact of TBA on the tetrahedral network structure of water across the mole fractions for detecting abrupt changes, if any, in the composition dependence of tetrahedrality of water. This has been studied via calculating tetrahedral order parameter following eq 3 and its distributions in different composition solutions. Our earlier works have already revealed substantial disruption of water tetrahedrality in the presence of simple alcohol like methanol in bulk aqueous binary mixtures and for confined water molecules near a charged interface.87,88
The effects of TBA and its concentration on the tetrahedral H-bond network of water have been studied via the tetrahedral order parameter (Q) defined in eq 3 mentioned and discussed earlier.
The xTBA-dependent distribution of
the tetrahedral order parameter (P(Q)), as shown in Figure S5, reveals that
the tetrahedral water population (molecules that are tetrahedrally
H-bonded) molecules are increasingly transferred toward the less coordinated
population upon successive addition of TBA. This is also reflected
in the distribution of angles among the central water and its neighboring
water molecules (P(cos θ)), shown in Figure S6. Figure 5 depicts the composition-dependent ensemble-averaged
tetrahedral order parameter along with its associated error bars (standard
deviation) for water in aqueous TBA solutions. Ensemble-averaged Q values are summarized in Table S11. For neat water,88Q ≈ 0.67. As the TBA concentration increases, Q decreases, suggesting amphiphile-induced partial disruption of water
tetrahedrality. This has been reported already in a number of simulation
studies that involve aqueous binary mixtures of alcohols.14,87 What has not been examined in those studies, however, is the rate
of change of water tetrahedrality as a function of the alcohol mole
fraction. This composition-dependent slope,  , is shown in the inset of Figure 5, which clearly indicates appreciable
changes in the water tetrahedrality at two TBA mole fractions: one
is around 0.04 and the other is ∼0.12. More importantly,
, is shown in the inset of Figure 5, which clearly indicates appreciable
changes in the water tetrahedrality at two TBA mole fractions: one
is around 0.04 and the other is ∼0.12. More importantly,  makes a better
visual representation of
the deformation that the tetrahedral H-bond network of water suffers
while accommodating TBA without allowing macroscopic demixing. The
weak irregularity in the xTBA dependence
of Q becomes more evident in the composition-dependent
slope and correlates well with the xTBA dependence observed in the relevant steady-state and time-resolved
spectroscopic measurements.
makes a better
visual representation of
the deformation that the tetrahedral H-bond network of water suffers
while accommodating TBA without allowing macroscopic demixing. The
weak irregularity in the xTBA dependence
of Q becomes more evident in the composition-dependent
slope and correlates well with the xTBA dependence observed in the relevant steady-state and time-resolved
spectroscopic measurements.
Figure 5.

Composition-dependent ensemble-averaged tetrahedral order parameter value (⟨Q⟩) of water molecules in the aqueous TBA solutions studied. The tetrahedral order parameter for neat water is also shown. The standard deviations associated with these data are also plotted. The inset depicts the slope of composition-dependent tetrahedral order parameter values.
3.4. Spatial Distribution Function (SDF)
We have already gained a qualitative idea about the relative spatial arrangements of TBA and water in these aqueous binary mixtures via the simulated RDFs. However, RDF being two dimensional and thus far removed from the real solution scenarios, it cannot depict the solvation structure around a central molecule in an actual solution condition. A better description of the solvation structure in solutions can be obtained via accessing the surface distribution functions (SDFs).84,89 This has been performed by TRAVIS software.73 Composition-dependent SDFs related to the spatial arrangements of water and TBA molecules around a central TBA molecule are shown in Figure 6. The isosurfaces are mapped corresponding to those isovalues (local number densities) that suggest the completion of the first solvation shell of the TBA molecule under focus. Isovalues corresponding to TBA and water isosurfaces are summarized in Table S12. Figure S7 (left panel) shows the xTBA dependence of isovalues for TBA– TBA SDFs. Interestingly, these isovalues qualitatively follow the trend of the composition-dependent intensities of the first minima of TBA–TBA, shown in Figure S7 (right panel). Note that these isovalues correspond to the first minima found in g(r,θ,ϕ).89,90 As the present analysis involves only the center of mass of the concerned molecules, SDFs shown here would be less anisotropic than those constructed after considering atomistic distribution functions.
Figure 6.

Composition-dependent spatial distribution functions (SDFs) for water and TBA molecules around a reference TBA molecule. Blue denotes water surface, and red denotes TBA surface.
In Figure 6, the blue surface corresponds to water and the red surface to TBA molecules. Notice that water molecules completely encapsulate the reference TBA molecule symmetrically in aqueous mixtures up to xTBA ≤ 0.04. The remaining TBA molecules are then found to surround the water layer that had encapsulated the central TBA molecule. This suggests that TBA–TBA direct contact at these low TBA concentrations is rare. However, this could not be verified in neutron scattering measurements because of low signal-to-noise ratios. The number of H bonds per water molecule and the water tetrahedral network structure have been found to be slightly affected in this concentration regime (see Figures 4 and 6). For solutions with xTBA ≥ 0.06, water isosurface surrounding the reference TBA becomes asymmetric. This suggests hydrophobic hydration of the tertiary butyl groups of the TBA molecules. Note two TBA isosurfaces exist near the reference TBA molecules at all compositions studied. This is because of the similar depths in the first and second minima of the composition-dependent TBA–TBA RDFs (see Figure S3). For solutions with xTBA > 0.06, TBA molecules allow very little interstitial space for water molecules, and as a result, the water surface smears out. This corroborates with the composition-dependent population of TBA molecules that are not participating in H-bond formation with either water or TBA molecules (see Figure 4).
3.5. Hydrogen-Bond Relaxation Dynamics
3.5.1. Continuous H-Bond Relaxation (SHB(t))
The simulated composition-dependent average continuous H-bond lifetime ⟨τsHB⟩ following eq 5 and the corresponding fluctuations, calculated via eq 8, are summarized in Table S13. Figure 7 shows the composition-dependent lifetime (⟨τs⟩) and variance (στx2) for the continuous water–water, TBA–water, and TBA–TBA H-bond relaxation dynamics. The choice of these intra- and interspecies H-bond relaxations arises from the simulated composition dependence of the population of the TBA molecules that are H-bonded simultaneously both with neighboring water and TBA molecules. It is interesting to note that water–water H-bond relaxation time (⟨τs⟩) shows appreciable fluctuations around xTBA ∼0.1, whereas such fluctuations around this mole fraction are absent for TBA–water and TBA–TBA continuous H-bond lifetimes (right panels of Figure 7). The individual intraspecies lifetimes, however, are larger by ∼15 to 25% than their respective neat values, and this is shown in Figure S8. The TBA–water H-bond lifetimes, on the other hand, are larger by ∼40 to 120% than the TBA–TBA neat value (⟨τsHB⟩ = 0.26 ps for neat TBA) and reaches the water–water neat value (⟨τs⟩ = 0.57 ps for neat water) at xTBA ∼ 0.1.
Figure 7.

Composition-dependent average continuous H-bond relaxation times (⟨τSHB⟩) (left column) and the corresponding fluctuations (right panel) of TBA–TBA, TBA–water, and water–water H-bonded molecules.
Surprisingly, in an earlier study22 on hydrogen-bond lifetime distribution in TBA–water solution, the average continuous H-bond lifetime (⟨τsHB⟩) of neat water has been reported to be 85 fs. This is an order of magnitude faster than the continuous hydrogen-bond lifetime (⟨τS⟩ ∼0.5 to 1 ps) repeatedly reported in earlier simulation87,91−93 and experimental studies94−97 by various authors from different laboratories. In the present study, we have found ⟨τSHB⟩ ∼0.5 to 0.6 ps, which is in very good agreement with these reported simulation and experimental results. In view of these, the sub-100 fs value for ⟨τs⟩ appears to be erroneous.
3.5.2. Structural H-Bond Dynamics Relaxations (CHB(t))
We have also explored the composition dependence of the average structural H-bond relaxation times ⟨τCHB⟩ following eq 7. The ⟨τC⟩ and the variances associated with ⟨τCHB⟩, στC, are calculated via eq 8 and shown simultaneously in Figure 8. All of the data presented in Figure 8 are summarized in Table S14. It is interesting to note the results presented in Figure 8 for ⟨τCHB⟩ follow qualitatively the similar trend to that found in the composition dependence of ⟨τS⟩ in Figure 7. Notice that the associated variances are ∼1 to 3 orders of magnitude lower than the corresponding average relaxation times. These provide the necessary confidence for establishing a possible connection between the anomalous mole fraction dependence of spectral shifts and relaxation times reported in experiments to the simulated H-bond participation populations and H-bond fluctuation dynamics in these alcohol–water systems.
Figure 8.

Composition-dependent average structural H-bond relaxation times (⟨τCHB⟩) (left column) and the corresponding fluctuations (right panel) of TBA–TBA, TBA–water, and water–water H-bonded molecules.
Note that these structural H-bond relaxation times (⟨τCHB⟩) are easily experimentally accessible, unlike continuous H-bond relaxation times (⟨τS⟩). This ⟨τCHB⟩ are known79,80,87,88,98−100 to be strongly coupled to the translational diffusion of H-bonded molecules. Significant fluctuations in structural H-bond relaxation of water–water and TBA–water H bonds at xTBA ∼0.15 have been found where anomalies have been reported in experiments for various aqueous amphiphilic solutions.34−40 This suggests a correlation between hydrogen-bond fluctuation dynamics and experimentally observed dynamic anomaly at a composition nearly twice as large as the composition where structural anomalies have been found.
3.6. Reorientational Time-Correlation
Function
of Rank 
The connection between H-bond
fluctuations dynamics and relaxation dynamics is further explored
via monitoring the composition dependence of reorientational relaxation
dynamics of O–H bond vectors of TBA and water molecules in
these mixtures. Figure 9 shows the composition dependence of water and TBA average reorientational
correlation times of the first rank ( ) and the associated fluctuations (in terms
of variance) with them. Data presented in Figure 9 are summarized in Table S15. A few representative C1(t) decays in Figure S9 show that
these decays are complete within the timespan monitored and could
be adequately described using a sum of exponential functions. Note
the nonmonotonic dependence of average reorientational times for both
species. This contrasts the composition dependence of experimental
viscosity in this TBA concentration range, as shown in Figure S1. What is even more interesting is the
composition dependence of the respective variances (right panels, Figure 9). It is quite intriguing
that the variances associated with reorientation times (⟨τrot⟩) at
) and the associated fluctuations (in terms
of variance) with them. Data presented in Figure 9 are summarized in Table S15. A few representative C1(t) decays in Figure S9 show that
these decays are complete within the timespan monitored and could
be adequately described using a sum of exponential functions. Note
the nonmonotonic dependence of average reorientational times for both
species. This contrasts the composition dependence of experimental
viscosity in this TBA concentration range, as shown in Figure S1. What is even more interesting is the
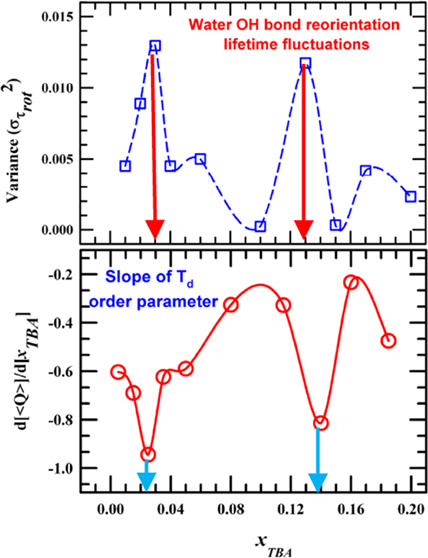
composition dependence of the respective variances (right panels, Figure 9). It is quite intriguing
that the variances associated with reorientation times (⟨τrot⟩) at  show peaks at TBA mole fractions where
UV–vis spectral shifts34−40 and experimental relaxation times (average lifetimes, reaction times,
and solute reorientation times)34−38 have been found to exhibit anomalous mole fraction dependence.
show peaks at TBA mole fractions where
UV–vis spectral shifts34−40 and experimental relaxation times (average lifetimes, reaction times,
and solute reorientation times)34−38 have been found to exhibit anomalous mole fraction dependence.
Figure 9.

Composition-dependent average times for rotational time-correlation function of rank (l = 1) (left column) and the corresponding fluctuations (right panel) of OH-bond vector of TBA and water molecules.
Quite interestingly, the composition dependence of the rate of change in global tetrahedral order (⟨Q⟩) shown in the inset of Figure 5 also indicates anomalous changes at similar TBA concentrations. All of these simulation data, when juxtaposed against the xTBA dependencies of the measured average relaxation times, appear quite intriguing and suggest a novel interplay between the amphiphile concentration dependent H-bond and related reorientation fluctuation dynamics and the excited-state population or rotational relaxations of a fluorescent solute probe dissolved in such media.
4. Conclusions
In summary, the present simulations find significant fluctuations in the water–water continuous H-bond lifetime and water–water and TBA–water structural H-bond lifetimes, and the average reorientational relaxation times in binary aqueous mixtures of TBA around the alcohol mole fraction where time-resolved fluorescence measurements have repeatedly reported abrupt changes in the mixture composition-dependent average fluorescence lifetimes and rotational correlation times of dissolved foreign solutes. Such a finding is new and probably signals an interconnection between the solution H-bond dynamics and fluorescence dynamics of a dissolved solute probe. Previous works have established that the three-dimensional H-bond network structure of water distorts to accommodate small amphiphilic molecules. However, no study was conducted to probe the impact of such distortion on the H-bond relaxation dynamics and the average lifetime. This study makes an attempt to address that concern and opens up a possibility for examining this interconnection between the H-bond relaxation dynamics of aqueous mixtures and the reactive and nonreactive dynamics of dissolved fluorescent solutes in them. However, we would like to mention that the H-bonding results (especially the dynamics) of such alcohol/water and other aqueous amphiphilic systems may depend substantially on the choice of model interaction potentials, although the qualitative trend of composition dependence is expected to be similar if the different potentials are parameterized to capture both the hydrophobic and hydrophilic interactions of amphiphilic molecules with water. Therefore, the results presented here should only be considered within the assumption of the validity of the model interaction potential employed. Even with this caveat, it would be worth exploring a variety of aqueous amphiphilic solutions to establish the connection between the solution H-bond structure and dynamics found in simulations to experimental data accessed via scattering measurements and time-resolved experiments. This will further our understanding of how the tetrahedral network of water is sustained in environments where hydrophobic interactions are expected to reign solution structure. This calls for careful scrutiny of molecular lengthscale spatial arrangements and investigation of finer details of the solution structure in such binary systems.
Acknowledgments
A.B. thanks the Council for Scientific and Industrial Research (CSIR), India for providing a research fellowship. CRAY supercomputing facility at the S. N. Bose Centre for Basic Sciences is gratefully acknowledged. A.B. thanks Prof. P.G. Kusalik, University of Calgary for useful suggestions and discussions.
Supporting Information Available
The Supporting Information is available free of charge at https://pubs.acs.org/doi/10.1021/acsomega.1c06831.
Force field parameters along with charge distribution of TBA atoms; simulation density comparison with experiments; radial distribution function between TBA–TBA, TBA–water, and water–water at all compositions; probability distribution for tetrahedral order parameter and tetrahedral angle; ensemble-averaged tetrahedral order parameter values; table of isovalues corresponding to TBA–TBA and TBA–water SDFs; similarity between TBA–TBA isovalues and TBA–TBA g(σ); continuous and structural inter- and intraspecies hydrogen-bond relaxation times and corresponding variance values; reorientational relaxation times; and associated variance values (PDF)
The authors declare no competing financial interest.
Supplementary Material
References
- Roux G.; Roberts D.; Perron G.; Desnoyers J. E. Microheterogeneity in Aqueous-Organic Solutions: Heat Capacities, Volumes and Expansibilities of Some Alcohols, Aminoalcohol and Tertiary Amines in Water. J. Solution Chem. 1980, 9, 629–647. 10.1007/BF00645894. [DOI] [Google Scholar]
- Nakanishi K. Partial Molal Volumes of Butyl Alcohols and of Related Compounds in Aqueous Solution. Bull. Chem. Soc. Jpn. 1960, 33, 793–797. 10.1246/bcsj.33.793. [DOI] [Google Scholar]
- Jones P.; Covington A. K.. Symposium on Equilibria and Reaction Kinetics in Hydrogen-Bonded Solvent Systems. In Hydrogen-Bonded Solvent Systems: Proceedings; Wynne-Jones W. F. K., Ed.; University of Newcastle upon Tyne: Routledge, 1968. [Google Scholar]
- Franks F.; Reid D. S. In Water: A Comprehensive Treatise; Franks F., Ed.; Springer, 1973. [Google Scholar]
- Koga Y.Solution Thermodynamics and Its Application to Aqueous Solutions: A Differential Approach; Elsevier, 2017. [Google Scholar]
- Koga Y. Mixing Schemes in Aqueous Solutions of Nonelectrolytes: A Thermodynamic Approach. J. Phys. Chem. A 1996, 100, 5172–5181. 10.1021/jp952372d. [DOI] [Google Scholar]
- Egorov G. I.; Makarov D. M. Densities and Volume Properties of (Water+ Tert-Butanol) over the Temperature Range of (274.15 to 348.15) K at Pressure of 0.1 MPa. J. Chem. Thermodyn. 2011, 43, 430–441. 10.1016/j.jct.2010.10.018. [DOI] [Google Scholar]
- Boucher E.; Murrell J.. Properties of Liquids and Solutions; Wiley, 1982. [Google Scholar]
- Atkins P.; De Paula J.. Elements of Physical Chemistry; Oxford University Press: USA, 2013. [Google Scholar]
- Bowron D.; Finney J.; Soper A. Structural Investigation of Solute– Solute Interactions in Aqueous Solutions of Tertiary Butanol. J. Phys. Chem. B 1998, 102, 3551–3563. 10.1021/jp972780c. [DOI] [Google Scholar]
- Bowron D.; Moreno S. D. The Structure of a Concentrated Aqueous Solution of Tertiary Butanol: Water Pockets and Resulting Perturbations. J. Chem. Phys. 2002, 117, 3753–3762. 10.1063/1.1495397. [DOI] [Google Scholar]
- Bowron D.; Díaz Moreno S. The Structure of a Trimolecular Liquid: Tert-Butyl Alcohol: Cyclohexene: Water. J. Phys. Chem. B 2005, 109, 16210–16218. 10.1021/jp052912z. [DOI] [PubMed] [Google Scholar]
- Dixit S.; Crain J.; Poon W.; Finney J. L.; Soper A. K. Molecular Segregation Observed in a Concentrated Alcohol–Water Solution. Nature 2002, 416, 829–832. 10.1038/416829a. [DOI] [PubMed] [Google Scholar]
- Banerjee S.; Furtado J.; Bagchi B. Fluctuating Micro-Heterogeneity in Water–Tert-Butyl Alcohol Mixtures and Lambda-Type Divergence of the Mean Cluster Size with Phase Transition-like Multiple Anomalies. J. Chem. Phys. 2014, 140, 194502 10.1063/1.4874637. [DOI] [PubMed] [Google Scholar]
- Gupta R.; Patey G. N. Aggregation in Dilute Aqueous Tert-Butyl Alcohol Solutions: Insights from Large-Scale Simulations. J. Chem. Phys. 2012, 137, 034509 10.1063/1.4731248. [DOI] [PubMed] [Google Scholar]
- Kusalik P. G.; Lyubartsev A. P.; Bergman D. L.; Laaksonen A. Computer Simulation Study of Tert-Butyl Alcohol. 1. Structure in the Pure Liquid. J. Phys. Chem. B 2000, 104, 9526–9532. 10.1021/jp001886w. [DOI] [Google Scholar]
- Kusalik P. G.; Lyubartsev A. P.; Bergman D. L.; Laaksonen A. Computer Simulation Study of Tert-Butyl Alcohol. 2. Structure in Aqueous Solution. J. Phys. Chem. B 2000, 104, 9533–9539. 10.1021/jp001887o. [DOI] [Google Scholar]
- Paul S.; Patey G. Why Tert-Butyl Alcohol Associates in Aqueous Solution but Trimethylamine-N-Oxide Does Not. J. Phys. Chem. B 2006, 110, 10514–10518. 10.1021/jp0609378. [DOI] [PubMed] [Google Scholar]
- Overduin S.; Patey G. Comparison of Simulation and Experimental Results for a Model Aqueous Tert-Butanol Solution. J. Chem. Phys. 2017, 147, 024503 10.1063/1.4990505. [DOI] [PubMed] [Google Scholar]
- Overduin S.; Perera A.; Patey G. Structural Behavior of Aqueous T-Butanol Solutions from Large-Scale Molecular Dynamics Simulations. J. Chem. Phys. 2019, 150, 184504 10.1063/1.5097011. [DOI] [PubMed] [Google Scholar]
- Klinov A.; Anashkin I. Diffusion in Binary Aqueous Solutions of Alcohols by Molecular Simulation. Processes 2019, 7, 947 10.3390/pr7120947. [DOI] [Google Scholar]
- Cerar J.; Jamnik A.; Pethes I.; Temleitner L.; Pusztai L.; Tomšič M. Structural, Rheological and Dynamic Aspects of Hydrogen-Bonding Molecular Liquids: Aqueous Solutions of Hydrotropic Tert-Butyl Alcohol. J. Colloid Interface Sci. 2020, 560, 730–742. 10.1016/j.jcis.2019.10.094. [DOI] [PubMed] [Google Scholar]
- Bandyopadhyay D.; Kamble Y.; Choudhury N. How Different Are the Characteristics of Aqueous Solutions of Tert-Butyl Alcohol and Trimethylamine-n-Oxide? A Molecular Dynamics Simulation Study. J. Phys. Chem. B 2018, 122, 8220–8232. 10.1021/acs.jpcb.8b02411. [DOI] [PubMed] [Google Scholar]
- Banerjee S.; Ghosh R.; Bagchi B. Structural Transformations, Composition Anomalies and a Dramatic Collapse of Linear Polymer Chains in Dilute Ethanol–Water Mixtures. J. Phys. Chem. B 2012, 116, 3713–3722. 10.1021/jp2085439. [DOI] [PubMed] [Google Scholar]
- Abdel Hamid A. R.; Mhanna R.; Lefort R.; Ghoufi A.; Alba-Simionesco C.; Frick B.; Morineau D. Microphase Separation of Binary Liquids Confined in Cylindrical Pores. J. Phys. Chem. C 2016, 120, 9245–9252. 10.1021/acs.jpcc.6b01446. [DOI] [Google Scholar]
- Požar M.; Lovrinčević B.; Zoranić L.; Primorać T.; Sokolić F.; Perera A. Micro-Heterogeneity versus Clustering in Binary Mixtures of Ethanol with Water or Alkanes. Phys. Chem. Chem. Phys. 2016, 18, 23971–23979. 10.1039/C6CP04676B. [DOI] [PubMed] [Google Scholar]
- Perera A. From Solutions to Molecular Emulsions. Pure Appl. Chem. 2016, 88, 189–206. 10.1515/pac-2015-1201. [DOI] [Google Scholar]
- Perera A.; Sokolić F.; Zoranić L. Microstructure of Neat Alcohols. Phys. Rev. E 2007, 75, 060502 10.1103/PhysRevE.75.060502. [DOI] [PubMed] [Google Scholar]
- Pothoczki S.; Pethes I.; Pusztai L.; Temleitner L.; Ohara K.; Bakó I. Properties of Hydrogen-Bonded Networks in Ethanol–Water Liquid Mixtures as a Function of Temperature: Diffraction Experiments and Computer Simulations. J. Phys. Chem. B 2021, 125, 6272–6279. 10.1021/acs.jpcb.1c03122. [DOI] [PMC free article] [PubMed] [Google Scholar]
- Laurent H.; Baker D. L.; Soper A. K.; Ries M. E.; Dougan L. Solute Specific Perturbations to Water Structure and Dynamics in Tertiary Aqueous Solution. J. Phys. Chem. B 2020, 124, 10983–10993. 10.1021/acs.jpcb.0c07780. [DOI] [PubMed] [Google Scholar]
- Zhang S.; Andrews B.; Schweitzer-Stenner R.; Urbanc B. Intrinsic Conformational Dynamics of Alanine in Water/Ethanol Mixtures: An Experiment-Driven Molecular Dynamics Study. J. Phys. Chem. B 2020, 124, 11600–11616. 10.1021/acs.jpcb.0c08245. [DOI] [PubMed] [Google Scholar]
- Ghoufi A. Molecular Origin of the Prepeak in the Structure Factor of Alcohols. J. Phys. Chem. B 2020, 124, 11501–11509. 10.1021/acs.jpcb.0c09302. [DOI] [PubMed] [Google Scholar]
- Franks F.; Desnoyers J.. Alcohol-Water Mixtures Revisited. In Water Science Reviews; Cambridge University Press, 1985; pp 171–232. [Google Scholar]
- Pradhan T.; Ghoshal P.; Biswas R. Structural Transition in Alcohol-Water Binary Mixtures: A Spectroscopic Study. J. Chem. Sci. 2008, 120, 275–287. 10.1007/s12039-008-0033-0. [DOI] [Google Scholar]
- Indra S.; Biswas R. Heterogeneity in (2-Butoxyethanol+ Water) Mixtures: Hydrophobicity-Induced Aggregation or Criticality-Driven Concentration Fluctuations?. J. Chem. Phys. 2015, 142, 204501 10.1063/1.4921651. [DOI] [PubMed] [Google Scholar]
- Gazi H. A. R.; Biswas R. Heterogeneity in Binary Mixtures of (Water+ Tertiary Butanol): Temperature Dependence across Mixture Composition. J. Phys. Chem. A 2011, 115, 2447–2455. 10.1021/jp109772h. [DOI] [PubMed] [Google Scholar]
- Pradhan T.; Gazi H. A. R.; Biswas R. Excited State Intramolecular Charge Transfer Reaction in Nonaqueous Electrolyte Solutions: Temperature Dependence. J. Chem. Phys. 2009, 131, 054507 10.1063/1.3196239. [DOI] [PubMed] [Google Scholar]
- Pradhan T.; Ghoshal P.; Biswas R. Excited State Intramolecular Charge Transfer Reaction in Binary Mixtures of Water and Tertiary Butanol (TBA): Alcohol Mole Fraction Dependence. J. Phys. Chem. A 2008, 112, 915–924. 10.1021/jp0770460. [DOI] [PubMed] [Google Scholar]
- Indra S.; Guchhait B.; Biswas R. Structural Anomaly and Dynamic Heterogeneity in Cycloether/Water Binary Mixtures: Signatures from Composition Dependent Dynamic Fluorescence Measurements and Computer Simulations. J. Chem. Phys. 2016, 144, 124506 10.1063/1.4943967. [DOI] [PubMed] [Google Scholar]
- Indra S.; Biswas R. Are N-Methyl Groups of Tetramethylurea (TMU) Hydrophobic? A Composition and Temperature-Dependent Fluorescence Spectroscopic Investigation of TMU/Water Binary Mixtures. J. Chem. Sci. 2016, 128, 753–761. 10.1007/s12039-016-1072-6. [DOI] [Google Scholar]
- Visser C. de.; Perron G.; Desnoyers J. E. The Heat Capacities, Volumes, and Expansibilities of Tert-Butyl Alcohol–Water Mixtures from 6 to 65 C. Can. J. Chem. 1977, 55, 856–862. 10.1139/v77-119. [DOI] [Google Scholar]
- Iwasaki K.; Fujiyama T. Light-Scattering Study of Clathrate Hydrate Formation in Binary Mixtures of Tert-Butyl Alcohol and Water. 2. Temperature Effect. J. Phys. Chem. B 1979, 83, 463–468. 10.1021/j100467a008. [DOI] [Google Scholar]
- Bender T. M.; Pecora R. A Dynamic Light Scattering Study of the Tert-Butyl Alcohol-Water System. J. Phys. Chem. C 1986, 90, 1700–1706. 10.1021/j100399a048. [DOI] [Google Scholar]
- Euliss G.; Sorensen C. Dynamic Light Scattering Studies of Concentration Fluctuations in Aqueous T-butyl Alcohol Solutions. J. Chem. Phys. 1984, 80, 4767–4773. 10.1063/1.446549. [DOI] [Google Scholar]
- Roux G.; Roberts D.; Perron G.; Desnoyers J. E. Microheterogeneity in Aqueous-Organic Solutions: Heat Capacities, Volumes and Expansibilities of Some Alcohols, Aminoalcohol and Tertiary Amines in Water. J. Solution Chem. 1980, 9, 629–647. 10.1007/BF00645894. [DOI] [Google Scholar]
- Brai M.; Kaatze U. Ultrasonic and Hypersonic Relaxations of Monohydric Alcohol/Water Mixtures. J. Phys. Chem. D 1992, 96, 8946–8955. 10.1021/j100201a046. [DOI] [Google Scholar]
- D’Arrigo G.; Teixeira J. Small-Angle Neutron Scattering Study of D 2 O–Alcohol Solutions. J. Chem. Soc., Faraday Trans. 1990, 86, 1503–1509. 10.1039/FT9908601503. [DOI] [Google Scholar]
- Finney J. L.; Bowron D.; Daniel R. M.; Timmins P.; Roberts M. A. Molecular and Mesoscale Structures in Hydrophobically Driven Aqueous Solutions. Biophys. Chem. 2003, 105, 391–409. 10.1016/S0301-4622(03)00104-2. [DOI] [PubMed] [Google Scholar]
- Banik D.; Bhattacharya S.; Datta P. K.; Sarkar N. Anomalous Dynamics in Tert-Butyl Alcohol–Water and Trimethylamine N-Oxide–Water Binary Mixtures: A Femtosecond Transient Absorption Study. ACS Omega 2018, 3, 383–392. 10.1021/acsomega.7b01595. [DOI] [PMC free article] [PubMed] [Google Scholar]
- Chakraborty S.; Sehanobish E.; Sarkar M. A Traditional Painkiller as a Probe for Microheterogeneity in 1-Propanol–Water Mixtures. Chem. Phys. Lett. 2010, 501, 118–122. 10.1016/j.cplett.2010.10.050. [DOI] [Google Scholar]
- Okpala C.; Guiseppi-Elie A.; Maharajh D. M. Several Properties of 1, 1, 3, 3-Tetramethylurea-Water Systems. J. Chem. Eng. Data 1980, 25, 384–386. 10.1021/je60087a007. [DOI] [Google Scholar]
- Kipkemboi P. K.; Easteal A. J. Densities and Viscosities of Binary Aqueous Mixtures of Nonelectrolytes: Tert-Butyl Alcohol and Tert-Butylamine. Can. J. Chem. 1994, 72, 1937–1945. 10.1139/v94-247. [DOI] [Google Scholar]
- Khattab I. S.; Bandarkar F.; Fakhree M. A. A.; Jouyban A. Density, Viscosity, and Surface Tension of Water+ Ethanol Mixtures from 293 to 323K. Korean J. Chem. Eng. 2012, 29, 812–817. 10.1007/s11814-011-0239-6. [DOI] [Google Scholar]
- Chiou D.-R.; Chen S.-Y.; Chen L.-J. Density, Viscosity, and Refractive Index for Water+ 2-Butoxyethanol And+ 2-(2-Butoxyethoxy) Ethanol at Various Temperatures. J. Chem. Eng. Data 2010, 55, 1012–1016. 10.1021/je900478c. [DOI] [Google Scholar]
- Furukawa K.; Shibuta S.; Judai K. Viscosity Study of Tert-Butyl Alcohol Aqueous Solution by Brownian Motion and Gravimetric Capillaries. J. Mol. Liq. 2020, 319, 114170 10.1016/j.molliq.2020.114170. [DOI] [Google Scholar]
- Chowdhuri S.; Chandra A. Tracer Diffusion of Ionic and Hydrophobic Solutes in Water–Dimethyl Sulfoxide Mixtures: Effects of Varying Composition. J. Chem. Phys. 2003, 119, 4360–4366. 10.1063/1.1588997. [DOI] [Google Scholar]
- Chowdhuri S.; Chandra A. Dynamics of Ionic and Hydrophobic Solutes in Water-Methanol Mixtures of Varying Composition. J. Chem. Phys. 2005, 123, 234501 10.1063/1.2137702. [DOI] [PubMed] [Google Scholar]
- Gupta R.; Chandra A. Nonideality in Diffusion of Ionic and Hydrophobic Solutes and Pair Dynamics in Water-Acetone Mixtures of Varying Composition. J. Chem. Phys. 2007, 127, 024503 10.1063/1.2751192. [DOI] [PubMed] [Google Scholar]
- Gupta R.; Chandra A. Single Particle and Pair Dynamics in Water–Formic Acid Mixtures Containing Ionic and Neutral Solutes: Nonideality in Dynamical Properties. J. Chem. Phys. 2008, 128, 184506 10.1063/1.2913058. [DOI] [PubMed] [Google Scholar]
- Hansen J. P.; McDonald I. R.. Theory of Simple Liquids, 2nd ed.; Elsevier, 1986. [Google Scholar]
- Paul S.; Patey G. Influence of Urea on Tert-Butyl Alcohol Aggregation in Aqueous Solutions. J. Phys. Chem. B 2012, 116, 4991–5001. 10.1021/jp300792p. [DOI] [PubMed] [Google Scholar]
- Wang J.; Boyd R. J.; Laaksonen A. A Hybrid Quantum Mechanical Force Field Molecular Dynamics Simulation of Liquid Methanol: Vibrational Frequency Shifts as a Probe of the Quantum Mechanical/Molecular Mechanical Coupling. J. Chem. Phys. 1996, 104, 7261–7269. 10.1063/1.471439. [DOI] [Google Scholar]
- Abascal J. L.; Vega C. A General Purpose Model for the Condensed Phases of Water: TIP4P/2005. J. Chem. Phys. 2005, 123, 234505 10.1063/1.2121687. [DOI] [PubMed] [Google Scholar]
- Duboué-Dijon E.; Laage D. Characterization of the Local Structure in Liquid Water by Various Order Parameters. J. Phys. Chem. B 2015, 119, 8406–8418. 10.1021/acs.jpcb.5b02936. [DOI] [PMC free article] [PubMed] [Google Scholar]
- Allen M. P.; Tildesley D. J.. Computer Simulation of Liquids; Oxford University Press, 2017. [Google Scholar]
- Nosé S. A Molecular Dynamics Method for Simulations in the Canonical Ensemble. Mol. Phys. 1984, 52, 255–268. 10.1080/00268978400101201. [DOI] [Google Scholar]
- Hoover W. G. Canonical Dynamics: Equilibrium Phase-Space Distributions. Phys. Rev. A 1985, 31, 1695 10.1103/PhysRevA.31.1695. [DOI] [PubMed] [Google Scholar]
- Hess D.; Lindahl E.. GROMACS User Manual Version 4.5.6; Department of Biophysical Chemistry, University of Groningen, 2001.
- Van Der Spoel D.; Lindahl E.; Hess B.; Groenhof G.; Mark A. E.; Berendsen H. J. GROMACS: Fast, Flexible, and Free. J. Comput. Chem. 2005, 26, 1701–1718. 10.1002/jcc.20291. [DOI] [PubMed] [Google Scholar]
- Lindahl E.; Hess B.; Van Der Spoel D. GROMACS 3.0: A Package for Molecular Simulation and Trajectory Analysis. Mol. Model. Annu. 2001, 7, 306–317. 10.1007/s008940100045. [DOI] [Google Scholar]
- Berendsen H. J.; van der Spoel D.; van Drunen R. GROMACS: A Message-Passing Parallel Molecular Dynamics Implementation. Comput. Phys. Commun. 1995, 91, 43–56. 10.1016/0010-4655(95)00042-E. [DOI] [Google Scholar]
- Bekker H.; Berendsen H.; Dijkstra E.; Achterop S.; Van Drunen R.; Van der Spoel D.; Sijbers A.; Keegstra H.; Reitsma B.; Renardus M.. GROMACS: A Parallel Computer for Molecular Dynamics Simulations; World Scientific: Singapore, 1993; Vol. 92, pp 252–256. [Google Scholar]
- Brehm M.; Kirchner B. TRAVIS-a Free Analyzer and Visualizer for Monte Carlo and Molecular Dynamics Trajectories. J. Cheminformatics 2012, 4, F1 10.1186/1758-2946-4-S1-F1. [DOI] [PubMed] [Google Scholar]
- Humphrey W.; Dalke A.; Schulten K. VMD: Visual Molecular Dynamics. J. Mol. Graphics 1996, 14, 33–38. 10.1016/0263-7855(96)00018-5. [DOI] [PubMed] [Google Scholar]
- Errington J. R.; Debenedetti P. G. Relationship between Structural Order and the Anomalies of Liquid Water. Nature 2001, 409, 318–321. 10.1038/35053024. [DOI] [PubMed] [Google Scholar]
- Luzar A. Water Hydrogen-Bond Dynamics Close to Hydrophobic and Hydrophilic Groups. Faraday Discuss. 1996, 103, 29–40. 10.1039/fd9960300029. [DOI] [Google Scholar]
- Luzar A.; Chandler D. Structure and Hydrogen Bond Dynamics of Water–Dimethyl Sulfoxide Mixtures by Computer Simulations. J. Chem. Phys. 1993, 98, 8160–8173. 10.1063/1.464521. [DOI] [Google Scholar]
- Ferrario M.; Haughney M.; McDonald I. R.; Klein M. L. Molecular-dynamics Simulation of Aqueous Mixtures: Methanol, Acetone, and Ammonia. J. Chem. Phys. 1990, 93, 5156–5166. 10.1063/1.458652. [DOI] [Google Scholar]
- Chandra A. Effects of Ion Atmosphere on Hydrogen-Bond Dynamics in Aqueous Electrolyte Solutions. Phys. Rev. Lett. 2000, 85, 768 10.1103/PhysRevLett.85.768. [DOI] [PubMed] [Google Scholar]
- Balasubramanian S.; Pal S.; Bagchi B. Hydrogen-Bond Dynamics near a Micellar Surface: Origin of the Universal Slow Relaxation at Complex Aqueous Interfaces. Phys. Rev. Lett. 2002, 89, 115505 10.1103/PhysRevLett.89.115505. [DOI] [PubMed] [Google Scholar]
- Lee M. E.; van der Vegt N. F. A New Force Field for Atomistic Simulations of Aqueous Tertiary Butanol Solutions. J. Chem. Phys. 2005, 122, 114509 10.1063/1.1862625. [DOI] [PubMed] [Google Scholar]
- Kiselev M.; Ivlev D.; Puhovski Y.; Kerdcharoen T. Preferential Solvation and Elasticity of the Hydrogen Bonds Network in Tertiary Butyl Alcohol–Water Mixture. Chem. Phys. Lett. 2003, 379, 581–587. 10.1016/j.cplett.2003.08.082. [DOI] [Google Scholar]
- Fornili A.; Civera M.; Sironi M.; Fornili S. L. Molecular Dynamics Simulation of Aqueous Solutions of Trimethylamine-N-Oxide and Tert-Butyl Alcohol. Phys. Chem. Chem. Phys. 2003, 5, 4905–4910. 10.1039/b308248b. [DOI] [Google Scholar]
- Kaur S.; Kashyap H. K. Three-Dimensional Morphology and X-Ray Scattering Structure of Aqueous Tert-Butanol Mixtures: A Molecular Dynamics Study. J. Chem. Sci. 2017, 129, 103–116. 10.1007/s12039-016-1207-9. [DOI] [Google Scholar]
- Bowron D.; Soper A.; Finney J. Temperature Dependence of the Structure of a 0.06 Mole Fraction Tertiary Butanol-Water Solution. J. Chem. Phys. 2001, 114, 6203–6219. 10.1063/1.1354167. [DOI] [Google Scholar]
- D’Arrigo G.; Teixeira J.; Giordano R.; Mallamace F. A Small-angle Neutron Scattering Study of 2-butoxyethanol/D2O Solutions. J. Chem. Phys. 1991, 95, 2732–2737. 10.1063/1.460925. [DOI] [Google Scholar]
- Baksi A.; Biswas R. Does Confinement Modify Preferential Solvation and H-Bond Fluctuation Dynamics? A Molecular Level Investigation through Simulations of a Bulk and Confined Three-Component Mixture. J. Phys. Chem. B 2020, 124, 11718–11729. 10.1021/acs.jpcb.0c09079. [DOI] [PubMed] [Google Scholar]
- Baksi A.; Ghorai P. Kr.; Biswas R. Dynamic Susceptibility and Structural Heterogeneity of Large Reverse Micellar Water: An Examination of the Core–Shell Model via Probing the Layer-Wise Features. J. Phys. Chem. B 2020, 124, 2848–2863. 10.1021/acs.jpcb.9b11895. [DOI] [PubMed] [Google Scholar]
- Svishchev I.; Kusalik P. Structure in Liquid Water: A Study of Spatial Distribution Functions. J. Chem. Phys. 1993, 99, 3049–3058. 10.1063/1.465158. [DOI] [Google Scholar]
- Kusalik P. G.; Svishchev I. M. The Spatial Structure in Liquid Water. Science 1994, 265, 1219–1221. 10.1126/science.265.5176.1219. [DOI] [PubMed] [Google Scholar]
- Chandra A. Effects of Ion Atmosphere on Hydrogen-Bond Dynamics in Aqueous Electrolyte Solutions. Phys. Rev. Lett. 2000, 85, 768 10.1103/PhysRevLett.85.768. [DOI] [PubMed] [Google Scholar]
- Starr F. W.; Nielsen J. K.; Stanley H. E. Fast and Slow Dynamics of Hydrogen Bonds in Liquid Water. Phys. Rev. Lett. 1999, 82, 2294 10.1103/PhysRevLett.82.2294. [DOI] [Google Scholar]
- Balasubramanian S.; Pal S.; Bagchi B. Hydrogen-Bond Dynamics near a Micellar Surface: Origin of the Universal Slow Relaxation at Complex Aqueous Interfaces. Phys. Rev. Lett. 2002, 89, 115505 10.1103/PhysRevLett.89.115505. [DOI] [PubMed] [Google Scholar]
- Conde O.; Teixeira J. Depolarized Light Scattering of Heavy Water, and Hydrogen Bond Dynamics. Mol. Phys. 1984, 53, 951–959. 10.1080/00268978400102761. [DOI] [Google Scholar]
- Conde O.; Teixeira J. Hydrogen Bond Dynamics in Water Studied by Depolarized Rayleigh Scattering. J. Phys. 1983, 44, 525–529. 10.1051/jphys:01983004404052500. [DOI] [Google Scholar]
- Montrose C.; Bucaro J.; Marshall-Coakley J.; Litovitz T. Depolarized Rayleigh Scattering and Hydrogen Bonding in Liquid Water. J. Chem. Phys. 1974, 60, 5025–5029. 10.1063/1.1681017. [DOI] [Google Scholar]
- Woutersen S.; Emmerichs U.; Bakker H. Femtosecond Mid-IR Pump-Probe Spectroscopy of Liquid Water: Evidence for a Two-Component Structure. Science 1997, 278, 658–660. 10.1126/science.278.5338.658. [DOI] [Google Scholar]
- Baksi A.; Rajbangshi J.; Biswas R. Water in Biodegradable Glucose–Water–Urea Deep Eutectic Solvent: Modifications of Structure and Dynamics in a Crowded Environment. Phys. Chem. Chem. Phys. 2021, 23, 12191–12203. 10.1039/D1CP00734C. [DOI] [PubMed] [Google Scholar]
- Das S.; Biswas R.; Mukherjee B. Orientational Jumps in (Acetamide+ Electrolyte) Deep Eutectics: Anion Dependence. J. Phys. Chem. B 2015, 119, 11157–11168. 10.1021/acs.jpcb.5b03022. [DOI] [PubMed] [Google Scholar]
- Das S.; Biswas R.; Mukherjee B. Reorientational Jump Dynamics and Its Connections to Hydrogen Bond Relaxation in Molten Acetamide: An All-Atom Molecular Dynamics Simulation Study. J. Phys. Chem. B 2015, 119, 274–283. 10.1021/jp509869d. [DOI] [PubMed] [Google Scholar]
Associated Data
This section collects any data citations, data availability statements, or supplementary materials included in this article.