Abstract
Aicardi-Goutières syndrome (AGS) is a monogenic type-I interferonopathy that results in neurologic injury. The systemic impact of sustained interferon activation is less well characterized. Liver inflammation is known to be associated with the neonatal form of AGS, but the incidence of AGS-related hepatitis across lifespan is unknown.
We compared natural history data including liver enzyme levels with markers of inflammation, (liver-specific autoantibodies and interferon signaling gene expression [ISG] scores). Liver enzymes were classified as normal or elevated by the fold increase over the upper limit of normal (ULN). The highest increases were designated as hepatitis, defined as aspartate-aminotransferase or alanine-aminotransferase threefold ULN, or gamma-glutamyl transferase 2.5-fold ULN. A larger cohort was used to further characterize the longitudinal incidence of liver abnormalities and the association with age and genotype.
Across the AGS cohort (n = 102), elevated liver enzymes were identified in 76 individuals (74.5%) with abnormalities at a level consistent with hepatitis in 29 individuals (28.4%). SAMHD1 mutations were less likely to be associated with hepatitis (log-rank test; p = 0.011). Hepatitis was associated with early-onset disease and microcephaly (log-rank test; microcephaly p = 0.0401, age onset p = 0.0355). While most subjects (n = 20/33) were found to have liver-specific autoantibodies, there was no association between the presence of autoantibodies or ISG scores with hepatitis-level enzyme elevations.
In conclusion, all genotypes of AGS are associated with transient elevations of liver enzymes and the presence of liver-associated autoantibodies. This adds to our growing understanding of the systemic pathology AGS.
Keywords: Aicardi-Goutières syndrome, liver, ISGsm
Introduction
Aicardi-Goutières syndrome (AGS) is a rare genetic disorder characterized by dysregulation of the nucleic acid metabolism and sensing pathways. This results in a chronic activation of type I interferons (IFN)1 and leads to extensive multisystem organ injury.2–7 Children with AGS have systemic autoinflammation mediated by IFN and, in some cases, by autoantibodies.8
While the impact of AGS on the brain is well characterized, the impact on systemic organs is less well understood. The neonatal form of AGS is associated with an inflammatory hepatitis,8,9 but there is limited information about the pathogenesis or incidence of liver abnormalities across the lifespan. Other pediatric liver diseases are associated with the presence of autoantibodies, such as antinuclear antibodies (ANA), antineutrophil cytoplasmic antibodies (ANCA), and antismooth muscle antibody (ASMA).10 While liver-specific autoantibodies can be causative of disease (such as in autoimmune hepatitis), they may develop as a secondary phenomenon resulting from exposure of hepatocyte antigens (as occurs in hepatitis C infection and Wilson disease).11–13 The role of antibodies in AGS-related hepatitis is unknown.
Given the association between AGS and liver disease, particularly in the neonatal period, we sought to characterize the natural history of liver involvement in AGS across the lifespan and its relationship to biomarkers of inflammation.
Methods
Natural History Cohorts
An international cohort of individuals was recruited through the Institutional Review Board-approved Myelin Disorders Bioregistry Project at the Children’s Hospital of Philadelphia. This study began with the pretreatment data from a cohort of children (n = 48) enrolled in our therapeutic studies (NCT01724580 and NCT03921554), where a higher than expected incidence of liver enzyme elevation was noted.14 From this cohort, detailed pretreatment medical histories (n = 48) and banked serum samples (n = 33) were available. Next, we evaluated liver enzyme abnormalities within our expanded cohort (n = 102, inclusive of the detailed cohort above). From this expanded cohort, laboratory values and limited medical histories (e.g., clinical presentation and genotype) were collected. The additional subjects included in the larger cohort were comparable to the detailed cohort by key parameters of age at last evaluation (Wilcoxon rank sum test, p = 0.606), genotype (Pearson chi-squared test, p = 0.241), and presence of microcephaly (Pearson chi-squared test, p = 0.168). Age of onset was different between the two groups (Wilcoxon rank sum test, p = 0.039). With removal of an outlier with disease onset over 200 months, this association no longer reached significance (Wilcoxon rank sum test with removal of outlier, p = 0.059). Clinical manifestations of liver-disease were described for two individuals across the expanded cohort in the overall cohort. A summary of the cohort demographic is included in ►Table 1.
Table 1.
Demographics
| Variable | Pretreatment detailed cohort (n = 48) | Expanded cohorta (n = 102) | p-Valueb | |
|---|---|---|---|---|
| n (%) | n (%) | |||
| Sex | Male | 27 (56.25) | 58 (56.86) | 0.906 |
| Female | 21 (43.75) | 44 (43.14) | ||
| Genotype | TREX1 | 6 (12.5) | 18 (17.65) | 0.241 |
| RNASEH2B | 13 (27.08) | 29 (28.43) | ||
| RNASEH2A | 1 (2.08) | 6 (5.88) | ||
| RNASEH2C | 1 (2.08) | 2 (1.96) | ||
| SAMHD1 | 9 (18.75) | 19 (18.63) | ||
| ADAR1 | 9 (18.75) | 16 (15.5) | ||
| IFIH1 | 9 (18.75) | 12 (11.76) | ||
| HC | Microcephaly | 22 (45.83) | 53 (53%) | 0.168 |
| Normocephaly | 26 (54.17) | 47 (47%) | ||
| Age of onset (months) | Mean | 11.34 (SD: 29.41) | 8.78 (SD: 23.52) | 0.039 |
| Median | 4 (range: 0–204) | 3.5 (range: 0–204) | ||
| Age at last evaluation (months) | Mean | 74.10 (SD: 74.72) | 73.5 (SD: 74.07) | 0.606 |
| Median | 37.0 (range: 2.0–266) | 45 (range: 2–266) | ||
Abbreviations: HC, HC: head circumference; SD, standard deviation.
Inclusive of the detailed cohort.
p-Values were obtained using the chi-squared test for categorical variables and the Wilcoxon rank sum test for age of onset and age of evaluation.
Clinical Laboratory Values
Results of aspartate-aminotransferase (AST), alanine-aminotransferase (ALT), and gamma-glutamyl transferase (GGT) testing were collected as available from the medical records. Laboratory analyses stated as normal but for which an exact value was not available were scored as normal (0.5-fold increase over normal). Liver enzyme fold increase was calculated based on the upper limit of normal values included in the medical report for each test. AST and ALT fold increase of three times and GGT fold increase of 2.5 times from upper limit of normal were considered meaningful representation of abnormal liver enzyme levels consistent with hepatitis.15 To minimize the over-representation of repeat laboratory measures in individual patients, the value of greatest elevation was used for visualization if measures were repeated within 1 month, unless individuals were greater than 100 months, in which case the highest value within a 10-month period was used.
Research Laboratory Values
Banked serum samples were available from 33 individuals in the detailed cohort. These samples were used to measure liver autoantibody levels, which included ANA, ANCA, ASMA, and antiliver/kidney microsome 1 in the clinical immunology laboratory. A positive value for the autoantibody panel was determined by the presence of one or more elevated autoantibody levels.
Simultaneous liver enzyme testing and IFN signaling gene (ISG) expression scores were available for 52 individuals in the expanded cohort, inclusive of 46 individuals within the detailed cohort. To calculate the ISG expression score, extracted RNA (Qiagen PAXgene Blood RNA kit) was quantified using the Nanostring nCounter Digital as previously described.16,17 The copy number of mRNA transcripts were measured from type I IFN-inducible genes (IFI27, IFI44L, IFIT1, ISG15, RSAD2, and SIGLEC1) as compared to housekeeping genes (ALAS1, HPRT1, TBP, and TUBB). An ISG score of ≥1.96 (>98th percentile) was considered positive.18
Statistical Analysis
Demographic, clinical, and genetic features were described with descriptive statistics. Analyses were performed using Stata 16.0 statistical software and GraphPad Prism 8. Statistical significance was set at a two-sided p-value of less than 0.05. Bland–Altman analysis was used to evaluate the agreement between age at first available measurement and age at presentation. This found that as age at onset increased, so did the difference between age at onset and the first laboratory measurement. Thus, it was determined that age at first measurement of liver enzymes could not be used to determine age at onset of hepatitis. In all cases, elevations of ALT, AST, and GGT were considered both for any abnormal values (e.g., fold change >1) as well as for fold changes that were consistent with hepatitis.15
Kaplan–Meier curves were constructed to visualize the acquisition of liver enzyme elevation within groups. The log-rank test was used to compare the survival distributions between the subgroups defined according to microcephaly, disease onset, and genotype (SAMHD1 versus other genotypes combined). We also performed tests for the assumption of proportional hazards based on the Schoenfeld residuals.
Comparisons between liver enzyme abnormalities and ISGs and between liver enzyme abnormalities and age at sample were assessed by fitting longitudinal models. These longitudinal models were fitted using quasi-least squares (QLS) regression and QLS logistic regression. QLS is a computational approach for estimation of intrasubject correlations in the framework of generalized estimating equations.19,20 Comparison between ISGs and liver autoantibody abnormalities was performed by Mann–Whitney (Wilcoxon rank sum tests) U test as only single values were available. Comparisons between liver autoantibody abnormalities and AST, ALT, and GGT abnormalities were performed by chi-squared test. Comparisons between subcohorts were performed by Wilcoxon rank sum and chi-squared tests.
Results
This study began with the pretreatment data from a cohort of children (n = 48) enrolled in our therapeutic studies, where a higher than expected incidence of liver enzyme elevation was noted at baseline. We collected all available pretreatment laboratory values from this cohort. We found 64 transient episodes of liver enzyme elevation throughout the lifespan. Most of these episodes were independent of events typically associated with hepatitis. Infections or fevers were noted in six episodes (9.4%); six episodes were noted during antiepileptic drug exposure associated with liver enzyme elevation (valproic acid and phenobarbital). One of these six events was associated with simultaneous infection and antiepileptic drug exposure. None of these events were concomitant with infections such as Epstein–Barr virus, cytomegalovirus, or viral hepatitis. All individuals had documentation of serologies consistent with hepatitis B vaccination and lack of seroconversion for hepatitis C (n = 48).
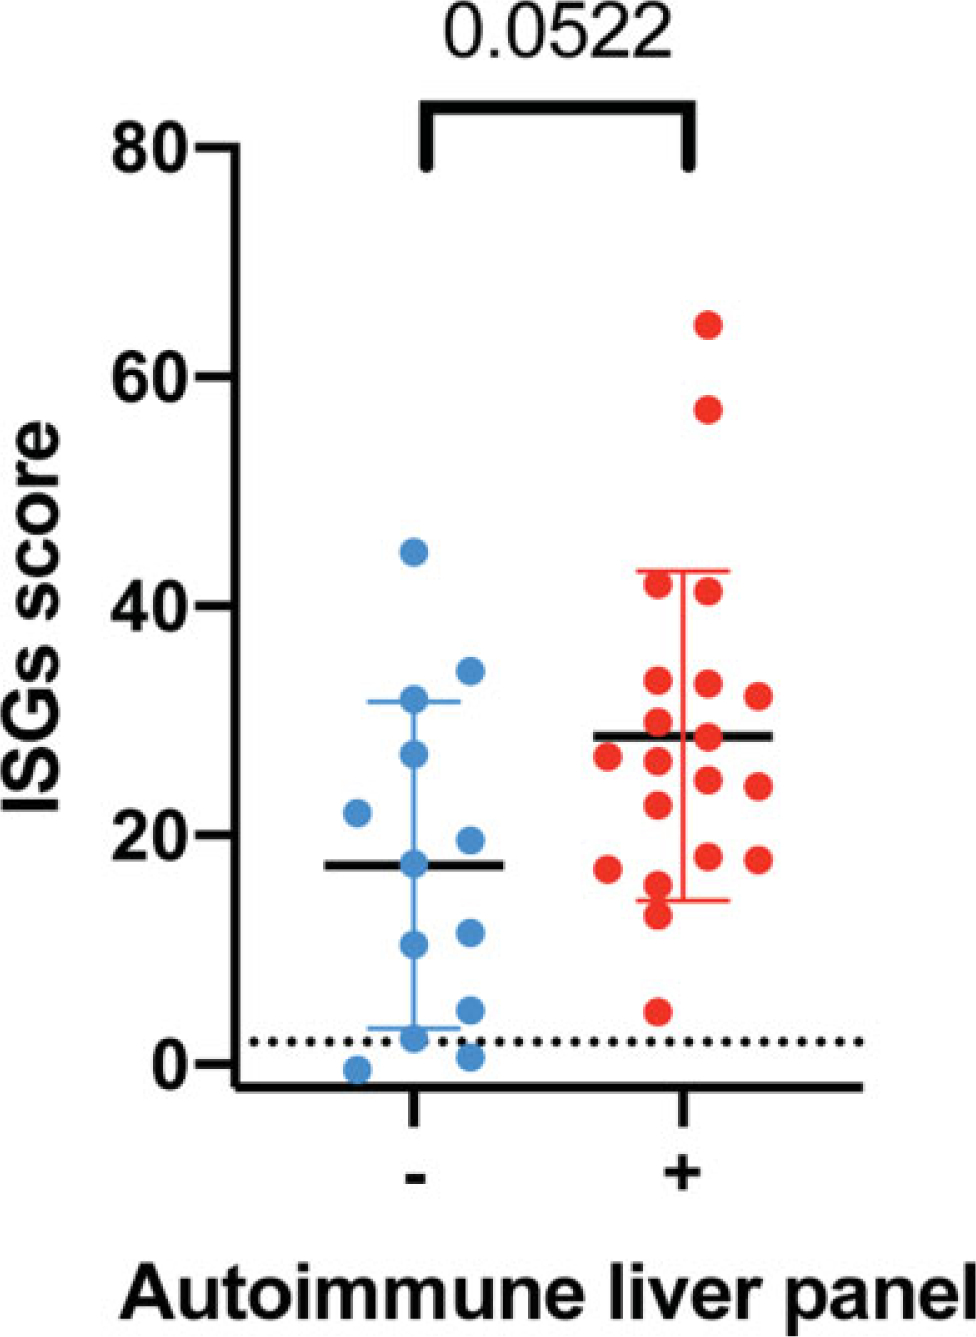
As AGS has been associated with autoantibody production targeting other organs, liver-specific autoantibodies were measured in banked samples with paired liver enzymes and ISG scores (n = 33) (►Fig. 1). Within this cohort, 20 individuals were found to have liver autoantibodies (60.61%), which did not correlate with the degree of elevation in ISG scores (p = 0.0522, Mann–Whitney U test). None of the individuals with liver-specific antibodies had clinical reports of jaundice, right upper quadrant pain, vomiting, or laboratory evidence of synthetic liver dysfunction. There was no clinically meaningful correlation between liver autoantibodies and AST, ALT, or GGT fold increases within the range of hepatitis (chi-squared test, AST, p = 0.401, ALT, p = 0.227, GGT = 0.794) or when any increase in liver enzymes was considered (chi-squared test, AST, p = 0.837, ALT, p = 0.946, GGT = 0.547).
Fig. 1.

Interferon signaling gene expression (ISG) scores in paired samples for autoimmune liver panel results (p = 0.0522, Mann–Whitney U test).
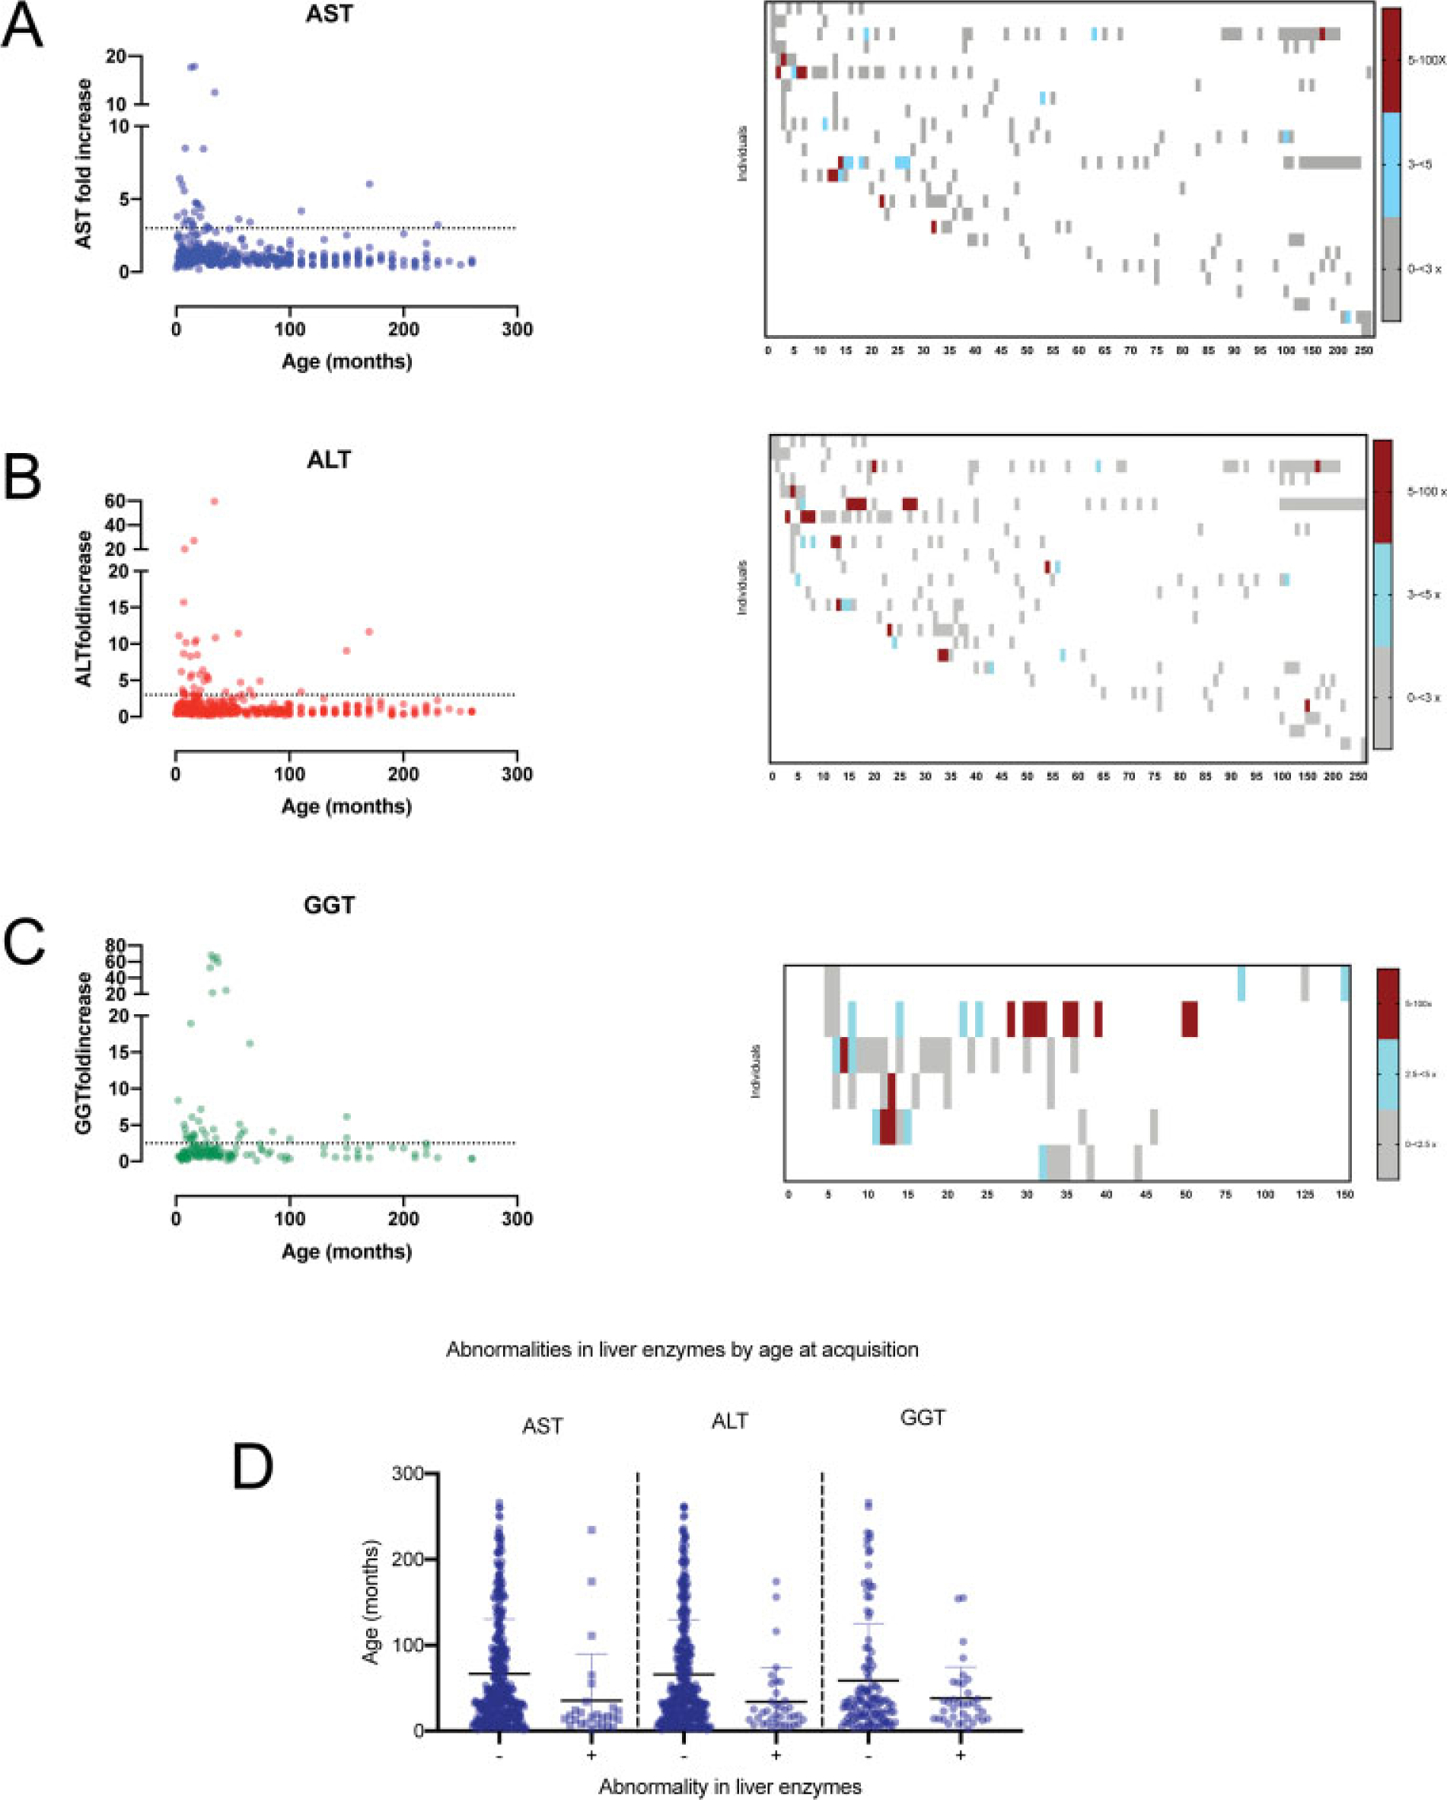
Next, we assessed a second cohort to include all individuals in our natural history cohort with historical liver enzymes measurements. We combined this cohort with our detailed cohort to assess a combined cohort. Most subjects experienced an episodes of liver enzyme elevation (74.5%; n = 76/102), with 29 individuals (28%) meeting the definition of hepatitis (n = 29/102) (►Fig. 2A–C). There was no association between the fold change in liver enzyme elevation (AST, ALT, or GGT) and age at sample measurement (QLS logistic regression, AST, p = 0.1603, ALT, p = 0.3375, GGT = 0.2808) (►Fig. 2D).
Fig. 2.

Serial measurements of liver enzymes (AST, ALT, and GGT) in the AGS cohort. In the left panels for A–C, the fold increase of each liver enzyme for each individual within a time period was compared to age at measurement for AST (A), ALT (B), and GGT (C). The maximal fold increase is shown for each month up to 100 months, and then 10 month increments afterward. In the right panels for A–C, heatmaps represent the sequential laboratory measurements for all individuals with 5 or more measurements (AST, n = 27, ALT, n = 27, GGT, n = 6). (D) The age at laboratory acquisition was compared between liver enzyme normal and abnormal values meeting criteria of hepatitis (QLS logistic regression, AST, p = 0.1603, ALT, p = 0.3375, GGT = 0.2808). ALT, alanine-aminotransferase; AST, aspartate-aminotransferase; GGT, gamma-glutamyl transferase; QLS, quasi-least squares.
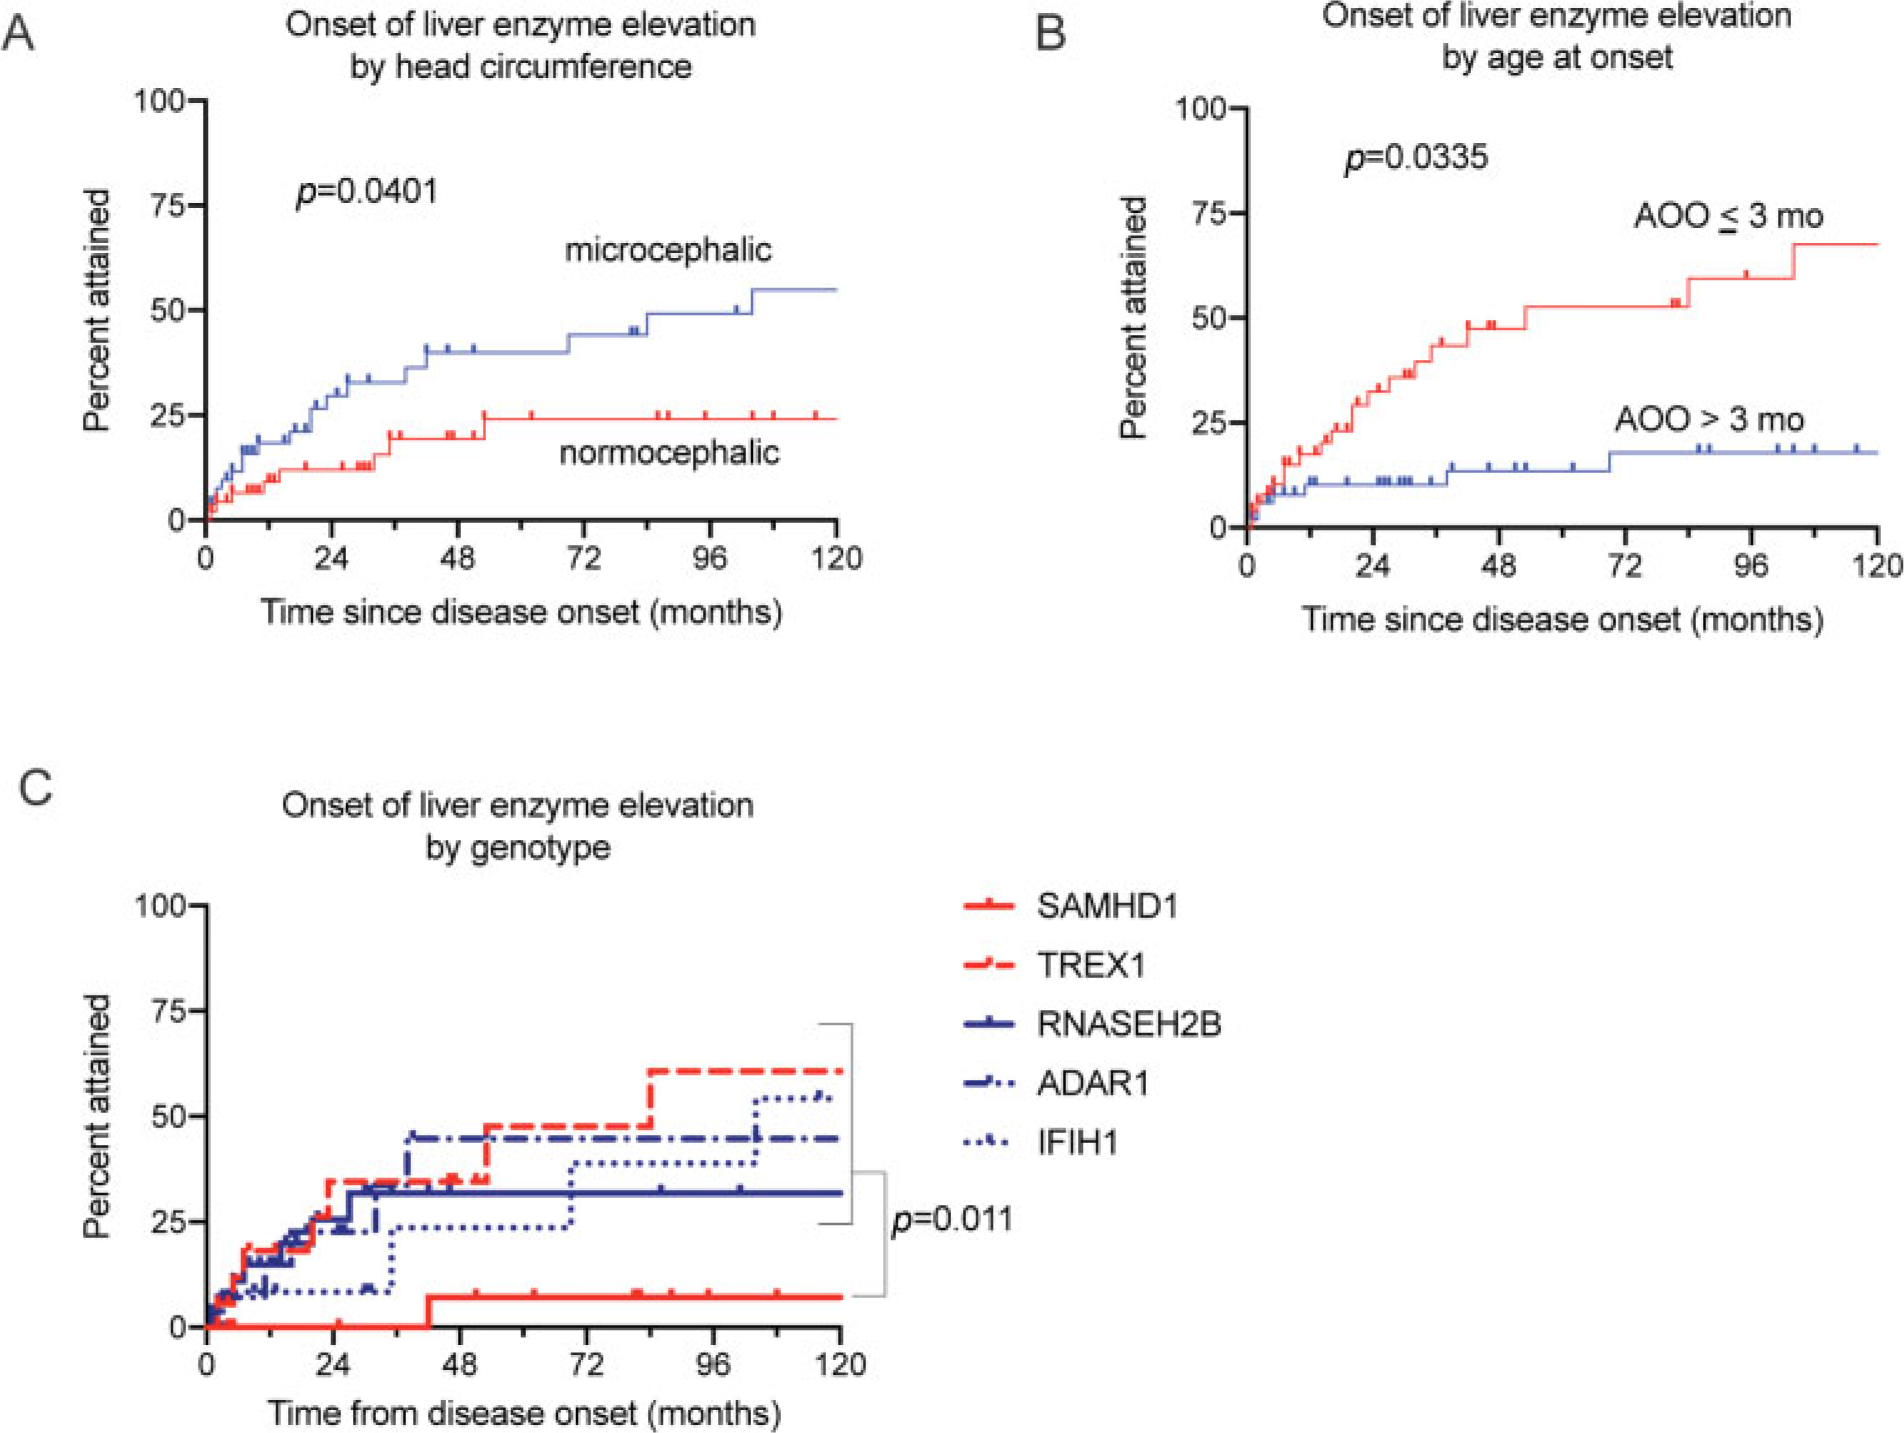
Because of the known association between hepatitis and neonatal disease in AGS, we hypothesized that variables associated with the neonatal presentation of AGS would be associated with an earlier onset of hepatitis. We found that microcephaly and early age at onset (within the first 3 months of life) were associated with earlier abnormal liver enzymes levels within the range of hepatitis (microcephaly: log-rank [Mantel-Cox] test, p = 0.0401, age onset p = 0.0335, ►Fig. 3A–B). Children with SAMHD1-related AGS had a lower acquisition of liver enzyme elevation within the range of hepatitis (log-rank test, p = 0.011) compared to other genotypes (►Fig. 3C). Only early age of onset (within the first 3 months of life) was associated with abnormal liver enzyme levels when a simple fold change >1 was considered (log-rank test, p < 0.001).
Fig. 3.

Acquisition of liver enzyme elevation in the AGS population. Acquisition of liver enzyme elevation was associated with microcephaly (A; log-rank test, p = 0.0401), disease onset within 3 months of life (B; log-rank test, p = 0.0335), and non-SAMHD1 genotype (C; log-rank test, p = 0.011). ALT, alanine-aminotransferase; AST, aspartate-aminotransferase; GGT, gamma-glutamyl transferase.
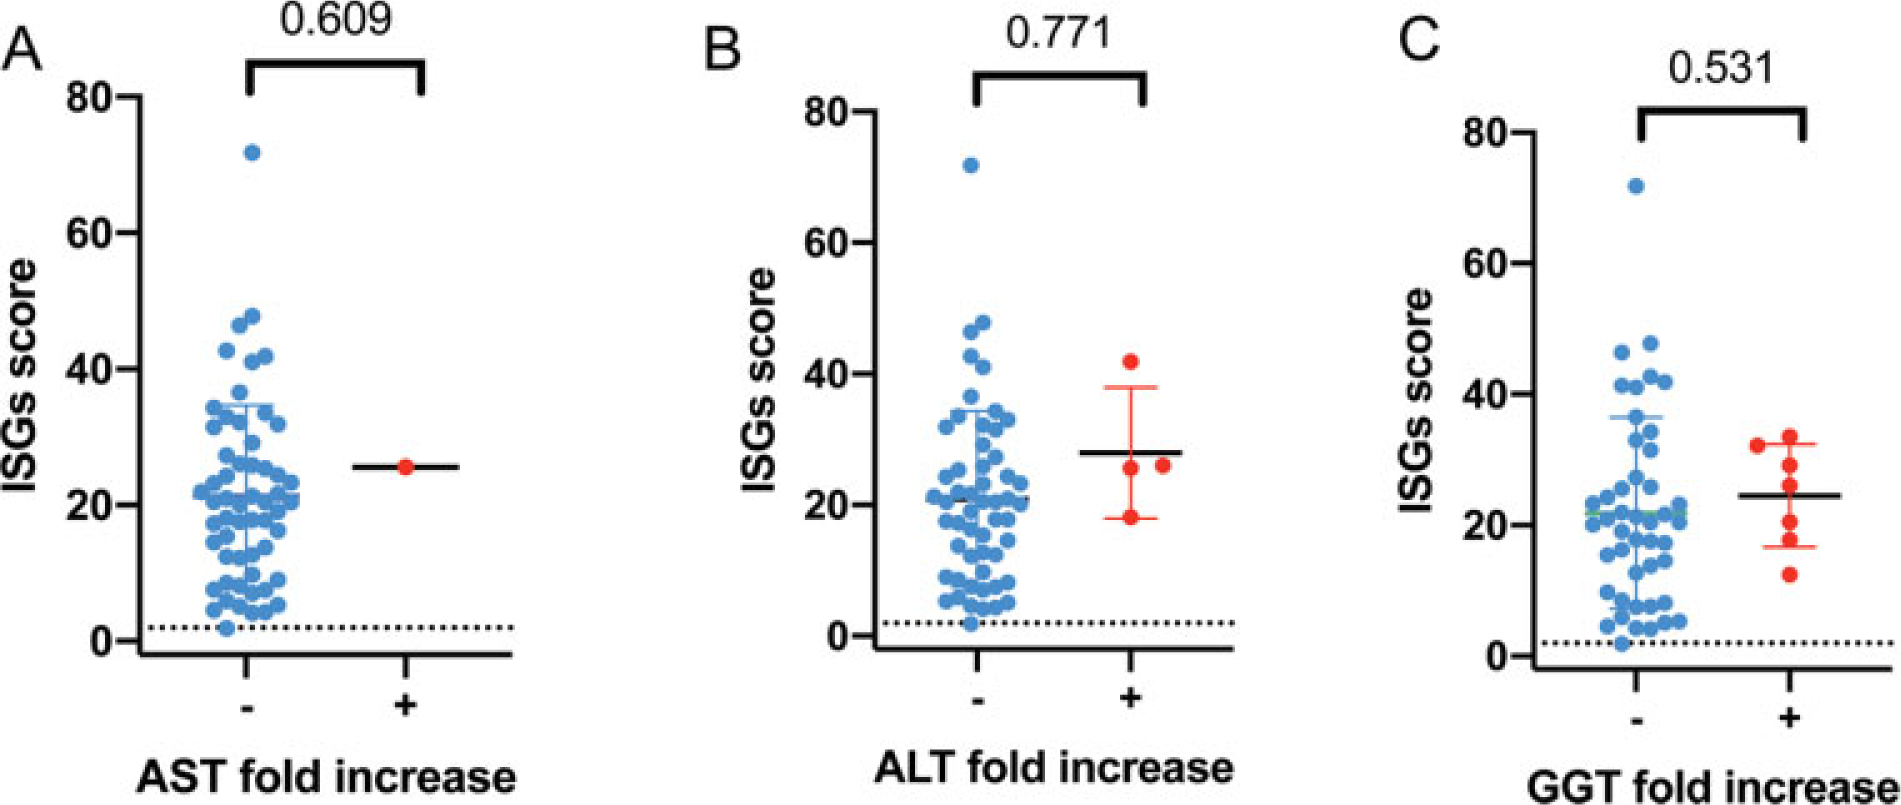
From the expanded cohort, simultaneously obtained liver enzyme measurements and ISG scores were available from 52 individuals (n of paired values = 71) (►Fig. 3). There was no correlation between ISG score and liver enzyme elevations (►Fig. 4 A–C).
Fig. 4.

Interferon signaling gene expression (ISG) scores in paired samples for AST fold increase (A), ALT fold increase (B), and GGT fold increase (C). The QLS model p-values are provided for the correlations A, B, and C. ALT, alanine-aminotransferase; AST, aspartate-aminotransferase; GGT, gamma-glutamyl transferase; QLS, quasi-least squares.
Discussion
AGS is a genetic interferonopathy of childhood with extensive multisystemic organ involvement. Despite our growing understanding of AGS, the extent of hepatic involvement in AGS is currently unknown. Liver involvement is known to be associated with the early onset form of AGS (neonatal presentation) and with TREX1-related disease,8,9 but the broader penetration of liver involvement in AGS affected individuals remains unknown.
We found that approximately sixty percent to three quarters of individuals with AGS experience elevated liver enzymes. More than one quarter have liver enzyme elevations consistent with hepatitis during their lifetime. As our data is limited by the availability of laboratory measurements, we hypothesize that this is likely an underestimation of the incidence of hepatitis in the AGS population. A younger age at disease onset and the presence of microcephaly correlated with the early presence of hepatitis, which is consistent with the existing literature. All genotypes were susceptible to liver enzyme elevation, although this was the least pronounced in the SAMHD1 population. We found that enzyme abnormalities may be observed years after disease onset and were not limited to the neonatal period, as previously reported.
While a significant proportion of the population had a transient elevation in liver enzymes, the clinical impact and prognostic significance of this information is uncertain. Within our cohort, there were only rare cases with liver imaging or findings of synthetic liver dysfunction. Only two individuals were noted in their clinical records to have clinical manifestations of liver disease. One limitation of a retrospective study is that the absence of documentation of a specific feature (i.e., the lack of clinical symptoms from hepatitis) is not equivalent to the absence of signs and symptoms. In future investigations, the clinical implications of the common elevations of liver enzymes should be explored with measurements of liver function, such as coagulation laboratory testing, and imaging. Additionally, clinical histories at the time of enzyme measurement were not consistently available. Finally, it is unknown if chronic liver disease may develop in the third or fourth decade of life, since this data was not captured. Additionally, this cohort may be affected by ascertainment bias as it includes only individuals who were diagnosed with AGS (and thus milder forms of the disease may be under-represented), and those individuals whose families choose to enroll in the natural history study. The antibody tested was limited to the individuals from whom samples were available. Despite the incomplete data set due to the structure of a retrospective natural history study, we anticipate that our cohort is representative of AGS. This is because this cohort includes the spectrum of genotypes and neurologic disabilities associated with AGS. When concurrent medical documentation was available, infection or hepatitis-associated medication exposure was identified in approximately 10% of episodes. We hypothesize that the inflammation associated with AGS may drive the recurrent elevation of liver enzymes.
To better characterize the potential pathophysiologic mechanisms underlying the elevations in liver enzymes, we assessed the correlation between liver enzymes, ISG scores, and liver autoantibodies in a subset of individuals with available banked samples. No clinically meaningful correlation between liver enzyme levels and ISGs score was observed. Autoantibodies consistent with autoimmune hepatitis were positive in more than half of our cohort. While these findings are consistent with what described previously in literature,7 they did not strongly correlate with ISG levels, or liver enzyme elevations. While this study suggests that AGS is associated with recurrent and transient elevations of liver enzymes, the mechanism of these changes is unknown.
In this work, we characterized liver enzyme elevation within the AGS population, which we found were present throughout the lifespan of AGS and in all genotypes. Clinicians caring for infants and children with AGS should consider assessment of liver injury and function; similarly, clinicians evaluating children with neurologic disease and elevated liver enzymes should consider the diagnosis of AGS.
Footnotes
Conflict of Interest
Dr. Gavazzi reports grants from NINDS, 1 U01 NS106845-01A1, during the conduct of the study;
Dr. Adang reports grants from NINDS, 1 U01 NS106845-01A1, during the conduct of the study;
Dr. Vanderver reports grants from NINDS, 1 U01 NS106845-01A1, during the conduct of the study; nonfinancial support from Gilead, grants from Eli Lilly, nonfinancial support from Illumina, grants from Takeda, grants from Homology, grants from Biogen, outside the submitted work;
Dr. Shults reports grants from NINDS, 1 U01 NS106845-01A1, during the conduct of the study;
All other authors reported no conflict of interest.
References
- 1.Crow YJ, Manel N. Aicardi-Goutières syndrome and the type I interferonopathies. Nat Rev Immunol 2015;15(07):429–440 [DOI] [PubMed] [Google Scholar]
- 2.Adang LA, Frank DB, Gilani A, et al. Aicardi Goutières syndrome is associated with pulmonary hypertension. Mol Genet Metab 2018;125(04):351–358 [DOI] [PMC free article] [PubMed] [Google Scholar]
- 3.Crow YJ, Hayward BE, Parmar R, et al. Mutations in the gene encoding the 3′−5′ DNA exonuclease TREX1 cause Aicardi-Goutières syndrome at the AGS1 locus. Nat Genet 2006;38(08):917–920 [DOI] [PubMed] [Google Scholar]
- 4.Rice GI, Bond J, Asipu A, et al. Mutations involved in Aicardi-Goutières syndrome implicate SAMHD1 as regulator of the innate immune response. Nat Genet 2009;41(07):829–832 [DOI] [PMC free article] [PubMed] [Google Scholar]
- 5.Rice GI, Kasher PR, Forte GM, et al. Mutations in ADAR1 cause Aicardi-Goutières syndrome associated with a type I interferon signature. Nat Genet 2012;44(11):1243–1248 [DOI] [PMC free article] [PubMed] [Google Scholar]
- 6.Rice GI, Del Toro Duany Y, Jenkinson EM, et al. Gain-of-function mutations in IFIH1 cause a spectrum of human disease phenotypes associated with upregulated type I interferon signaling. Nat Genet 2014;46(05):503–509 [DOI] [PMC free article] [PubMed] [Google Scholar]
- 7.Cattalini M, Galli J, Andreoli L, et al. ;IAGSA study group. Exploring autoimmunity in a cohort of children with genetically confirmed Aicardi-Goutières syndrome. J Clin Immunol 2016;36(07):693–699 [DOI] [PubMed] [Google Scholar]
- 8.Crow YJ, Livingston JH. Aicardi-Goutières syndrome: an important Mendelian mimic of congenital infection. Dev Med Child Neurol 2008;50(06):410–416 [DOI] [PubMed] [Google Scholar]
- 9.Ramantani G, Kohlhase J, Hertzberg C, et al. Expanding the phenotypic spectrum of lupus erythematosus in Aicardi-Goutières syndrome. Arthritis Rheum 2010;62(05):1469–1477 [DOI] [PubMed] [Google Scholar]
- 10.Mieli-Vergani G, Vergani D, Czaja AJ, et al. Autoimmune hepatitis. Nat Rev Dis Primers 2018;4:18017. Doi: 10.1038/nrdp.2018.17 [DOI] [PubMed] [Google Scholar]
- 11.Gilman AJ, Le AK, Zhao C, et al. Autoantibodies in chronic hepatitis C virus infection: impact on clinical outcomes and extrahepatic manifestations. BMJ Open Gastroenterol 2018;5(01):e000203. Doi: 10.1136/bmjgast-2018-000203 [DOI] [PMC free article] [PubMed] [Google Scholar]
- 12.Narkewicz MR, Horslen S, Belle SH, et al. ;Pediatric Acute Liver Failure Study Group. Prevalence and significance of autoantibodies in children with acute liver failure. J Pediatr Gastroenterol Nutr 2017;64(02):210–217 [DOI] [PMC free article] [PubMed] [Google Scholar]
- 13.Strassburg CP, Vogel A, Manns MP. Autoimmunity and hepatitis C. Autoimmun Rev 2003;2(06):322–331 [DOI] [PubMed] [Google Scholar]
- 14.Vanderver A, Adang L, Gavazzi F, et al. Janus kinase inhibition in the Aicardi-Goutières syndrome. N Engl J Med 2020;383(10):986–989 [DOI] [PMC free article] [PubMed] [Google Scholar]
- 15.Common Terminology Criteria for Adverse Events (CTCAE) Version 5.0. 2017. Retrieved from Accessed December 16, 2020https://ctep.cancer.gov/protocolDevelopment/electronic_-applications/ctc.htm#ctc_50
- 16.Kim H, de Jesus AA, Brooks SR, et al. Development of a validated interferon score using Nanostring technology. J Interferon Cytokine Res 2018;38(04):171–185 [DOI] [PMC free article] [PubMed] [Google Scholar]
- 17.Rice GI, Forte GM, Szynkiewicz M, et al. Assessment of interferon-related biomarkers in Aicardi-Goutières syndrome associated with mutations in TREX1, RNASEH2A, RNASEH2B, RNASEH2C, SAMHD1, and ADAR: a case-control study. Lancet Neurol 2013;12(12):1159–1169 [DOI] [PMC free article] [PubMed] [Google Scholar]
- 18.Armangue T, Orsini JJ, Takanohashi A, et al. Neonatal detection of Aicardi Goutières syndrome by increased C26:0 lysophosphatidylcholine and interferon signature on newborn screening blood spots. Mol Genet Metab 2017;122(03):134–139 [DOI] [PMC free article] [PubMed] [Google Scholar]
- 19.Shults JRS, Leonard M. Improved generalized estimating equation analysis via xtqls for implementation of quasi-least squares in Stata. Stata J 2007;7(02):147–166 [Google Scholar]
- 20.Shults and Hilbe. Quasi-Least Squares Regression. Boca Raton, FL: Chapman & Hall/CRC; 2014 [Google Scholar]


