

Abstract
Quantum dots (QDs) are engineered semiconductor nanocrystals with unique fluorescent, quantum confinement, and quantum yield properties, making them valuable in a range of commercial and consumer imaging, display, and lighting technologies. Production and usage of QDs are increasing, which increases the probability of these nanoparticles entering the environment at various phases of their life cycle. This review discusses the major types and applications of QDs, their potential environmental exposures, fates, and adverse effects on organisms. For most applications, release to the environment is mainly expected to occur during QD synthesis and end-product manufacturing since encapsulation of QDs in these devices prevents release during normal use or landfilling. In natural waters, the fate of QDs is controlled by water chemistry, light intensity, and the physicochemical properties of QDs. Research on the adverse effects of QDs primarily focuses on sublethal endpoints rather than acute toxicity, and the differences in toxicity between pristine and weathered nanoparticles are highlighted. A proposed oxidative stress adverse outcome pathway framework demonstrates the similarities among metallic and carbon-based QDs that induce reactive oxygen species formation leading to DNA damage, reduced growth, and impaired reproduction in several organisms. To accurately evaluate environmental risk, this review identifies critical data gaps in QD exposure and ecological effects, and provides recommendations for future research. Future QD regulation should emphasize exposure and sublethal effects of metal ions released as the nanoparticles weather under environmental conditions. To date, human exposure to QDs from the environment and resulting adverse effects has not been reported.
Keywords: quantum dots (QDs), environmental exposure, adverse effects, risk assessment, toxicity
1. INTRODUCTION
1.1. What is a Quantum Dot?
Quantum dots are engineered semiconductor nanocrystals with unique fluorescent properties making them valuable in a range of applications. The term, “quantum dots” (QDs), was initially used to describe zero-dimensional, metallic semiconductor nanoparticles with quantum confinement, which is the change in optical properties directly related to nanoparticle diameter (1, 2). Currently, QDs refer to small-sized (typically 2–20 nm) fluorescent metallic and non-metallic nanoparticles (e.g., carbon-based) that possess quantum confinement effects (3, 4) (Figure 1). A key characteristic of QDs is their ‘quantum yield’. This characteristic defines a QD’s ability to efficiently emit light (i.e., quantums) following light absorption and is measured as the ratio of the number of photons emitted to the number absorbed. The greater the quantum yield, the more useful the QD in manufactured products. They have distinctive physical, chemical, and optical properties; as a result they have been incorporated as active parts of a wide range of commercial and consumer products, such as computer and television display, imaging, and lighting technologies (5, 6). QDs may be made up of one element (such as silicon or carbon) or compounds (such as cadmium selenide (CdSe)) (7). Table 1 provides information about the most common types of QDs.
Figure 1.

Examples of common quantum dots (QDs) including (a) a metal-based QD (i.e., CdSe core with a ZnS shell) and (b) a simple graphene sheet carbon-based QD discussed in this review. In this figure, colored spheres represent clustered layers of atoms including cadmium (blue), selenium (red), zinc (yellow), sulfur (green), and carbon (orange).
Table 1.
Examples of quantum dot types and for metallic quantum dots, groupings, core composition, shell materials and capping agents.
| Quantum Dot Types | Grouping | Core Composition | Abbreviation |
|---|---|---|---|
| Metallic | I – III – VI | Copper indium disulfide | CuInS2 |
| II – VI | Cadmium selenide | CdSe | |
| Cadmium sulfide | CdS | ||
| Cadmium telluride | CdTe | ||
| Zinc selenium | ZnSe | ||
| Zinc sulfide | ZnS | ||
| III – V | Indium phosphide | InP | |
| Indium arsenic | InAs | ||
| IV – VI | Lead selenium | PbSe | |
| Lead sulfide | PbS | ||
| Shell Materials | |||
| Zinc sulfide | ZnS | ||
| Cadmium sulfide | CdS | ||
| Indium arsenic | InAs | ||
| Capping Agents | |||
| Bovine serum albumin | BSA | ||
| Carboxylic acid | COOH | ||
| Di-n-octylphosphine oxide | DOPO | ||
| Dihydrolipoic acid | DPA | ||
| Fatty amines | - | ||
| Mercaptopropionic acid | MPA | ||
| Mercaptoundecanoic acid | MUA | ||
| Polydiallydimethyl ammonium chloride | PDDA | ||
| Polyacrylate acid | PAA | ||
| Polyethylenimine ethylenediamine | PEI | ||
| Polyethylene gycol | PEG | ||
| Polymaleic anhydride-alt-1-octadecene | PMAO | ||
| Primary amines Butylamine Decylamine Hexylamine Hexadecylamine |
- BA DA HA HDA |
||
| Thioglycolic acid | TGA | ||
| Tetraethyl orthosilicate | TEOS | ||
| Trioctyl phosphine | TOP | ||
| Trioctyl phosphine oxide | TOPO | ||
| Carbon-based | Carbon | CQD | |
| Graphene | GQD | ||
| Nanodots | NQD | ||
| Perovskite | Cesium lead tri-iodine | CsPbI3 | |
| Cesium lead tri-bromide | CsPbBr3 | ||
The objectives of this review include describing (1) the important physicochemical properties and applications of QDs, (2) the volume and exposure of QDs in the environment, (3) QD environmental fate, (4) adverse effects, and (5) data gaps in the performance of QD risk assessment. While providing suggestions for next steps in the successful performance of QD risk assessments, the data gaps also highlight where exposure and effects data for QDs are very limited and need to be enhanced. Because this review of QDs covers a wide range of topics, at the end of this report, we include a list of Key Terms with brief definitions. The focus of this review is on QDs representing an exposure in the environment, QDs associated with non-environmental exposures (e.g., medical applications and devices) are beyond the scope of this investigation. While all QDs that may enter the environment are of interest to this review, we focus primarily on QDs most likely to be present in consumer products including metallic (Cd-based and Cd-free), carbon, and newer QDs including perovskite. The scientific literature available for these types of QDs is also abundant.
1.2. Physicochemical properties of QDs
Metallic, carbon, and newer types of QDs have a range of unique properties resulting in the diversity of applications described in detail below. In the next section, some of these properties will be discussed along with the characteristics which distinguish QDs from other nanoparticles.
1.2.1. Composition
Based on elemental composition, metallic QDs can be classified as (1) Group II-VI, which includes cadmium selenide (CdSe) (8–11), cadmium sulfide (CdS) (12, 13), cadmium telluride (CdTe) (14, 15), (2) Group III-V, which includes indium phosphide (InP) (16, 17) and indium arsenide (InAs) (18), (3) Group I-III-VI including copper indium sulfide (CuInS2) (19), and (4) pervoskites (e.g., ABX3)(20–22) (Table 1) (Figure S1).
The most popular QDs in consumer products are CdSe and CdTe because they have the highest quantum yield and are monodispersed (23). The surfaces of Cd-based QDs are often capped (as discussed in section 1.2.5) to modify their behavior and increase performance, resulting in decreased dissolution and release of the metal ion (24). As a result of concerns with the release of cadmium, Cd-based QDs are also being replaced in some applications by Cd-free alternatives such as InP, zinc sulfide (ZnS), and carbon-based QDs (25–28). Depending on their compositions, Cd-free QDs have physical and chemical properties that are different from Cd-based QDs. For instance, InP QD has a higher photostability compared to CdSe due to the covalent bond between indium and phosphide, compared to the ionic bond occurring in CdSe (23, 29).
Carbon-based QDs are a promising alternative to Cd-based QDs (Figure 1). They are mainly composed of carbon, hydrogen, and oxygen, and the proportion of each element varies between synthesis processes (30). Most carbon-based QDs are made up of amorphous or nanocrystalline cores (31), and can also occur as graphene QDs (32) (Table 1; Figure S1). Graphene QD (GQD) consist of higher sp2 hybridized carbon structures compared to other carbon-based QDs (33–35). In addition, other non-metallic elements (e.g., nitrogen, phosphorous, and sulfur) can be incorporated into the lattice of carbon-based QDs to enhance properties such as luminescence, electrical conductivity, dispersability, photostability, and fluorescence to increase the scope of their applications (36–43). While carbon QDs have showed promising optical properties as alternatives to Cd-based QDs, their synthesis often requires rigorous post-treatment processes to correct for drawbacks such as non-uniformity in size and agglomeration(44).
Perovskite QDs are a new class of QD materials and are fast gaining commercial relevance due to their favorable optical and electronic properties, low cost, and ease of synthesis (45, 46). Perovskite QDs have physical characteristics, including defect tolerant structure, high absorption efficiency, and photoluminescence quantum yield, that often surpass other QD varieties (47, 48) although they are often limited by poor chemical, thermal and photostability (49). Synthesis of pervoskites QDs also often involve high temperature and the use of toxic solvents such as toluene. Perovskite QDs may be organic-inorganic hybrids or fully inorganic; and are represented by the chemical formula ABX3 (e.g., CsPbI3 or CsPbBr3) (50, 51) in which A is an inorganic monovalent cation (such as caesium, Cs+) or an organic cation (such as methylammonium, CH3NH3+, or formamidinium, (NH2)2CH+) (52), B is an inorganic-metal cation such as lead (Pb) or tin (Sn); and X is an anion, such as oxygen, halogens, or alkali metals (49, 53–56).
1.2.2. Structure
Structurally, metallic QDs occur in three basic forms: the core, core/shell or alloyed types (Figures 1 and 2). QDs may also be conjugated with capping agents; which is discussed in Section 1.2.5. Core type QDs, such as cadmium telluride (CdTe), lead sulfide (PbS) and cadmium selenide (CdSe), are made up of one material, and can be metallic chalcogenides. These are compounds that consist of at least one chalcogen and at least one more electropositive element, such as cadmium (Cd), lead (Pb) or zinc (Zn) (57). Core/shell QDs are made up of inorganic cores encapsulated within a semiconductor material that has a higher band gap. Examples of core/shell QDs include CdSe/CdS, ZnS/CdSe and CdSe/InAs (22, 58, 59). Core/shell QDs were developed to improve on the quantum yield of core-type QDs and they exhibit combined properties of both the core and the shell materials (60).
Figure 2.

Selected physicochemical properties of QDs: (a) structural classification of QDs; effect of QD size on (b) energy band gap and (c) emission spectra.
Alloying QDs is an alternative approach to tuning the physical and opto-electronic properties of QDs without changing their crystallite size (Figure 2) (61). For instance, ZnxCd1-xSe is formed from alloying ZnSe and CdSe, while CdS and CdSe may be combined to form CdSxSe1-x (where x is a stoichiometric value) (62). Varying the composition of alloyed QDs leads to simultaneous alterations in their physical and opto-electronic properties (61). Based on composition, alloyed QDs can be either homogeneous (similar composition throughout the QD) or gradient (composition varies in different parts of the QD) (63–67).
1.2.3. Size and Shape
Metallic QDs are very small with diameters typically between 2 and 10 nm; however, sizes up to 20 nm have been reported (68, 69). Size plays an important role in the chemical, electronic, and optical properties of QDs because the band gap energy level of QDs is inversely related to particle size (Figure 2) (70, 71). The color (wavelength) of light emitted by QDs varies with their size: as the size of a QD decreases, the wavelength of emitted light decreases with a corresponding increase in frequency and energy (Figure 2) which contributes to their favorable optical properties (see section 1.2.4).
Shapes of common QDs include spheres, cubes, disks, rods, pyramidal, needles, cones, and cylinders (72–74). Carbon-based QDs often consist of mono-atomic thick sheets of graphene or graphene oxide (Figure 1). QD properties are strongly affected by their shape, for example, computational methods show that cubic CdSe QDs have smaller bandgaps and lower emission energy than spherical CdSe QDs because cubic QDs possess a degree of asymmetry that weakens their quantum confinement effect while spherical CdSe have higher surface-to-volume ratios (75).
1.2.4. Optical properties
One of the novel properties of QD is their size-dependent emission wavelength. QDs absorb light when the excitation energy is higher than their bandgap, which results in the promotion of electrons from the valence band to conduction band (76). Smaller QDs (~2nm) emit lower wavelengths corresponding with violet and blue colors, whereas larger QDs (~8 – 10 nm) emit higher wavelengths corresponding with the color red, on the opposite end of the visible light spectrum (Figure 2). As such, the frequency and color of light emitted by a QD can be altered (i.e., tuned) by changing the size to appropriately fluoresce for their intended purpose. For example, the emission wavelength of CdSe/ZnS QDs can be tuned from blue to red by increasing its particle size (77, 78). Size-dependent tuning is also performed in non-metallic QDs, such as graphene QDs, which fluoresce from green to near infrared upon varying the size from 0.46 to 2.31 nm (79–81). The smaller the size of QDs, the higher the energy difference between the conduction and valence band and the shorter the emission wavelength. As a result, QDs can emit electromagnetic radiation at different wavelengths from ultraviolet (UV) to visible to near-infrared (NIR) regions. For instance, CdSe and other group II – VI QDs exhibit a tunable emission within the visible spectrum (480 – 650 nm) while group IV – VI QDs (PbSe, PbS, SnSe) show tunable NIR emission from 600 – 2200 nm (82). Carbon-based QDs, on the other hand, have tunable emission wavelength within 320 – 580 nm (83). The wide range of tunable emission wavelengths contributes to QD use in a variety of electronic display applications.
1.2.5. Capping Agents
Capping agents are necessary to ensure photostability during application by minimizing the impact of surface defects on luminescent efficiency (84, 85). The surface of QDs can be modified using organic (such as tri-n-octylphosphine oxide (TOPO) (85, 86)) or inorganic (such as tetraethyl orthosilicate (TEOS) (87, 88)) capping agents (Table 1). Along with minimizing the impacts of surface defect, organic capping agents are particularly advantageous because they also ensure colloidal stability (i.e., ability of the QD to remain suspended in aqueous solution) and allow conjugation of QDs to biologically functional molecules. TOPO is widely used because it has a high boiling point, which allows for high quality QD synthesis through high temperature nanoparticle formation (86). However, phosphorus-containing impurities in TOPO can introduce variability in the structure of the synthesized QDs and also affect morphology, quality and growth kinetics of QDs (89). In addition, the use of greener and less energy intensive capping agents are still required as substitutes to TOPO. Other common organic capping agents include mercaptans, primary amines (such as hexadecylamine, decylamine, hexylamine, and butylamine), polyethylene gycol (PEG), and fatty amines (86).
In addition to photostability and colloidal stability, capping agents prevent uncontrolled crystal growth and reduce agglomeration (86, 90, 91). Capping agents also affect electron transfer reactions, shape, size, and core durability of QDs to maximize favorable properties for specific applications (92–94). In addition, capping agents dictate the thermal stability, degree of oxidative degradation, and optical properties of QDs (88, 95). As noted above, surface modification with capping agents functionalizes QDs for specific interactions with target analytes and facilitate conjugation with biofunctional molecules for sensing applications such as fluorescent dye analogues (96–100).
1.2.6. Quantum confinement
The unique properties of QDs are largely due to the quantum confinement effect. Quantum confinement is the spatial confinement of electron-hole pairs (excitons) formed when an electron excites from a valence band to a conduction band, in one or more dimensions within a material (101, 102). Quantum confinement originates from an increase in band gap as the size of a bulk material decreases and electrons in the resulting compact particles become confined in a small space (101, 103, 104). Quantum confinement occurs in QDs as the radius of a semiconducting material becomes smaller than the Bohr’s radius because QDs have sizes comparable to their Bohr radii (1 – 5 nm) (105–107). Apart from changing QD size, the quantum confinement behavior of QDs can be modified by controlling QD surface chemistry and composition (108, 109).
Throughout this review, we will be using the core/shell-capping agent/surface coating annotation to describe specific QD varieties; for example, CdS/ZnS-PEG represents QDs with a cadmium sulfide core, zinc sulfide shell, and conjugated with a polyethylene gycol capping agent.
1.3. Synthesis
The synthesis routes for QDs can be broadly grouped into (1) top-down and (2) bottom-up approaches (Table S1) (110). The top-down approach involves decreasing the size of a larger material to the desired QD size, while in the bottom-up approach, QD particles are synthesized from precursor molecules.
1.3.1. Top-down synthesis approach
The top-down synthesis route involves the breakdown of bulk semiconductor materials or large precursors to nanosized QDs. Breakdown or thinning of bulk materials to QDs is achieved by several techniques, including arc discharge (111–113), acidic oxidation (114, 115), hydrothermal/solvothermal treatment (116–118), electrochemical oxidation (119), and chemical oxidation (120). Specifics of each synthesis technique are discussed in Table S1. These techniques are particularly applied in the synthesis of carbon-based QDs, although carbon-based QDs can also be synthesized by bottom-up approaches (121–123). Techniques such as electron beam lithography, reactive-ion etching, laser beams, and focused beams have also been used to synthesize metallic QDs with sizes smaller than 30 nm (84, 124).
The top-down approach is often limited by poor yield, long reaction time, harsh conditions necessary to form QDs, and high costs (125). Contamination of QDs with impurities and structural imperfections are also common when using top-down approaches. Hence, top-down synthesis approaches are not commonly used for large-scale manufacture of QDs (115). However, with the advent of renewable feedstocks for carbon-based QD such as chitin, chitosan, graphite, and starch, the cost of producing carbon-based QDs via top-down approaches may be much lower compared to non-carbon QDs (69, 126). Also, the use of carbon-rich and relatively inexpensive feedstock (such as coal) to synthesize carbon QD is becoming popular (127, 128).
1.3.2. Bottom-up synthesis approach
Bottom-up approaches involve chemical reduction of molecular precursors to form atoms that nucleate, grow into monodispersed colloids, and self-assemble (129). Bottom-up approaches are the most common synthesis route for monodispersed QDs (e.g., PbS) (130). Conventional bottom-up synthesis of QDs is carried out in organic media in the presence of hydrophobic surface ligands—such as TOPO, trioctyl phosphine (TOP), di-n-octylphosphine oxide (DOPO), or hexadecylamine (HDA)—as capping agents (131, 132). Bottom-up synthesis can be broadly classified into vapor phase methods and liquid phase (wet-chemical) methods (described in detail in the SI sections S1.1 and S1.2).
1.4. Applications
QDs have been increasingly produced and used in the past two decades for a wide array of applications, ranging from biological imaging to display technology, and incorporation in solar panels and nanofillers (107, 133–136). In 2012, QD global production was projected to be around 0.6 to 55 tons/year (137). Major (known) QD manufacturers include Nanoco (UK), QD Vision (Masacchusett, USA), Quantum Materials (Texas, USA), and Nanosys (California, USA). According to a 2019 Future Market report, the production of the top three QD manufacturers (Nanoco, Nanosys, and Quantum Materials) was about 57 tons (138), which implies that the global production of QDs is possibly in the hundreds of tons today. Reliable data on regional and global QD production is needed, especially by the small and midsized companies in the industry. In 2016, the QD industry generated a total revenue of $610.0 million in the global market, and the revenue was estimated to reach $10.4 billion by 2021 with an expected >200% yearly increase over the next decade (138).
The entirety of consumer and commercial products enabled with QDs is unknown. More so, there is only limited data on the amount of QDs present in products known to contain them. Thus, there are important data gaps in the subject of QD applications.
1.4.1. Current Applications
Valued for their light-emitting (i.e., fluorescent) properties, QDs are increasingly used in consumer and industrial products with displays such as televisions, computer monitors, tablets, and cell-phones. QDs are also widely used in medical imaging, solar cells and windows, security tags and inks, sensors, lasers, and biomarkers (138). As shown in Figure 3, the largest application of QDs (as at 2018) was display technologies (90%), LED lighting (4%), and biotechnology and medicine (2%) (138). Other applications include packaging and paper, anti-counterfeiting ink, and biosensors.
Figure 3.
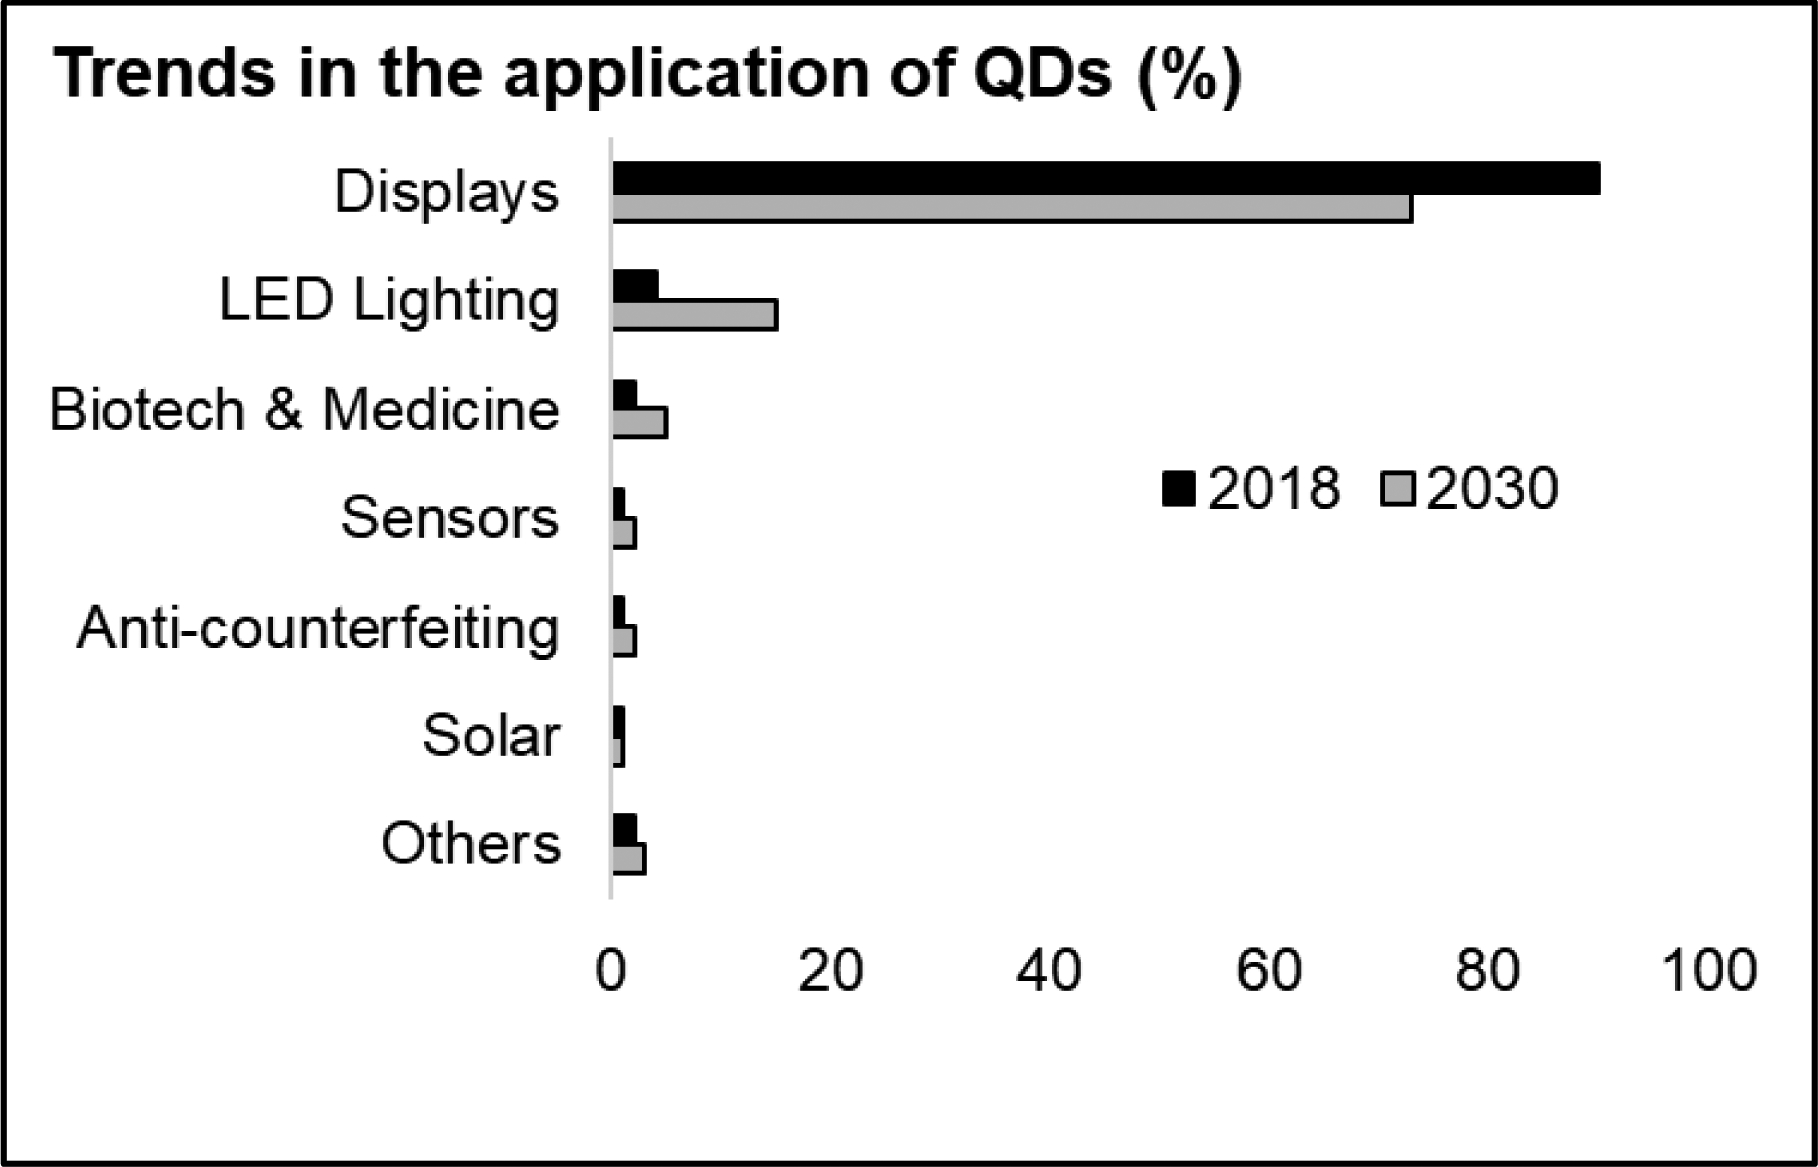
Quantum dot applications trend data in 2018 and 2030. Data source: (138)
QDs are mostly used in liquid crystal displays (LCDs), resulting in displays that are approximately 10–50% more efficient than standard LCDs (138). The main QDs used in LCDs are Cd-based, (that is, CdTe and CdSe QDs) due to their high photoluminescence (PL) quantum yield, and photostability (138). Similarly, QD light-emitting diodes (LEDs) have narrow emission spectra, and high photostability, which allows for a considerable cost reduction compared to organic LEDs (OLED- a LED that uses organic molecules as the optically active element) (138). In Europe, the amount of Cd-based QDs in consumer products is restricted to ensure the Cd concentration is less than 100 ppm, as required by the European Union’s Restriction of Hazardous Substances (RoHS) (139). This restriction of Cd content is shifting the market trend of QDs towards Cd-free alternatives, such as InP and perovskite QDs (140, 141).
Many Cd-based QDs have enhanced fluorescent potential compared to the Cd-free QD alternatives that often have more stable core materials. There are often tradeoffs between brightness and stability with Cd-free alternatives. For example, the energy band gap of bulk InP (1.35 eV) is similar to that of bulk CdSe (1.74 eV), and by controlling its size, InP QDs can fluoresce at most visible wavelengths (142). InP QD LEDs have low external quantum efficiency (about 12% due to defects in the deep in-gap states of InP QDs) (143); but Samsung researchers recently prepared InP with ZnSe and ZnS shells, which increased the external quantum efficiency of the resulting LED to the theoretical maximum for QD LEDs (21.4%) (144). The InP-based QD-LEDs are expected to be used in next-generation commercial displays. Similarly, display manufacturers are exploring metal halide perovskite QDs, which offer high quantum efficiency, and provide the best peak brightness in LCD displays (138).
CdSe and graphene QDs are also applied in white light-emitting diodes (WLEDs) (28, 145). A commercial QD-enabled acrylate polymer is used as a faceplate in LED lamps to look like incandescent lamps but with more efficient luminescence (113 Lm/W) than incandescent lamps (17 Lm/W) (146), and significant energy savings (147). QDs used for spectral correction can further save 25–40% of energy compared to LEDs that use broadband down-conversion (process by which a high definition signal is converted to standard resolution for display on lower resolution systems) materials like rare-earth phosphors (148).
QDs are also suitable for smart diagnostics, which has led to applications in biotechnology and medicine (149). QDs are widely used as sensors to detect various chemical and biological species due to their unique optical properties obtained by modifying the surfaces of QDs (150–152). For instance, dopamine, an essential neurotransmitter, can be detected in vitro using the near-IR electrogenerated chemiluminescence (ECL) of Ag2Se QDs (152). CdS QDs are also used as photoelectrochemical sensors for the detection of biochemical molecules, such as tyrosinase, an indicative marker for melanoma cancer cells (153). Photoelectrochemical sensors typically consist of QDs with surface modifications that act as a linking molecule (linker) to bind to an electrode. Examples of linkers include alkanedithiols (154) and 1,6-hexanedithiol (155). In brief, the QDs fluoresce when they are conjugated to the target biomolecules. When illuminated, a photocurrent is generated, depending on the type and concentration of the analyte in the immediate environment of the electrode (156).
1.4.2. Future Applications
The high demand for QD technology is primarily driven by the growing needs for low-cost high definition displays, improved diagnostic sensors, easier medical imaging, and the low-power/ renewable energy market (138). More so, QD displays have longer lifetimes compared to non-QD LED displays, which translates to low cost in the long run (138). Thus supporting the market predictions of increasing QD production for consumer products and industrial applications over the next decade.
LEDs with QD luminophores and InP-based QD-LEDs are promising in the development of next-generation displays (144, 157). Thus, display devices of many sorts will continue to hold a major share of the QD market (Figure 3). Device-grade thick shell CdZnSe/ZnSe/ZnS QDs are expected to be used in WLED to obtain bright white light with high color index (158). QD alloys with enhanced luminescence and superior monochromaticity for LED lamps will also continue to gain ground (157, 159). QDs (such as ZnS and perovskite) will continue to be incorporated into solar cells to improve efficiency and energy storage (160–162). In addition to solar cells, future applications of perovskite QDs will likely include light-emitting devices and displays (47, 161, 163). Other upcoming QD-based product launches include flash-memory, solar roofing tiles (having OLED flexible displays), and flexible electronics (138). QDs will also play a growing role in biosensors, such as in antiviral agents, for detecting the attenuation of COVID‐19 infection (164, 165).
2. VOLUME AND EXPOSURE
2.1. Estimates of QDs in the environment
Given the rate at which QDs are being manufactured for a range of consumer products and applications, it is highly probable they will continue to enter the environment. While experimentally-derived environmental concentrations of nanomaterials are rare, partly due to limitations in analytical capabilities (166), models-based estimates/predictions have been reported. Using modeling approach to predict the amount of nanoparticles accumulating in Danish aquatic and terrestrial ecosystems between 2000 and 2014, Gottschalk et al. (2015) Gottschalk, Lassen (167) estimated that the concentration of QDs (Cd-based ans Cd-free) was 0.2 – 45 μg/kg in freshwater sediment and 0.04 – 2 μg/kg in seawater sediment. The modeled concentrations of QDs in surface waters were extremely low, reportedly in the femtogram per liter (fg/L) range (1 fg/L = 10−15 g/L). Additionally, sludge-treated soils were predicted to contain 0.0001 – 0.013 ng/kg QDs. These predicted environmental concentrations of QDs were orders of magnitude lower than the corresponding concentrations predicted for most other commonly used nanoparticles (including carbon nanotubes, TiO2, ZnO, and Ag) (167). The lower environmental concentrations of QDs were attributed to low production volumes relative to other engineered nanoparticles, dissolution of QDs in the natural environment, and application in products with limited environmental exposure during use (167–169). The dissolution of metallic QDs is a major characteristic affecting their fate and adverse effects. Despite our knowledge of the magnitude of current and future QD production, the actual amount of QDs in commercial products are not well known and will likely vary greatly. The amount of QDs detected and/or estimated in a few displays was below 0.005% and are described in detail in SI section S2 and Table S2.
Concentrations of QDs in the environment will likely vary between geographic regions. In regions of Europe, Wang and Nowack (2018) Wang and Nowack (170) predicted a surface water QD concentration range of 9.6 – 530 fg/L for waters in seven European regions (i.e., the European Union and six sub-regions, which are Central Europe, Northern Europe, Southern Europe, Eastern Europe, South-eastern Europe, and Switzerland) based on accumulations from 1990 to 2014. Predicted sediment concentrations of QDs in the regions, 0.17 – 9.4 ng/g, were substantially higher than the values predicted by Gottschalk et al. (2015) (167) for Denmark, which was attributed to the inclusion of direct environmental release of QDs in the estimate by Wang and Nowack (2018) Wang and Nowack (170). In addition, the predicted amount of QDs in sewage-treated soil (0 – 17 ng/kg) was higher than in natural and urban soil (0.003 – 0.027 ng/kg), demonstrating that QDs can potentially enter terrestrial ecosystems through the application of treated sewage and sludge.
2.2. Environmental release of QDs during product lifecycle
Environmental releases can occur at various phases of the QD’s or QD-enabled product’s lifecycle, including synthesis, manufacturing, application, and end-of-life (105, 171) (Figure 4). Environmental concentrations of QDs are expected to increase, due to projected increases in QD applications and the relatively long half-lives of some varieties of QDs (i.e., those QDs that do not readily undergo dissolution) and QD-enabled devices (months to decades) (105). Mechanisms of release and factors affecting release of QDs from products are fully discussed in the Environmental Fate section. QDs may be released into the environment in the form used in products, but they may also be transformed in products, or during/after environmental release. As an example, while Cd-based QDs may be released from a product matrix as particles during incineration, Cd will likely be released as dissolved ions in landfills due to interaction with natural waters (i.e., rainwater, groundwater) and acidic landfill leachates (172) resulting from the presence of waste-related organic matter.
Figure 4.

Typical lifecycle of QDs/QD-enabled products and their possible environmental exposure pathways. Note, occupational and consumer exposure are beyond the scope of this review.
2.2.1. Environmental release during QD synthesis and product manufacturing
Release of QDs may occur during synthesis in research laboratories and manufacturing facilities. Release may happen due to processes associated with synthesis, post-synthesis, and waste generation. For instance, most QD applications require a well-defined particles size, and size-enrichment (for instance, via centrifugation or filtration) to obtain the desired QD size is an important part of most synthesis methods. Particles with sizes outside the desired range and those within the desired range lost during enrichment may end-up in the waste stream (Waste streams are regulated by the Clean Water Act via wastewater effluent testing, but nanoparticles are not specifically included in testing), and finally in the environment, depending on the amount removed or degraded during any wastewater treatment. The yield of different synthesis approaches, 9 – 90%, (Table S3) shows there are opportunities for material loss during synthesis. It should be noted that not all the mass loss during production (based on yield) is actual QDs as some of it may be precursors and other byproducts.
As noted above, the amount of QDs incorporated into products is not widely known. However, experimental analysis of popular consumer displays revealed the amount of commonly used QDs ranged from 0.00011 to 0.0049% (Table S2) (173, 174). This suggests that only small masses of QDs are used during product manufacturing, which may lead to only small release compared to products that use substantial amounts of nanoparticles (such as nano-enabled paints(175)).
Using typical estimates of nanoparticles released during synthesis and product manufacturing (0.1 – 2% of the total production (176, 177)), we estimated that 0.057 – 1.14 metric tons of QDs are released into the environment each year via synthesis and major manufacturing activities (see details of estimation and results in SI section S4 and Table S4). The largest fraction of the environmental release is into wastewater treatment plants (WWTPs) and the atmosphere, where the high estimate was 0.456 ton/year.
2.2.2. Environmental release during transport and storage
Release of QDs during transport and storage of products will mainly occur due to breakage while in transit or if mishandled. Release of QDs at this life cycle stage is expected to be minimal due to advances in product packaging and encapsulation of QDs in devices. Release will likely be similar to releases during the use phase (discussed below), if it occurs at all.
2.2.3. Environmental release during use
The small amount of QDs used in devices are typically strongly embedded in the products (e.g., QD are integrated into the physical matrix of the product). Thus, only a small amount of QDs are expected to be released into the environment during the use phase (170). The amount of QDs estimated to be released during use from this study are shown in Table S5. Release of QDs from products during use is mainly dependent on the product matrix, and how the product is used. If the physical matrix is weathered or abraided, QD particles and polymer fragments with attached QDs may be released into the environment (171). For products that are constantly in contact with an aqueous phase, such as QDs embedded in low density polyethylene (LDPE) or acrylate polymers used in dental fillings, release is expected to occur via dissolution and/or desorption of QDs at the physical matrix surface (Figure S2). Release of fully embedded QDs from nanocomposite materials may occur if the matrix is permeable (for instance, acrylate and LDPE (136, 148)). Acrylic glass or other low permeability transparent polymers used to incorporate QDs in commercial display technologies attenuate dissolution of embedded QDs (136). More so, most display technologies are only expected to contact liquids infrequently or by accident.
In addition, QDs used in displays are firmly embedded in the screens, usually enclosed in multiple layers of glass and plastic, which are very difficult to separate without aggressive activities (173, 174, 178). As a result, there is extremely low probability that the QDs will be exposed to the environment during normal use (178). Similarly, QDs used in photovoltaic (PV) cells will likely not be released into the environment during use due to their encapsulation in thick layers of glass or plastic matrices (174). Metal leaching from PV panels exposed to corrosive media was minimal due to the protective nature of the matrix; hence, precipitation is not expected to cause leaching of QDs from rooftop solar panels (174, 179, 180).
According to our use-phase estimates, higher amounts of QDs may be released into the environment in applications such as biomedical and packaging compared to uses in sensors and electronics. No release into the atmosphere was estimated as a result of QD use in packaging, sensors and paper. Soil was the largest environmental sink of QDs generated by releases originating from electronics applications. With the increased use of QDs for medical applications (170, 181) the WWTPs are predicted as the largest intermediate “sink” for releases from this source. The results obtained from our estimation are similar to those reported by Wang and Nowack (2018) (170).
2.2.4. Environmental release during end-of-life
At the end-of-life phase, most devices enabled with QDs will be landfilled, incinerated, or recycled (170). Landfilling may expose the devices to low pH conditions, which typically promote dissolution of metals (178). Most studies that have investigated release of QDs from commercial products under conditions simulating landfills reported low release of dissolved metals due to strong encapsulation of QDs in products (as described above; Table S6). In a study investigating release of QD metals from two products with QD-enabled displays (i.e., a 2011 Kindle Fire tablet with CdSe/ZnS QD-enabled display and a 2016 Samsung TV with InP/ZnS QD-enabled display) simulating release during landfill disposal (i.e., Resource Conservation and Recovery Act (RCRA) toxicity characteristic leaching procedure (TCLP) extraction fluid), researchers reported a maximum Cd release of 0.021% (relative to the original amount of QD in the products, which is a very low overall release (Table S2 represents the amount of QDs embedded in several kinds of display devices (173, 174)). Similarly, Brown et al. Brown, Bi (174) reported minimal release (<0.2 μg/L) of Cd and In from the same devices (i.e., Kindle Fire tablet and Samsung TV) when the TCLP test and California waste extraction test (WET) were performed; but the amount of zinc liberated was in the mg/L range (174). Neither Cd or In was released at levels that were detectable when five PV cells were subjected to TCLP and WET tests (174). Cd and other metals (except Pb) released from the PV cells and displays were below the RCRA hazardous waste limits, but increases in disposals as product manufacture and usage increase will very likely, eventually lead to elevated concentrations in landfills.
During incineration of CdSe/ZnS QD-enabled products, the QDs partitioned into particulate matter in the exhaust and into bottom ash (182). In products with higher loads of QDs, the fraction in the bottom ash increased significantly (182). Unlike landfilling, incineration of QD-enabled devices would concentrate hazardous metals (including Cd) in waste ashes (182) at concentrations that may exceed the RCRA and California hazardous waste limits (174). QDs in the bottom ash may retain their original size and morphology, but agglomeration and transformation (to different sizes and chemical composition) may also occur during the severe conditions of incineration (182). The presence of QDs in the particulate matter implies that the nanoparticles may be emitted to the atmosphere when QD-wastes are incinerated. Thus, incineration increases the possibility of QD release into the environment via atmospheric transport.
Recycling of QD-based products, such as PV panels and thin-film displays, at their end of life minimizes or eliminates environmental release of Cd and other metals (174, 180). Occupational human exposure risk is typically high when devices containing toxic materials are recycled. However, Cd emissions to the workplace (and the environment) are regulated in the United States by agencies including the Occupational Safety and Health Administration (OSHA) and the U.S. Environmental Protection Agency (U.S. EPA), as well as state and local agencies. It is important to note that similar human and environmental safety regulations may not exist or be enforced in some communities in low- and middle-income countries, where informal recycling and illegal flow of electronic waste (e-waste) is often rampant (183, 184). Overall, the environmental release of QDs is more likely to occur during their synthesis and incorporation into final products than during use and disposal (if properly disposed and handled). There are no estimates for illegal or improper disposal of QD-containing products and e-waste, but this does not eliminate the possibility that QDs are entering and will continue to enter the environment through improper disposal.
As shown in Table S6 we estimated that the highest release at end of life of QDs/QD-enabled devices is from the filters of waste incineration plants (55.86 ton/year) followed by wastewater sludges (55.29 ton/year) (Table S6). Depending on the use of sludges, they may be introduced into the greater environment including agricultural soils and landfills. A summary of current studies on release of QDs from products disposal is in Table S7.
3. ENVIRONMENTAL FATE
Although QD release to the environment is relatively low compared to other engineered nanoparticles, as production and use increases, there is a higher probability that greater amounts of QD’s will enter the environment, particularly during increased manufacturing and synthesis processes. The fate of QDs in the environment, which is controlled by processes such as dissolution, agglomeration, and chemical transformation, determine the ecological receptors that will be exposed to them and potentially be adversely effected (185, 186). These processes are impacted by the physicochemical properties of QDs (such as chemical composition and surface coatings), and environmental factors (such as pH, light, natural organic matter (NOM), and ionic strength (salinity). Unlike the abiotic factors discussed here, the impact of microbes on QD fate is not well understood or studied.
3.1. Dissolution
QD may enter aqueous environments via WWTPs outflows. Dissolution in the aqueous phase is important for the fate of QDs, particularly those with metallic cores (e.g., CdSe, CdTe, ZnSe, or PbSe) and/or shells (e.g., ZnS or CdS) as it transforms them from dispersed or agglomerated nanoparticles to dissolved ions. Unlike particulate QDs, which may remain in the aqueous phase (if sufficiently stable) or settle out (if unstable), dissolved ions disperse into all environmental phases, and are potentially more toxic (i.e., more bioavailable) than the nanoparticles (168)(187). Like other nanoparticles, dissolution of QDs is controlled by environmental factors (such as pH, ionic strength/salinity, dissolved oxygen concentration, and NOM content) as well as the physicochemical properties of the QDs (such as size, surface coating with inorganic shells or capping agent, and properties of the capping agents) (169, 186, 188).
The presence of ions in water (e.g., seawater) promotes dissolution of nanoparticles by advancing complexation, or decreases dissolution through common ion effects or nanoparticle agglomeration (i.e., “salting-out effect”). Dissolution of Cd-based QDs (including CdS, CdTe, and CdSe) has been reported in different types of water, including deionized (DI) water and waters with different levels of ions, including natural seawater (169, 186, 188–190). The dissolution of the ZnS shell of CdSe/ZnS QD was slowed when elevated concentrations of Zn2+ and Cd2+ were present in water, but little to no impact on the dissolution of the CdSe core was observed (190). However, the release of Cd2+ from CdSe was slower in seawater compared to DI water or freshwater, possibly due to nanoparticle agglomeration that led to decreases in surface area or the presence of more ions in seawater led to decreased dissolution (169, 189).
Cd-based QDs dissolve via an oxidative process, and the dissolution is driven by chemical, photochemical, and biological processes (169, 186). Interestingly, dissolution of Cd-based QDs (to release ions such as Cd2+, SeO42−, and Zn2+) increases with ultraviolet light intensity (169, 185, 186, 190), oxygen and other oxidizing agents (such as hydrogen peroxide) (185, 186, 189, 190), and temperature (186). When excited by UV light, Cd-based QDs generate superoxide radicals () from surrounding oxygen, which induces photooxidation of the nanoparticles (186). Thus, Cd-based QDs are more persistent in the absence of light and oxygen (186, 189, 190). For example, complete dissolution of the core CdSe in mercaptopropionic acid (MPA) capped CdSe/ZnS QDs took more than 80 days in the absence of light despite complete dissolution of the ZnS shell within a week (190). In the absence of light, dissolution of Cd-based QDs is driven by oxidation from species such as oxygen, hydrogen peroxide, and oxygen radicals, which are present in natural waters due to photochemical reactions driven by sunlight (186, 190, 191). Oxygen (and other oxidizing agents) can oxidize selenium in CdSe QDs to produce selenium oxyanions, which can detach from the QD surface and leave behind Cd2+ cations (185, 186, 192). Increases in temperature decreases the dissolution activation energy and enhances the mass transfer rates of dissolved oxygen to the surfaces of QDs, thereby enhancing dissolution (186).
The influence of NOM on the release of Cd from QDs is concentration-, light-, and time-dependent. More Cd2+ was released from polydiallydimethylammonium chloride (PDDA)-coated CdSe/ZnS QDs as humic acid (a type ofNOM) concentrations increased up to 20 mg/L (186). NOM improves dissolution due to its sensitization effect and the generation of reactive oxygen species (ROS), which enhance the photooxidative dissolution of QDs (186). More so, NOM may promote dissolution of Cd-based QDs by forming complexes with dissolved ions (193). The concentration of Cd2+ detected in the presence of 50 mg/L humic acid was however lower than that observed in the presence of 5 mg/L humic acid (186). The decrease of dissolution at high humic acid concentration is likely related to the surface coating of QDs, and chelation of Cd2+ by the NOM (186, 194). Synthetic complexing agents, such as citrate and ethylenediaminetetraacetate (EDTA), similarly promote the dissolution of Cd-based QDs by complexing dissolved ions and weakening nanoparticles structural bonds (188, 190, 194, 195). Similar to humic acid, extracellular polymeric substances (EPS), which are produced by microorganisms and are abundant in natural waters (191, 196, 197), promoted the dissolution of uncapped and ligand-capped CdSe QDs in both DI water and artificial seawater (169). The promotion of dissolution of CdSe/ZnS QDs by Suwannee River humic acid (up to 50 mg/L) in the dark was only observed for up to 20 days, after which there was no significant dissolution. In contrast, humic acid did not enhance the dissolution of CdSe/ZnS QDs under low light conditions in seawater; whereas, dissolution was strongly enhanced by humic acid under high light intensity(189). An ecological effect of NOM, humic acids and other agents (e.g., EDTA), is that when chelated and no longer dissolved, the bioavailability and toxicity of metals has been shown to decrease significantly (198).
Capping the surface of Cd-based QDs with ligands and other organic or inorganic substances (such as ZnS, bovine serum albumin, dihydrolipoic acid, and polyacrylate) (199, 200), which is typically done to increase the quantum yield and stability of nanoparticles, also moderates dissolution by limiting the transport or diffusion of oxygen onto the nanoparticle’s surface (185, 189). Thus, ligands with longer chain lengths, higher molecular weights, and structural complexities decrease the dissolution of Cd-based QDs more effectively than smaller and simpler capping agents. More so, short chain capping agents tend to be unstable on the QD’s surface and can readily detach (190, 201). PDDA-coated CdSe/ZnS QDs released lower concentrations of Cd and Se ions compared to poly(ethylene glycol) (PEG)-coated QDs under similar experimental conditions due to the higher complexity and molecular weight of PDDA (186). In artificial seawater, capping agents with amine groups protected CdSe QDs from dissolution, much more so than QDs capped with carboxylic ligand or QDs with no capping (169). The hinderance of dissolution from capping agents may also be time-dependent as the ZnS shell of MPA-capped CdSe/ZnS QDs completely dissolved within a week, exposing the core to the external environment (190). Thus, capping agents and surface modifications of QDs are important factors in whether organisms are exposed to intact QD nanoparticles or dissolved ions from core materials.
Along with light, NOM, and ionic strength, pH has substantial effects on QD environmental fate; for example, complete dissolution of the (CdS) shell of a poly(acrylic) acid (PAA)-capped CdTe/CdS QD was observed within 48 hours at pH 4.5. Although the dissolution rate of the QD was lower at pH greater than 4.5, dissolution was not linearly correlated with pH (partly due to the capping ligand). The trend reported was that dissolution was greater at pH 4.5 than at pH 8.5, which was greater than at pH 6 (188). The high dissolution at pH 8.5 (compared to pH 6) was attributed to the higher binding capacity of the capping ligand, PAA, for Cd ions at that pH, which supported increased dissolution of the QD. Overall, non-neutral pH media increases the dissolution of QDs, in particular Cd-based QDs (168).
As QDs dissolve their size decreases, further promoting dissolution in aqueous media. For instance, the solubility product (Ksp) of CdS increased from 7.9 × 10⁻²⁷ to 1 × 10⁻¹⁵ when the diameter decreased from 25 nm to 2.5 nm (195). Slow dissolution of QDs in high ionic strength media (like seawater) implies that pelagic organisms will be initially exposed in marine systems mainly based on the nanoparticles’ colloidal stability. Gradual dissolution and sedimentation will lead to eventual exposure of benthic organisms. In contrast, in freshwater systems, relatively rapid dissolution will lead to exposure of both pelagic and benthic organisms to dissolved ions.
And as discussed in this section, the role of important QD properties (such as coating, composition, and size) and environmental factors (such as light, ionic strength, and pH) on the dissolution of prepared metallic QDs in aquatic systems has received some attention. However, only a few studies have probed leaching of metals from final products enabled with metallic QDs (such as Kindle Fire tablet and Samsung TV), with the few studies reporting minimal leaching of the metals. QDs may also be attached to polymer fragments when released into the environment (171); yet, the influence of the attached polymer matrice on QD dissolution has not been studied.
3.2. Agglomeration
Agglomeration, the clustering of two or more nanoparticles, is important to the colloidal stability of metallic and nonmetallic QDs. The agglomeration rate of QDs increases as the nanoparticle concentration increases in aqueous solutions (202). Like other nanoparticles (203–205), increase in ionic strength of aqueous media also favors homo-agglomeration of QDs (169, 202, 206, 207). Using increase in optical density at 650 nm as an indicator of agglomeration, Morelli et al. observed a faster agglomeration of uncapped CdSe and CdSe/ZnS QDs in raw seawater (salinity = 38.3‰) compared to a water sample with a lower salinity (salinity = 7.7‰)(202). Similar observations have been made by other researchers that compared the agglomeration kinetics of QDs in DI water or low salinity water and seawater (189, 207).
Agglomeration of QDs in high ionic strength media is due to the compression of the electrical double layer around the nanoparticles, leading to decreases in electrostatic repulsive forces as predicted by the classical Derjaguin–Landau–Verwey–Overbeek (DLVO) theory (207–211). Thus, higher agglomeration rates are observed in aqueous media with elevated ion contents and high fractions of multivalent ions, such as seawater (207–211). The colloidal stability of QDs in aqueous systems is improved with the use of charged or neutral capping agents, which impart electrostatic or steric repulsion, respectively (188, 206, 209). Plain carbon QDs agglomerated to over 500 nm when suspended in 100 mM NaCl but remained monodispersed at a diameter of only 2 nm when capped with polyethylenimine ethylenediamine (PEI). However, surface coatings may be unable to prevent agglomeration of Cd-based QDs in high ionic strength waters (such as seawater). The average hydrodynamic diameter of amine- and carboxyl-capped CdSe QD was similar to that of the unfunctionalized QDs when introduced to seawater, showing that surface modification did not improve colloidal stability in seawater (169, 207). Similarly, in another study, carboxylic acid- and PDDA-stabilized CdSe/ZnS QDs rapidly agglomerated in seawater to sizes greater than 1 μm within one hour (189). The sizes of both nanoparticles (carboxylic acid- and PDDA-stabilized CdSe/ZnS QDs) were only about 20 nm and 500 nm in 0‰ and 1‰ media, respectively, after the same time (189).
Humic acid caused further agglomeration of CdSe/ZnS in seawater (compared to when it was absent), although the increase in agglomeration rate was more pronounced for PDDA-coated CdSe/ZnS than for the carboxylic acid-coated ones (189). The impact of humic acid on QD agglomeration in seawater was related to bridging effects (i.e., linking the humic acid, divalent cation in seawater, and capping agents of the QDs) (189). Similarly, the hydrodynamic diameter of uncapped and amine-functionalized carbon QDs increased substantially in the presence of humic acid. More so, interactions between EPS derived from marine algae and CdSe QDs resulted in the formation of very large agglomerates in seawater (169).
In addition, pH affects the surface charge (zeta potential) of QDs, thereby influencing their colloidal stability in aqueous media (207, 208, 211). Often times, pH, ionic strength, and capping agents, all of which have strong influences on the surface charge of nanoparticles, combine to determine the agglomeration of QDs in aquatic systems (207, 208). As an example, the isoelectric point of carboxylic acid-coated CdTe QDs was ~pH 1.7 in DI water, but increased to ~pH 10.5 in seawater, probably due to the adsorption of cations in seawater (207). As a result, although the carboxylic acid-capped CdTe QDs agglomerated at all pHs tested, the largest agglomerates were observed around pH 10. Conversely, and expectedly, the largest agglomerates in DI water were observed around pH 2, with minimal agglomeration above pH 2 in DI water.
Rapid homo-agglomeration of QDs in high ionic strength conditions implies that sedimentation of the nanoparticles will be a dominant process in marine systems. Despite slower agglomeration in low ionic strength media, almost 68% of carboxylic acid-capped CdTe QDs sedimented after 24 hours in DI water (sedimentation was about 92% in seawater after 24 hours.) (207). In simulated laboratory studies of marine systems, the estimated settling rate of Cd QD was 4–10 mm/day (189). These settling rates do not take into account environmental processes such as advection, upwelling, and resuspension. Unlike Cd-based QDs, agglomeration of carbon-based QDs in DI water is slow and did not result in observable sedimentation over time (211–213). Thus, relatively fast sedimentation of Cd-based QDs in water, regardless of ionic strength, may be due to the higher density of the metallic QDs in addition to their increased particle size. Hetero-agglomeration between QDs and suspended geogenic and biogenic materials will likely be important due to the abundance of colloids (such as suspended particles, bacteria, etc.) in natural water (203, 210). Hetero-agglomeration will increase the settling rates of QDs in natural waters (203, 210). There are currently no studies on the hetero-agglomeration of QDs and other geogenic and biogenic materials in natural waters.
3.3. Transformation
The main transformation of Cd-based QDs in the environment is their dissolution (and accompanying structural degradation), which occurs by combined effects of light, water, and oxygen. In addition, the oxidation of both the core and shell of CdSe/ZnS QDs occurred when illuminated in humid oxygenated environments (214, 215). The oxidation of CdSe/ZnS in the low moisture conditions led to formation of CdO and ZnO by the core and shell materials, respectively; and the loss of Se, which was likely photo-oxidized to gaseous selenium dioxide (215). While the ZnS shell of Cd-based QDs is not degraded by oxygen, it is not impermeable to oxygen (214, 216). Oxidation of ZnS in a humid oxygenated system may have occurred due to reaction with peroxides formed by oxygen radical anion, which demonstrates that ZnS shells are also affected by oxygenation processes (215, 217).
Carbon QDs absorb solar irradiation within the range of that reaching the earth’s surface (212). Rapid photo-bleaching of carbon QDs (i.e., loss of the unique fluorescence signature) will occur when irradiated by sunlight reaching the surface of natural waters. Depending on the precursor and synthesis method of the carbon QD, exposure to natural sunlight may lead to extensive (218) or minor structural decomposition in the short term (212). Carbon QDs that are structurally stable after photo-bleaching will persist in the aqueous phase of natural waters and be difficult to detect due to the loss of their fluorescent signature (212). Eventual decomposition of structurally stable carbon QDs will occur (in the order of decades) from reactions with hydroxyl radicals produced by solar irradiation of natural water constituents such as NOM and nitrate (212). Some of the byproducts of the reactions between hydroxyl radical and carbon QDs could persist for several decades, and their toxicity is not well understood.
3.4. Relating QD environmental fate to exposure and adverse effects
Dissolution, agglomeration and transformations are the primary processes affecting QD environmental fate. In turn, these processes also affect what organisms will experience when confronted by QDs in the environment. The majority of available data for these processes addresses Cd-based QDs. For Cd-based and other metallic QDs, dissolution will drive the bioavilability of and exposure to toxic metals, like Cd2+, to organisms. Next, agglomeration of QDs in high ionic strength media decreases the overall surface area of the particles exposed to light and water, which likely plays a role in the decreased dissolution of QDs in seawater (169). Agglomeration also decreases the bioavailability of QDs in seawater since fewer particles will be sufficiently small to passively move through the cell membranes or pass the digestive walls into tissues of organisms. Consequently, the long-term fate of Cd-based QDs in marine systems is the benthic zone, and benthic organisms will likely be exposed to particulate QDs, which will slowly leach Cd ions over time (189). The presence of inorganic shell and surface capping agents improves the colloidal and structural stability of QDs in freshwater systems (Figure 5), but the impact of these surface modifications is minimal in seawater. In contrast, QDs will dissolve faster in freshwater systems (than seawater) as they slowly settle out to the benthic zone. Therefore, considerable exposure of pelagic and benthic organisms to both Cd QDs and their ions is expected in freshwater systems. Unlike metal-based QDs, carbon-based QDs have a higher colloidal stability in aquatic systems due to their strong surface charge and low density. Depending on their structure, carbon QDs may be rapidly decomposed by sunlight or persist in water for decades. In turbid natural waters where sunlight penetrates inefficiently, carbon QDs might be expected to linger for decades. There are currently no studies on the agglomeration and sedimentation of carbon and graphene QDs in natural waters, but a study of graphene oxide (GO) predicts that it will take almost two years for them to settle out of the euphotic zone of natural seawater (219). On the other hand, fullerene initially (1 – 3 weeks) rapidly sedimented in lake waters due to the formation of fullerene-dissolved NOM hetero-agglomerates, after which settling was slow for several months (220). Thus, depending on the behavior of carbon-based QDs in natural waters, pelagic organisms may be exposed to more persistent carbon-based QDs for a long time
Figure 5.

Illustration of typical QD characteristics including (a) agglomeration and colloidal stability, (b) structure, and (c) effects of environmental conditions (i.e., pristine and weathered) on the dissolution of the QD core releasing cadmium ions. The depicted QDs are composed of cadmium-selenide (CdSe) nanocrystal cores and zinc-sulfide (ZnS) shells.
4. ENVIRONMENTAL EFFECTS
4.1. Availability of adverse effects data for QDs
As the emerging concern for engineered nanoparticles grows, the ecotoxicological and environmental risk assessment data for QDs is limited compared to other nanoparticles (221). The majority of ecological and environmental toxicity studies have focused on Cd and other metal based QDs with far fewer studies investigating the adverse effects of newer carbon, graphene, and silicon QDs. The discrepancy between metal and carbon-based QD studies is likely due to the more recent trend to manufacture and utilize carbon-based QDs that are presumably less toxic than metal QDs. We include the available information regarding the toxicity of both carbon-based and heavy metal-based QDs. Additionally, most ecological studies evaluate the effects of QDs using sublethal endpoints (effect concentration 50% (EC50)) which are more sensitive for assessing risk particularly for chronic and subchronic exposures, rather than acute (typically 24– 96 hour exposures) or lethal endpoints (lethal dose 50% (LD50) or lethal concentration 50% (LC50). The majority of these studies are laboratory-based and use QD concentrations that are unrealistically high for likely environmental exposures (see previous discussion in Section 2). Studies using higher QD concentrations are useful for predicting the adverse effects of highly contaminated areas, and these are likely extreme scenarios. In addition, dose response studies should be balanced with chronic studies, both of which are lacking in the current literature. Despite the differences in likely environmental exposure and toxicity assessments, overall, there is a range of information on the mode of toxicity and non-target, sublethal effects of many types of QDs on both simple (prokaryotic) and advanced (eukaryotic) organisms (Tables 2 and 3).
Table 2.
Median lethal concentration values (LC50) of QDs and equivalent core material concentrations in aquatic species from published studies.
| Type of Quantum Dot | Organism | Life Stage | Exposure time | Exposure Conditions | QD LC50 (mg/L) | Equivalent core material concentration (mg/L) | Reference |
|---|---|---|---|---|---|---|---|
| CdS-GSH | Mussel (Mytilus galloprovincialis) | Hemocytes | 24 hr | in vitro exposure | - | 9.761 | Katsumiti et al, 2014 |
| CdS-GSH | Mussel (Mytilus galloprovincialis) | Gill cells | 24 hr | in vitro exposure | - | 9.213 | Katsumiti et al, 2014 |
| CdSe | Algae (Pseudokirchneriella subcapitata) | - | 96 hr | 25°C; continuous light | 0.0371 | 9.638 | Bouldin et al., 2008 |
| CdSe/ZnS | Daphnia pulex | Juvenile (5–7 days) | 48 hr | 20°C; 16:8hr L:D | 1.13nM | 0.168617 | Tang et al., 2015 |
| CdSe/ZnSe-GA/TOPO | Daphnia Magna | Neonates (<24 hr) | 48 hr | 21 ± 1°C; static exposure renewed at 48 hr; UV-B light | - | 51.1 | Lee et al. 2010 |
| CdSe/ZnSe-GA/TOPO | Daphnia Magna | Neonates (<24 hr) | 48 hr | 21 ± 1°C; static exposure renewed at 48 hr; full sunlight | - | 11.2 | Lee et al. 2010 |
| CdSe/ZnSe-GA/TOPO | Daphnia Magna | Neonates (<24 hr) | 96 hr | 21 ± 1°C; static exposure renewed at 48 hr; UV-B light | - | 7.7 | Lee et al. 2010 |
| CdSe/ZnSe-GA/TOPO | Daphnia Magna | Neonates (<24 hr) | 96 hr | 21 ± 1°C; static exposure renewed at 48 hr; full sunlight | - | 1.4 | Lee et al. 2010 |
| CdSe/ZnSe-MPA | Daphnia Magna | Neonates (<24 hr) | 48 hr | 21 ± 1°C; static exposure renewed at 48 hr; UV-B light | - | 391.7 | Lee et al. 2010 |
| CdSe/ZnSe-MPA | Daphnia Magna | Neonates (<24 hr) | 48 hr | 21 ± 1°C; static exposure renewed at 48 hr; full sunlight | - | 384.5 | Lee et al. 2010 |
| CdSe/ZnSe-MPA | Daphnia Magna | Neonates (<24 hr) | 96 hr | 21 ± 1°C; static exposure renewed at 48 hr; UV-B light | - | 55.8 | Lee et al. 2010 |
| CdSe/ZnSe-MPA | Daphnia Magna | Neonates (<24 hr) | 96 hr | 21 ± 1°C; static exposure renewed at 48 hr; full sunlight | - | 28.1 | Lee et al. 2010 |
| CdSe/ZnS- PMAO | Daphnia magna | neonates | 24 hr | 22± 1°C; 16:8 hr L:D | 3.1 nM | 0.244 | Lewinski et al., 2010 |
| CdSe/ZnS-MUA | Daphnia magna | neonates | 48 hr | 20± 2°C; 16:8 hr L:D; 5 nm diameter red QDs | 0.11 | 0.09 | Pace et al., 2010 |
| CdSe/ZnS-MUA | Daphnia magna | neonates | 48 hr | 20± 2°C; 16:8 hr L:D; 2 nm diameter green QDs | 0.35 | 0.27 | Pace et al., 2010 |
| CdSe/ZnS-PEG-COO- | Zebrafish (Danio rerio) | Embryo 4–6 hr; | 120 hr | 28°C; static exposure renewed every 24 hr | 22.44 | 3.147508 | King-Heiden et al., 2009 |
| CdSe/ZnS-PEG-NH2 | Zebrafish (Danio rerio) | Embryo 4–6 hr; | 120 hr | 28°C; static exposure renewed every 24 hr | 15.71 | 2.360631 | King-Heiden et al., 2009 |
| CdSe/ZnS-PEG-OCH3 | Zebrafish (Danio rerio) | Embryo 4–6 hpf | 120 hr | 28°C; static exposure renewed every 24 hr | 33.66 | 4.721262 | King-Heiden et al., 2009 |
| CdSe/ZnS-PEO | Daphnia magna | neonates | 48 hr | 20± 2°C; 16:8 hr L:D; 2 nm diameter green QDs | 0.77 | 0.12 | Pace et al., 2010 |
| CdSe/ZnS-PEO | Daphnia magna | neonates | 48 hr | 20± 2°C; 16:8 hr L:D; 5 nm diameter red QDs | 3.84 | 1.46 | Pace et al., 2010 |
| CdSe/ZnS-PLL | Zebrafish (Danio rerio) | Embryo 4–6 hr; | 120 hr | 28°C; static exposure renewed every 24 hr | 3.3079 | 0.786877 | King-Heiden et al., 2009 |
| CdSe-COOH | Amerimysis bahia | 48 hr old | 48 hr | 20°C; 16:8-hr light dark; 7-day aged QDs | 0.74 | 0.057 | Xiao et al., 2017 |
| CdSe-COOH | Amerimysis bahia | 48 hr old | 96 hr | 20°C; 16:8 hr L:D; 7-day aged QDs | 0.29 | 0.023 | Xiao et al., 2017 |
| CdSe-COOH | Amerimysis bahia | 48 hr old | 7 day | 20°C; 16:8 hr L:D; 7-day aged QDs | 0.29 | 0.023 | Xiao et al., 2017 |
| CdSe-MPA | Zebrafish (Danio rerio) | Embryos 6 hpf | 120 hr | 28 ± 0.5°C; 14:10 hr L:D | 1.98 | - | Zhang et al., 2012b |
| CdTe | Daphnia pulex | Juvenile (5–7 days) | 48 hr | 20°C; 16:8 hr L:D | 3.29nM | 0.112411 | Tang et al., 2015 |
| CdTe | Freshwater polyp (Hydra vulgaris) | 3 wks old with 1–2 buds | 24 hr | 18°C; 12:12 hr L:D; pH 7 | - | 1.4 | Ambrosone et al., 2012 |
| CdTe | Freshwater polyp (Hydra vulgaris) | 3 wks old with 1–2 buds | 48 hr | 18°C; 12:12 hr L:D; pH 7 | - | 1.1 | Ambrosone et al., 2012 |
| CdTe | Freshwater polyp (Hydra vulgaris) | 3 wks old with 1–2 buds | 72 hr | 18°C; 12:12 hr L:D; pH 7 | - | 0.72 | Ambrosone et al., 2012 |
| CQDa | Daphnia magna | Neonates | 48 hr | 25 ± 2 °C | 160.3 | - | Yao et al., 2018 |
| CQDa | Phytoplankton (Scenedesmus obliquus) | - | 96 hr | 25 ± 2 °C; 12:12 hr L:D | 74.8 | - | Yao et al., 2018 |
| CQDa | Zebrafish (Danio rerio) | Adults | 96 hr | 25 ± 2 °C | 97.5 | - | Yao et al., 2018 |
| Silicon QD | Zebrafish (Danio rerio) | embryos (26 hpf) | 120 hr | 28 °C | 40 | - | Srivastava et al., 2019 |
GSH= glutathione, GA= gum arabic, TOPO= tri-n-octylphosphine oxide, PMAO= polyanionic polymaleic anhydride-alt-1-octadecene, MUA= mercaptoundecanoic acid, PEG= polyethylene glycol, PEO= polyethylene oxide, PLL= poly-l-lysine, COOH= carboxylic acid, MPA= 3-mercaptopropyltrimethoxysilane, MPA= mercaptopropionic acid
Carbon Quantum Dot
Table 3.
Summary of sublethal adverse effects of metal and non-metal QDs on prokaryotic and eukaryotic terrestrial and aquatic organisms including lowest observed effect concentrations (LOECs) from published studies.
| Type of Quantum Dot | Capping Agent or Surface Modification | Organism | Life Stage or Tissue | Exposure Conditions | Effect | Effect Concentration | Concentration Range | Cause of effect | Citation |
|---|---|---|---|---|---|---|---|---|---|
| Cadmium-based QDs | |||||||||
| CdS | - | Bakers’ yeast (Saccharomyces cerevisiae) | strain BY4742 | 28°C | Oxidative stress; increased ROS; decreased GSH; decreased respiratory cytochromes; mitochondrial dysfunction and disrupted morphology | 75 mg/L QD | 75– 150 mg/L QD | Cadmium ion | Pasquali et al., 2017 |
| CdS | MPEG-SH | Blue mussel (Mytilus edulis) | hemocytes | 15°C; 4 hr exposure | Increased genotoxicity and double strand breaks | 10 mg/L QD | 0.1–10 mg/L QD | Ions and Particles | Munari et al., 2014 |
| CdS | GSH | Clam (Scrobicularia plana) | Adults (2.7±0.5 g wet wt) | 15°C; 24 hr dark; 14-day static exposure and daily renewal | Impaired foot movement (behavior); accumulation of Cd in clam tissue; increased CAT, SOD, and GST activity; increased CSP-3-like (caspase) activity | 10 ug Cd/L | - | Ions and Particles | Buffet et al., 2015 |
| CdS | - | Daphnid (Daphnia magna) |
Neonates (<24h old) | 20 ± 2°C and 16:8 hr L:D; QDs weathered for 24hr in sunlight; 48h static exposure | Increased immobilization post UV exposure | 0.376 mg/L | 0.38–1 mg/L | Cadmium ion | Silva et al. 2016 |
| CdS | GSH | Mussel (Mytilus galloprovincialis) | Hemocytes and gill cell | 24 hr in vitro exposure: 18°C | Reduced cell viability; oxidative stress through increased ROS, increased DNA damage; Increased lysosomal acid phosphatase and multixenobiotic resistance activity; increased internalization of QD into hemocytes; gill cells more sensitive than hemocytes | 1 mg Cd/L, hemocytes; 5 mg Cd/L gill cells | 0.001–100 mg Cd/L | Cadmium ion | Katsumiti et al, 2014 |
| CdS | TOPO | Soybeans (Glycine max) | 11 d seedlings | 24°C and 16:8 hr L:D; 30% humidity; 14 day exposure | Altered metabolism; Downregulation of GSH pathways; Upregulation of amino acid biosynthesis, tricarboxylic acid cycle, and glycolysis pathways | 200 μg/mL vermiculite | - | Particles | Majumdar et al 2019 |
| CdS | PVP | Soybeans (Glycine max) | 11 d seedlings | 24°C and 16:8 hr L:D; 30% humidity; 14 day exposure | Altered metabolism; Downregulation of GSH pathways; Upregulation of amino acid biosynthesis, tricarboxylic acid cycle, and glycolysis pathways | 200 μg/mL vermiculite | - | Particles | Majumdar et al 2019 |
| CdS | MAA | Soybeans (Glycine max) | 11 d seedlings | 24°C and 16:8 hr L:D; 30% humidity; 14 day exposure | Altered metabolism; Downregulation of GSH pathways; Upregulation of amino acid biosynthesis, tricarboxylic acid cycle, and glycolysis pathways | 200 μg/mL vermiculite | - | Particles | Majumdar et al 2019 |
| CdS | GLY | Soybeans (Glycine max) | 11 d seedlings | 24°C and 16:8 hr L:D; 30% humidity; 14 day exposure | Altered metabolism; Downregulation of GSH pathways; Upregulation of amino acid biosynthesis, tricarboxylic acid cycle, and glycolysis pathways | 200 μg/mL vermiculite | - | Particles | Majumdar et al 2019 |
| CdS/ CdTe | COOH | Mussel (Elliptio complanata) | Adult mussel hemolymph | 15°C; 21 h exposure; QD allowed to aggregate and size fractionated | Increased cytotoxicity; increased phagocytosis in large particles; stimulated immunoactivity | 0.42 μg/ mL | 0.18–2.7 ug/ ml Cd | Cadmium ions and aggregates | Bruneau et al., 2013 |
| CdS/ CdTe | COOH | Mussel (Mytilus edulis) | Adult mussel hemolymph | 15°C; 21 h exposure; QD allowed to aggregate and size fractionated | Increased cytotoxicity; reduced phagocytosis in small particles and increased phagocytosis in large particles; stimulated immunoactivity | 0.86 μg/mL | 0.18–2.7 ug/ ml Cd | Cadmium ions and nanoparticles | Bruneau et al., 2013 |
| CdS/ CdTe | COOH | Rainbow trout (Oncorhynchus mykiss) | Fish leukocytes | Harvested from head kidney tissues; 21 hr exposure; QD allowed to aggregate and size fractionated | Decreased cell viability; increased phagocytosis in multiple particle sizes; increased immunoactivity and phagocytic efficiency | 0.43ug/mL Cd | 0.18–2.7 ug/ ml Cd | Cadmium ions and aggregates | Bruneau et al., 2013 |
| CdSe | PMAO or PEI | Bacillus subtilis | - | 37°C; 48 hr exposure | Increased mortality | 40 nM QD | 10 mg/L; 1g/L Cd | Metal ions | Mahendra et al., 2008 |
| CdSe | PMAO or PEI | Escherichia coli | - | 37°C; 48 hr exposure | Reduced growth | >40 nM QD | 10 mg/L; 1g/L Cd | Metal ions | Mahendra et al., 2008 |
| CdSe | MPS | Pseudomonas aeruginosa | - | 30°C; pH 7.4; 24 hr dark; 24 hr exposure | Reduced growth; increased mortality; ROS formation; QD internalization | 10 mg/L Cd | 10–125 mg/L Cd | Metal ions and particles | Priester et al., 2009 |
| CdSe | PSMA | Diatom (Phaeodactylum tricornutum) | - | 21 ± 1°C; 16:8 hr L:D; seawater; 5 hr and 3-day exposures | Increased Cd release and internalization with increased salinity; Increased phytochelatins | 0.5nM QD (240nM Cd equivalent) | 0.4–1nM QD (20–480nM Cd equivalent) | Cadmium Ion | Morelli et al, 2012 |
| CdSe | - | Protozoa (Tetrahymena thermophila) | - | 30°C; QD-exposed bacteria prey; 24 hr exposure | Impaired growth and movement; oxidative damage; reduced digestion; low QD degradation after trophic transfer; cadmium biomagnification | 3.311 ± 152 mg/L Cd in prey bacteria | Cadmium ions | Werlin et al., 2011 | |
| CdSe/ZnS | - | Bacillus subtilis | 37°C; 48 hr exposure with weathered QDs | Reduced growth and increased mortality from weathered QDs | 10 nM QD | 10 mg/L; 1g/L Cd | Metal ions | Mahendra et al., 2008 | |
| CdSe/ZnS | - | Escherichia coli | - | 37°C; 48 hr exposure with weathered QDs | Reduced growth and increased mortality from weathered QDs | 10 nM QD | 10 mg/L; 1g/L Cd | Metal ions | Mahendra et al., 2008 |
| CdSe/ZnS | PSMA | Diatom (Phaeodactylum tricornutum) | - | 21 ± 1°C; 16:8 hr L:D; seawater; 5 hr and 3-day exposures | Decreased growth rates; increased phytochelatins and ROS; increased SOD and CAT activity; Increased Cd release with increased salinity | 0.5nM QD (240nM Cd equivalent) | 0.4–1nM QD (20–480nM Cd equivalent) | Cadmium ion and nanoparticle | Morelli et al, 2012 |
| CdSe/ZnS | PSMA | Marine Diatom (Phaeodactylum tricornutum) | - | 21 ±1°C; 16:8 hr L:D; seawater: 7–8 days exposure | Decreased growth rate; growth inhibition; significant protein profile using SELDI-TOF-MS biomarker detection | 2.5 nM QD | - | Ions and Particles | Scebba et al., 2016 |
| CdSe/ZnS | MSA | Caenorhabditis elegans | Adults | 15°C; 6-day exposure | Impaired reproduction and fecundity; higher embryo mortality; prematurely laid embryos; higher frequency of phenotypic deformity; reduced life span | 0.10uM | 0.01–1 μM QD | Nanoparticles | Hsu et al., 2012 |
| CdSe/ZnS | PEG, NH2, or COOH | Ceriodaphnia dubia | Adult (>72 hr) | 24 ±1°C; 24 hr dark; 24 hr static exposure; 24 hr depuration | Higher levels of QD-COOH retained after depuration; QDs crossed interstitial barrier | 8 nM QD | - | Nanoparticles | Feswick et al., 2013 |
| CdSe/ZnS | MUA | Daphnia Magna | 36 hr exposure; 3 nm green QDs | QDs localized to gut and intestines; QDs did not dissolve; QDs may have aggregated in exposure media prior to ingestion | 15 nmol/L QD | Particles | Jackson et al., 2009 | ||
| CdSe/ZnS | MUA | Daphnia Magna | - | 36 hr exposure; 6 nm red QDs | QDs localized to gut and intestines; QDs did not dissolute; QDs may have aggregated in exposure media prior to ingestion | 15 nmol/L QD | Particles | Jackson et al., 2009 | |
| CdSe/ZnS | PEG, NH2, or COOH | Daphnia magna | Adult (>72 hr) | 24 ±1°C; 24 hr dark; 24 hr static exposure followed by 24 hr depuration | Internalization of QDs (QD body burdens order COOH>NH2>PEG); QDs crossed interstitial barrier | 8 nM QD | - | Nanoparticles | Feswick et al., 2013 |
| CdSe/ZnS | PAA, PMAO, PEG | Daphnia magna | neaonate | 22± 1°C; 16:8 hr L:D; pH 7.2–7.6; 24 hr exposure; 48 hr depuration | Increased mortality; incomplete gut clearance during depuration; increased QD retention with feeding; cadmium and nanoparticle accumulation | 7.7 nM QD (0.6 ppm Cd) | - | Nanoparticles | Lewinski et al., 2010 |
| CdSe/ZnS | GA | Daphnia Magna | Juvenile (4–6d) | 20 ± 1°C; 16:8 hr L:D; 48 hr static exposure; UV-B irradiation | Decreased survival; increased ROS production; increased Cd2+ release with UV-B irradiation | 30 ug/L QD | 0, 0.95, 3, 9.5, 30, and 94.9ug/L QDs | Cadmium ion | Kim et al., 2010 |
| CdSe/ZnS | MPA | Daphnia Magna | Juvenile (4–6d) | 20 ± 1°C; 16:8 hr L:D; 48 hr static exposure; UV-B irradiation | Decreased vitellogenin expression with UV-B; increased Cd2+ release with UV-B irradiation | 3 ug/L QD | 0, 0.95, 3, 9.5, 30, and 94.9ug/L QDs | Cadmium ion | Kim et al., 2010 |
| CdSe/ZnS | MPA | Alfalfa (Medicago sativa) | Cells | 24°C; 24 hr dark | Increased SOD, catalase, and glutathione reductase activity; increased single and double strand breaks; upregulation of DNA repair enzymes and antioxidant defense genes | 10 nM QD | 10, 50 and 100 nM QD | Particles | Santos et al., 2013 |
| CdSe/ZnS | COOH | Plant (Arabidopsis thaliana) | Rosette production stage (3–4 weeks) | Hoaglands solution; 27 ± 2°C; 16:8 hr L:D; pH 6.0; 1–7 day exposures; humic acid co-exposure | Intact QDs absorbed into root cell wall (no internalized QDs); cadmium ion internalized into cells; increased oxidative stress through decreased GSH in treatment with humic acids | 5.8 nM QD (5 ug/mL Cd) | - | Cadmium ions | Navarro et al., 2012 |
| CdSe/ZnS | PEG-COO− | Rainbow Trout (Oncorhynchus mykiss) | Embryos (eyed egg stage) | 10 ± 0.5°C; pH 8.0; 24 hr dark; 14-day static exposure | Increased mortality; increased gill ventilation frequency; increased heart rate; decreased behavioral responses; increased developmental malformations; QD localized in the gills/head | 4 × 10⁻⁹ mol/L QD | - | Ions and Particles | Jurgelėnė et al., 2018 |
| CdSe/ZnS | - | Atlantic Killifish (Fundulus heteroclitus) | Adults | 20°C; 16:8 hr L:D; 20 ± 2ppt salinity; static; fed 2x daily QD discs; 85-day exposure | Maternal transfer of Cd into eggs; increased male expression of vitellogenin; impaired fecundity; cadmium accumulation in liver | 10 ug QD/ day | 1–10 ug QD/ day | Ions | Blickley et al., 2014 |
| CdSeS/ZnS | COOH | Bacteria (Vibrio fischeri) | - | QDs weathered for 24 hr in sunlight; 30 min exposure | EC20 of bioluminescence inhibition for 30 min exposure pre and post UV exposure | 0.293 mg/L (pre), 0.012 mg /L (post) | QDs 0.209–0.75 mg/L | Cadmium ion | Silva et al. 2016 |
| CdSeS/ZnS | COOH | Green Algae (Chlorella vulgaris) | - | 20 ± 3°C; 16:8 hr L:D; QDs weathered for 24 hr in sunlight; 48 hr static exposure | Reduced growth rate | 0.251 ug/L | QDs 0.209–0.75 mg/L | Cadmium ion | Silva et al. 2016 |
| CdSeS/ZnS | COOH | Microalgae (Raphidocelis subcapitata) | - | 20 ± 3°C; 16:8 hr L:D; QDs weathered for 24 hr in sunlight; 48 hr static exposure | Reduced growth rate | 0.625 mg/L | 0.209–0.75 mg/L | Cadmium ion | Silva et al. 2016 |
| CdSeS/ZnS | COOH | Crustacean (Daphnia magna) | Neonates (<24h old) | 20 ± 2°C; 16:8 hr L:D; QDs weathered for 24 hr in sunlight; 48 hr static exposure | Increased immobilization post UV exposure | 0.263 mg/L EC20 (pre), 0.526 mg/L EC20 (post), | 0.282 to 0.75 mg/L | Cadmium ion | Silva et al. 2016 |
| CdSe/CdZnS | PAA-EG | Arabidopsis thaliana | - | 23°C; 12:12 hr L:D; 75% humidity | Leaf chlorosis; QD translocation to leaves | 10 μg/mL | - | Ions and particles | Koo et al., 2015 |
| CdSe/CdZnS | PEI | Arabidopsis thaliana | - | 23°C; 12:12 hr L:D; 75% humidity | Leaf chlorosis; decreased leaf size; QD translocation to leaves | 10 μg/mL | - | Ions and particles | Koo et al., 2015 |
| CdSe/CdZnS | PAA-EG | Caterpillar (Trichoplusia ni) | Newly hatched | 23°C; 24 hr continuous light; 50% humidity; 7-day exposure | Reduced weight gain; trophic transfer of QDs | 10 μg/mL | - | Ions and particles | Koo et al., 2015 |
| CdSe/CdZnS | PEI | Caterpillar (Trichoplusia ni) | Newly hatched | 23°C; 24 hr continuous light; 50% humidity; 7-day exposure | Reduced weight gain; trophic transfer of QDs | 10 μg/mL | - | Ions and particles | Koo et al., 2015 |
| CdTe | TGA | Diatom (Phaeodactylum tricornutum) | Inoculated fresh stock | 21 ± 1°C; pH 7.5; seawater; 6-day exposure | Decreased growth rate; internalization of QDs; increased Cd internal concentration | 200 ng/mL Cd | 100–300 ng/mL Cd | Cadmium Ion | Xu et al., 2010 |
| CdTe | COOH | Protozoan (Paramecium caudatum) | - | 22°C; 24 hr D; 24–72 hr exposure | Bioaccumulation of QDs; biomagnification of QDs through trophic transfer (BMF= 1.1–1.4); decreased bacterial grazing ability with increasing exposure; decreased reproductive potential; decreased growth rate | 25 mg/L | 25–75 mg/L | Particles | Gupta et al., 2017 |
| CdTe | TGA | Freshwater polyp (Hydra vulgaris) | 3 wks old with 1–2 buds | 18°C; 12:12 hr L:D; pH 7; 24, 48, and 72 hr exposures | Impaired reproduction (budding rate); impaired regenerative capability; decreased reproduction; decreased cell proliferation; increased apoptosis | 0.4 mg/L Cd | 1–100nM QD (0.04– 4.0 mg/L Cd) | Particles | Ambrosone et al., 2012 |
| CdTe | TGA | Freshwater mussel (Elliptio complanate) | Adults | 15°C; 24 hr static exposure | Altered Metallothionein concentrations in gill, digestive gland, and gonads; Accumulation of Cd in gills and digestive tissues | 1.6 mg/L Cd | 0– 8 mg Cd/L | Cadmium ion | Peyrot et al., 2009 |
| CdTe | TGA | Freshwater mussel (Elliption complanate) | Mature, 5–7cm shell length | 15°C; 8:16 hr L:D; Freshwater; static 24h exposure | Oxidative stress through ncreased LPO in gills; reduced phagocytic activity and hemocyte viability; genotoxicity through increased DNA strand breaks; increasing aggregation of QDs in FW | 1.6 mg/L | 1.6–8 mg/L | Cadmium ions and nanoparticles | Gagne et al., 2008 |
| CdTe | COOH | Mussel (Mytilus galloprovincialis) | Adults | 16.6°C; 12:12 hr L:D; 36‰ salinity; 14 day; static-renewal | Cd accumulation in gonads; decreased superoxide dismutase, catalase, and glutathione-S-transferase activity; increased glutathione peroxidase activity; metallothionein induction in females; increased lipid peroxidation | 10 μg/L QD | - | Cadmium ion and nanoparticle | Gonçalves et al. 2020 |
| CdTe | Ala and Gly | Domestic Silk Moth (Bombyx mori) | 48-h-old 5th instar | 25°C; 12:12 hr L:D; 70–90% humidity; Single 10 uL QD injection; 6–120 hr sampling time | Cytotoxicity, oxidative stress, and reproductive impairment; Increased ROS in gonads; Increased apoptosis and autophagy; decreased sperm production and quality; reduced fertilization rate; sex-specific toxicity differences | 0.32 nmol QD | 0.32–0.64 nmol QD | Ions and particles | Yan et al., 2016 |
| CdTe | GSH | Freshwater macrophyte (Lemna minor) | - | OECD test 221; 24 ± 2°C; pH 6.8 ± 0.1; 7-day exposure | Inhibited growth rate and biomass | 0.03 mg/L Cd | 0.01–15 mg/L | Cadmium ions | Modlitbová et al., 2018a |
| CdTe | MPA | Freshwater macrophyte (Lemna minor) | - | OECD test 221; 24 ± 2°C; pH 6.8 ± 0.1; 7-day exposure | Inhibited growth rate and biomass: cadmium bioaccumulation | 0.02 mg/L Cd | 0.01–15 mg/L | Cadmium ions | Modlitbová et al., 2018a |
| CdTe | - | Onion (Allium cepa) | 1–2 g bulbs | 22 ± 1°C; 15:9 hr L:D; 24 and 72 hr exposures | Lower root growth; cadmium dissolution and uptake in roots | 30 μm | 30–100 μm Cd | Cadmium ions | Modlitbová et al., 2018b |
| CdTe/ZnS | - | Onion (Allium cepa) | 1–2 g bulbs | 22 ± 1°C; 15:9 hr L:D; 24 and 72 hr exposures | Low particle dissolution and cadmium uptake; particles adsorbed on roots | >100 μm | 30–100 μm Cd | - | Modlitbová et al., 2018b |
| CdTe/CdS/ZnS | - | Onion (Allium cepa) | 1–2 g bulbs | 22 ± 1°C; 15:9 hr L:D; 24 and 72 hr exposures | Lower root growth; cadmium dissolution and uptake in roots | 30 μm | 30–100 μm Cd | Cadmium ions | Modlitbová et al., 2018b |
| CdTe | MPA | Wheat seedlings (Triticum aestivum) | 5 day old | 25°C; 8:16 hr L:D; 5-day exposure | Decreased root and shoot growth; increased lipid oxidation; increased MDA | 25 mg/L QD | 25–400 mg/L QD | Ions and particles | Chen et al., 2014 |
| CdTe | MPA | Wheat seedlings (Triticum aestivum) | 5 day old | 25°C; 8:16 hr L:D; UV-B radiation (10 KJ/m2/d); 5 day exposure | Inceased apoptosis and DNA damage; decreased chlorophyll a and b; increased ROS; increased SOD and dehydroascorbate activity; decreased CAT, ascorbate peroxidase, and glutahtione peroxidase activity; increased Cd accumulation in roots; reduced plant height and root length; increased release of Cd | 200 mg/L QD | - | Ions and particles | Chen et al., 2014 |
| CdTe/ CdS | COOH | Freshwater algae (Chlamydomonas reinhardtii) | - | 25 ± 1°C; 14:10 hr L:D; freshwater; 96 hr exposure | Reduced growth; synergistic effects with Cd ion co-exposure which increased cytotoxicity | 3.571 mg/L QD | 0.5–6 mg/L QD | Ions and particles | Yu et al., 2018 |
| CdTe/CdS | TGA | Diatom (Phaeodactylum tricornutum) | - | 21 ± 1°C; pH 7.5; seawater; 6-day exposure | Decreased growth rate; increased Cd internal concentration | 300 ng/mL Cd | 100–300 ng/mL Cd | Cadmium Ion | Xu et al., 2010 |
| CdTe/SiO2 | TGA | Diatom (Phaeodactylum tricornutum) | - | 21 ± 1°C; pH 7.5; seawater; 6-day exposure | Decreased growth rate; increased Cd internal concentration | 300 ng/mL Cd | 100–300 ng/mL Cd | Cadmium Ion | Xu et al., 2010 |
| CdTe/ZnS | TGA | Diatom (Phaeodactylum tricornutum) | - | 21 ± 1°C; pH 7.5; seawater; 6-day exposure | Increased Cd internal concentration | >300 ng/mL Cd | 100–300 ng/mL Cd | Cadmium Ion | Xu et al., 2010 |
| Non-metal QDs | |||||||||
| InZnP | GSH | Human | skin cells | 37°C; 24 hr exposure; UV weathered and pristine QDs | Increased mortality from weathered QDs; reduced cell proliferation; | >200 nM pristine QD | 6.25–200 nM Qd | Ions and secondary degradation products | Tarantini et al., 2019 |
| InZnP/ ZnS | PEN | Human | skin cells | 37°C; 24 hr exposure; UV weathered and pristine QDs | Increased mortality from weathered QDs; reduced cell proliferation; | 6.25 nM weathered QD; >200 nM pristine QD | 6.25–200 nM QD | Ions and secondary degradation products | Tarantini et al., 2019 |
| InZnP/ ZnS | GSH | Human | skin cells | 37°C; 24 hr exposure; UV weathered and pristine QDs | Increased mortality from weathered QDs; reduced cell proliferation; | 6.25 nM weathered QD; >200 nM pristine QD | 6.25–200 Nm QD | Ions and secondary degradation products | Tarantini et al., 2019 |
| InZnPS | PEN | Human | skin cells | 37°C; 24 hr exposure; UV weathered and pristine QDs | Increased mortality from weathered QDs; reduced cell proliferation; reduced metabolic activity | 12.5 nM weathered QD; 50 nM pristine QD | 6.25–200 Nm QD | Ions and secondary degradation products | Tarantini et al., 2019 |
| InZnPS | GSH | Human | skin cells | 37°C; 24 hr exposure; UV weathered and pristine QDs | Increased mortality from weathered QDs; reduced cell proliferation; | 12.5 nM weathered QD; >200 nM pristine QD | 6.25–200 nm QD | Ions and secondary degradation products | Tarantini et al., 2019 |
| InZnPS/ ZnS | PEN | Human | skin cells | 37°C; 24 hr exposure; UV weathered and pristine QDs | Increased mortality from weathered QDs; reduced cell proliferation; | 12.5 nM weathered QD; >200 nM pristine QD | 6.25–200 Nm QD | Ions and secondary degradation products | Tarantini et al., 2019 |
| InZnPS/ ZnS | GSH | Human | skin cells | 37°C; 24 hr exposure; UV weathered and pristine QDs | Increased mortality from weathered QDs; reduced cell proliferation; | 12.5 nM weathered QD; >200 nM pristine QD | 6.25–200 nM QD | Ions and secondary degradation products | Tarantini et al., 2019 |
| Silicon QD | sulfonate | Zebrafish (Danio rerio) | embryos (26 hpf) | 28°C; 120 hr exposure; co-exposure with 450 nm blue LED light for 6 hr |
Blue light increased silicon QD toxicity; increased malformation and mortality rate; | 40 mg/L | 10–50 mg/L QD | Srivastava et al., 2019 | |
| Carbon-based QDs | |||||||||
| CQDa | - | Phytoplankton (Scenedesmus obliquus) | - | 25 ± 2°C; 12:12 hr L:D; 24– 96 hr exposure | Oxidative stress and ROS formation; increased LPO and SOD activity; growth inhibition; reduced chlorophyll a | 50 mg/L QD | 5–500 mg/L QD | Yao et al., 2018 | |
| GOQDb | - | Green Algae (Chlorella vulgaris) | - | 24 ± 0.5°C; 24–96 hr exposure | Oxidative stress and ROS formation; increased SOD activity; increased cell permeability; reduced mitochondrial membrane potential; altered cell morphology; inhibited cell division; | 0.01 mg/L | 0.01–10 mg/L | Nanoparticles | Ouyang et al., 2015 |
| GQDc | - | Zebrafish (Danio rerio) | 4hpf | 28°C; 14:10 hr L:D; 7-day exposure | Upregulation of inflammatory and detoxifying genes; induction of AP-1 transcription factor for downstream regulation; activated acute inflammatory responses and redox signaling pathway; increased apoptosis | 25 ug/mL | 0–100 μg/mL | GQD particles | Deng et al., 2018 |
| GQDc | reduced | Zebrafish (Danio rerio) | Adult | 26 ± 0.5°C; 12:12 hr L:D; static exposure renewed daily; 7-day exposure; 14-day recovery | Increased DNA methylation in gill, liver, and intestines; increased DNA methylation in liver and intestine after recovery period | 2 mg/L QD | 2–50 mg/L QD | Particles | Hu et al., 2018 |
| GQDc | hydroxylated (OH) | Zebrafish (Danio rerio) | Adult | 26 ± 0.5°C; 12:12 hr L:D; static exposure renewed daily; 7-day exposure; 14-day recovery | Increased DNA methylation in gill, liver, and intestines | 2 mg/L QD | 2–50 mg/L QD | Particles | Hu et al., 2018 |
| GQDc | aminated (NH2) | Zebrafish (Danio rerio) | Adult | 26 ± 0.5°C; 12:12 hr L:D; static exposure renewed daily; 7-day exposure; 14-day recovery | Increased DNA methylation in gill, liver, and intestines; increased DNA methylation in liver and intestine after recovery period | 2 mg/L QD | 2–50 mg/L QD | Particles | Hu et al., 2018 |
MPEG-SH= Thiol-terminated methyl polyethylene glycol, GSH= glutathione, COOH= carboxylic acid, PMAO= polyanionic polymaleic anhydride-alt-1-octadecene, PEI= polycationic polyethylenimine, MPA= 3-mercaptopropyltrimethoxysilane, PSMA= poly(styrene-co-maleic anhydride), MPA= mercaptopropionic acid, MSA= mercaptosuccinic acid, PEG= polyethylene glycol, NH2= aminated, PAA= polyacrylic acid, EG= ethylene glycol, GA= gum arabic, TGA= thioglycolic acid, Ala= alanine, Gly = glycine, PEN= D-penicillamine
Carbon Quantum Dot,
Graphene Oxide Quantum Dot,
Graphene Quantum Dot
4.2. Routes of exposure
Once QDs enter the environment, the predicted primary routes of exposure are through oral and dermal pathways for animals and cell membrane for bacteria, cell walls for algae, and through root uptake in plants. As noted above, a unique quality of QDs compared to other contaminants is their fluorescence which is easily measured and is useful for detecting intact QDs in various media, including exposed organisms and their cells. Consequently, fluorescence detection is often used to quantify QD exposure and distribution in tissues in plants and aquatic organisms used in laboratory-based studies (105, 222). For example, via fluorescent imaging, Cd QDs were demonstrated to interact with the root system of plants with limited evidence of QD translocation into root tissue or transport into vascular tissues to shoots/leaves, particularly with varieties of QDs with shells (223–226). Both terrestrial and aquatic plants can easily uptake and accumulate cadmium ions released from QD dissolution into plant tissues to be transferred throughout food webs(226, 227). As fluorescent imaging only detects intact QDs, the routes of exposure for the core and shell materials of degraded QDs (i.e., ionic metals) are more challenging to measure and, consequently, difficult to assess.
4.3. Bioavailability
As our understanding of QD environmental exposure and fate has increased, appreciation of the environmental variables affecting QD bioavailability has improved. First, like some other nanoparticles (e.g., silver nanoparticles), the bioavailability of QDs can be characterized in two modes: 1) the entire QD nanoparticle itself and potential for the nanoparticle to interact with biological receptors, and 2) the degraded QDs and released core and shell materials such as metal ions (Figure 5). The bioavailability of both of these modes of QDs need to be considered when assessing the potential for the nanoparticle to interact with biological receptors. Both of these modes can be combined as the nanoparticle enters the organism allowing a more targeted and higher exposure of dissolved metal ions to occur closer to the receiving tissues (228, 229). The majority of ecotoxicological studies on QDs are performed under controlled laboratory conditions presumably due to the methodological difficulties associated with the recovery and quantification of QDs in the environment (see discussions in Sections 2 and 3). This is a characteristic that QDs share with other nanoparticles (e.g., single-walled carbon nanotubes, titanium dioxide) (230, 231). However, the conditions affecting bioavailability in actual ecological systems vary drastically from controlled laboratory settings. For example, Mahendra et al. (168) found degradation of QDs occurred at lower rates under neutral pH laboratory conditions compared to acidic (pH 4) or alkaline (pH 10) conditions.
In addition, any phenomena limiting the interaction of the QDs with an organism affects bioavailability. Therefore, the environmental variables discussed in the environmental fate section including nanoparticle agglomeration and sorption to NOM reduce the bioavailability of QDs through increased particle size, slowing degradation, and the resulting lower rates of metal ion dissolution (189, 232). Agglomeration can slow QD degradation processes, but can also increase the potential for QDs to be ingested by filter-feeding organisms. For example, many commercially important bivalves (e.g., oysters) filter particles in the 10 – 30 μm size range, and would not retain nanoscale QDs unless they were agglomerated into larger sizes (233). Overall, the shells of metallic QDs reduce and slow the release of cadmium and other metal ions from the core (Figure 5), but they do not perfectly encapsulate the core. Shells also limit the bioavailability of metal ions to organisms when the QDs are pristine, but after prolonged weathering in the environment the QDs degrade and eventually the core materials may become more bioavailable (189, 228).
4.4. Pristine and weathered QDs
Another approach for assessing the potential adverse effects of QDs is whether the nanoparticles are new (pristine) or weathered (transformed). Once QDs enter aquatic systems, the nanoparticles begin weathering which is driven by the processes discussed in Section 3 resulting in the release of core materials as well as development of a biofilm of naturally-occurring organic molecules and bacteria. Weathered QD solutions tend to be more acutely and sublethally toxic due to the release and increased bioavailability of ionized toxic metals. Despite the importance of weathering on QD behavior, few studies specifically assess the toxicity of weathered versus pristine QDs, and those that do often use bacteria as a model to compare acute toxicity thresholds. Bacteria are a model organism due to their ubiquitous nature and their importance in ecosystems including their interaction with environmental contaminants. A study using CdSe QDs with multiple organic surface coatings found that QDs weathered in acidic (pH < 4) or alkaline (pH 10) conditions resulted in higher bacterial mortality in Bacillus subtilis and E. coli (168). This effect was attributed to increased release of cadmium ions compared to exposure in normal laboratory solutions at a neutral pH (168). Low and high naturally occurring pH conditions are often found in reduced sediment environments and freshwater lakes, respectively. Irradiation and photolysis of QDs also significantly degrades nanoparticles and resulted in higher bacterial mortality (171). Even indium-based QDs, a non-cadmium variety, weathered under UV light caused significant bacterial cell mortality compared to pristine InP QDs which had almost no effect on cell survival (23).
4.5. Bioaccumulation/ biomagnification
While bioaccumulation and biomagnification are not adverse effects, these processes often need to occur before adverse effects take place in an organism. Although toxic metal-based QDs are not highly bioaccumulative, QDs can be transferred to higher trophic levels via prey consumption with internalized QDs leading to oral exposure through food chain (trophic) transfer and possible biomagnification a higher tropic levels largely dependent on environmental conditions and QD uptake in food sources (234, 235). Single-celled prokaryotes and eukaryotes, including bacteria, algae, and protozoans, are particularly susceptible to QD cell internalization and accumulation (236). A study detected ingested CdSe QDs present in the digestive tract of Cerodaphnia dubia that were fed microalgae exposed to CdSe QDs (222). Other studies found intact QDs nanoparticles were detected in the intestines and within some body tissues of fish (Danio rerio) with limited cadmium ion release after two trophic transfers (235). Bacteria-to-protozoa transfer of QDs resulted in CdSe quantum dot biomagnification due to the presence of protozoan food vacuoles which accumulate intact QDs (237), and therefore could be passed to higher trophic organisms. CdTe QDs both accumulate in bacteria and are transferred to predatory protozoans at a biomagnification factor of 1.4 as evidenced by both fluorescent imaging and internal Cd concentrations (236), thus demonstrating diet may be an important route of exposure for QDs. In plants, cadmium ions released from CdTe-MPA QDs in fewshwater accumulated within the tissues of the macrophyte Lemna minor at a bioaccumulation factor of 5211 (227). The potential transfer from primary producers to consumers must also be considered as a possible source of QDs entering food webs. Arabidopsis thaliana treated with CdSe/CdZnS QDs, which were found to translocate into the plant tissues, were fed to caterpillars (Trichopulsia ni) resulting in reduced weight gain of up to 80% compared to the controls (238). Therefore, the environmental conditions and the physiology of the organisms at each trophic level, as well as the structure and surface modifications of the QDs, contribute substantially to the ability of toxic metal-based QDs or dissolved metal ions to be passed up the food chain and possibly biomagnify (although this phenomena has not been reported).
4.6. Toxicokinetics
Toxicokinetics is the movement of toxicants into an organism and how the compound moves throughout the body. There is evidence that QDs are retained in the gut of macroorganisms and the retention period is largely due to varying surface modifications. Daphnids (Daphnia magna) exposed to CdSe/ZnS QDs with surface coatings of PEG, PAA-PEG, PMAO, or PMAO-PEG for 24 hours demonstrated various levels of retention in the following 48 hours of depuration (239). The longer QDs persist in the digestive tract, the higher the potential for QDs to degrade and increase the bioavailability of toxic cadmium ion, particularly in acidic environments such as the stomachs of many organisms or acidic food vacuoles of protozoans(240). For example, D. magna fed during the depuration period actually retained more QDs because sorption to organic carbon facilitated higher uptake of QDs and subsequently resulted in higher levels of internalized cadmium than individuals that were not fed. However, there is the possibility of reduced cadmium toxicity in some circumstances due to lower cadmium ion bioavailability when sorbed to organic carbon. QDs with charged functionalized surfaces (both positively and negatively charged groups) resulted in higher nanoparticle uptake and cellular internalization in the freshwater daphnids D. magna and Ceriodaphnia magna than uncharged QDs (241). As discussed above, different types of surface coatings significantly contribute to the ability of QDs to agglomerate, degrade, and interact with tissues in the digestive tract (239). In mollusks, the digestive tissues and hepatopancreas are targets for QD accumulation and toxicity (233, 242). The high retention of Cd-based QDs in the digestive tract suggests that continuous exposure to QDs can lead to increased accumulation of QDs within the body of aquatic organisms. Different filter feeding organisms preferentially retain differing size classes of agglomerates or particulates, thus leading to potential differences in dissolution/degradation rates of QDs within the body (241, 243). Once inside the body, there are multiple ways that QDs can enter a cell. Due to their small size, QDs can be engulfed via phagocytosis or cross cellular membranes when functionalized with a bioactive molecule (244). QDs can interact intracellularly with organelles (i.e., mitochondria), lipid membranes, and deoxyribonucleic acid (DNA).
4.7. Effects of surface modification on toxicity
As discussed, it is well-established that QD toxicity varies due to their composition and physiochemical properties as well as the environmental conditions affecting bioavailability (105). However, some generalizations can be made about the similarities between the most common core components of metallic QDs such as Cd-based QDs. Functionalized QDs with surface modifications may pose higher targeted toxicity than unmodified QDs because some surface modifications are designed to effectively interact with biological moieties (244, 245). For example, functionalized QDs are more common in biomedical and bioimaging applications, whereas unmodified QDs are typically used in manufactured commercial and consumer products. Therefore, QD design and behavior under exposure conditions can play an important role in the non-targeted toxicity of QDs to organisms, especially if the QD’s surface is modified. As noted, the focus of this review is on environmental exposure to QDs not exposures resulting from biomedical use of QDs. However, as their use increases, biomedical QDs may enter the environment at some point in their life cycles. This analysis suggests these modified QDs may represent a greater risk of adverse effects than QDs in manufactured commercial and consumer products.
4.8. Forms of toxicity
The following section discusses the various forms of acute and sublethal toxicity reported in the scientific literature.
4.8.1. Acute toxicity
The primary mode of acute toxicity from metal-based QDs is through the release of metal ions from the core (Figure 5). However, few studies have determined LC50 values because the concentration of QDs resulting in median mortality are higher than current potential environmentally-relevant concentrations (see Section 2). Additionally, nearly all acute toxicity studies using aquatic species have been limited to evaluations of Cd-based QDs. There are few studies reporting lethality values using other varieties of QDs (Table 2). This is largely due to the lower acute toxicity associated with carbon-based and silicon QDs and nanoparticles. For example, studies of other carbon-based nanoparticles (e.g., single-wall carbon nanotubes) have also found very limited acute toxicity to aquatic organisms (246, 247). Because the acute toxicity associated with Cd-based QDs is understood to be associated with weathering of the core, most ecotoxicology studies on these QDs use a cadmium salt (e.g., CdCl2) as a positive ion control to confirm acute toxicity is associated with cadmium ion release. This approach is standard practice for metal nanoparticles research.
LC50s of many cadmium and selenium-based QDs are often lower (i.e., more toxic) for QDs without shells or surface modifications based on the overall QD structure and the environmental conditions of the exposure (Table 2). The capping agents and shell material of QDs may also lead to distinct differences in acute toxicity observed between cadmium ions and intact QD nanoparticles (248). For example, the round worm C. elegans exposed to QD with a CdSe core and a ZnS shell modified with mercaptosuccinic acid resulted in no significant mortality after a 24 hour exposure compared to a Cd2+ LC50 of 1,487.3 ± 1.9 μM, which was comparable to the total cadmium concentration of the intact QDs in the same treatments (249). Surface modifications that increase QD stability, such as polyethylene oxide, are shown to reduce short-term acute toxicity (250) as the toxic metals are bound in the crystalline core structure and are not immediately bioavailable especially in capped QDs with shells. In addition, different sizes of QDs display significant differences in acute toxicity (250). However, sublethal effects, ranging from transcriptomic alteration and DNA damage to impaired growth and reproduction must be considered in a comprehensive analysis of the environmental toxicity of QDs (229, 249). Like many nanoparticles that are not acutely toxic (e.g., carbon nanotubes or TiO2), LC50 values are not the most important endpoints for evaluating relevant QDs risk to ecological systems. Sublethal endpoints sensitive to nanoparticles are far more relevant for chronic and sub-chronic exposures and understanding transgenerational and transcriptomic impacts related to population health because they are associated with realistic concentrations of QDs occuring in the environment compared to high concentrations used in short-term acute exposure scenarios.
4.8.2. Sublethal toxicity
At sublethal concentrations, many varieties of QDs share similar mechanisms of toxicity (Table 3). Several types of sublethal endpoints are discussed below, including (i) cytotoxicity, (ii) transcriptomic alteration, (iii) immunotoxicity, (iv) reproductive effects, (v) growth and development, (vi) transgenerational toxicity, and (vii) behavioral effects.
-
Cytotoxicity One of the main concerns with Cd-based QDs is that released cadmium ions are highly cytotoxic (244, 251). The extent of QD cytotoxicity is attributed to the physiochemical properties of the QD variety (e.g., size, shell material, surface modifications, capping agents) and the exposure conditions (i.e., agglomeration, weathering, oxidation, pH) which all contribute to QD stability and release of metal ions (105). In addition to the known cytotoxicity associated with ionic cadmium, QD nanoparticles have been shown to cause additional cytotoxicity via similar pathways as cadmium ions due to the unique effects of nanosized particles (249, 252), which is discussed in detail below. Even carbon-based QDs induce cytoxicity through oxidative stress pathways due to nanoparticle effects (253). Cadmium reduces antioxidants in cells, which leads to ROS formation, increased activity of super oxide dismutase (SOD), and oxidative stress of cells and tissues. Further, increased ROS contributes to DNA damage such as double strand breaks, retardation of DNA repair mechanisms, and can lead to apoptosis and genotoxicity (251, 254). ROS formation ultimately leads to a cascade of other cellular, tissue, and organismal-level effects, such as immune and reproductive system impairment (see adverse outcome pathway (AOP) (Figure 6) discussed below) in a range of organisms.
Animals are not the only organisms affected by QD-induced cytotoxicity. Cytotoxicty and formation of ROS has occurred in plants and, due to their small size, single-celled organisms, such as yeast, bacteria, microalgae, and protozoans, which have extensive interaction with QDs at the molecular level leading to high rates of cytotoxicity. For example, when exposed to 10 nM CdSe/ZnS-MPA QDs, alfalfa (Medicago sativa) cells produced higher levels of SOD, glutathione (GSH), and catalase (CAT) in response to oxidative stress (255). In addition, Xu et al.(256) found that low levels of CdTe QDs (0.5–10 nM), well below the concentrations needed to inhibit bacterial growth, activated prophages, or silent viruses, inside bacteria related to increased production of ROS. In green algae (Scenedesmus obliquus), exposure to 200 mg/L carbon QDs induced ROS formation and significantly increased the activity of SODs and lipid peroxidation (LPO) levels (253).
Transcriptomic alteration Cytotoxicity can lead to transcriptomic alterations, resulting in dysregulated biochemical pathways. Transcriptomic alterations can be measured using targeted quantitative real-time polymerase chain reaction (PCR) analysis or comprehensive microarray and RNAseq technologies to detect a suite of differentially expressed genes. The majority of transcriptomic changes measured in plants, animals and microorganisms are related to disrupted oxidative stress, mitochondrial function, metabolic and detoxification pathways (257–259). Plant transcriptomes also undergo significant alterations associated with oxidative stress when exposed to Cd-based QDs. Soybean seedlings (Glycine max) exposed to CdS modified with TOP, MAA, PVP, and GLY all resulted in trancriptomic alteration of transmembrane proteins involved in the uptake of metal ions, which was primarily attributed to QD particle toxicity rather than cadmium ion toxicity (259). This led to downstream alterations in biosynthesis and metabolic pathways where many metabolites play important roles in oxidative stress response and detoxification (259). An Arabidopsis thaliana (thale cress plant) mutant showed considerably different transcriptomic profiles in response to CdS QDs compared to wild-type plants, suggesting that some plants may exhibit a range of sensitivities to Cd-based QDs due to genetic mutations (260). Additionally, the transcriptomic alterations associated with oxidative stress due to QD nanoparticle exposure are significantly different than pathways associated with the ionic cadmium control derived from the standard CdSO4 salt in both plants and baker’s yeast (Saccharomyces cerevisiae) (258, 260, 261). Similarly, in one of the rare environmental toxicity studies on graphene QDs (GQDs), they were found to alter gene expression in inflammation, detoxification, and ROS-responsive pathways largely due to the activation of the transcription factor Activator Protein-1 (AP-1) mediated by ROS production (257). The obvious similarities in transcriptomic pathway alterations associated with QD exposures pinpoints the production of ROS by the nanoparticles itself as the key cause of these effects.
Immunotoxicity Proper immune response, such a phagocytotic activity, is necessary for organisms to remove harmful exogenous stressors. In freshwater mussels (Elliption complanata), Gagne et al. (262) reported reduced phagocytic activity and hemocyte viability) in response to CdTe QD exposure, both of which are immune responses directly involved in removing exogenous toxicicants. In the phagaocytotic response in mussels (Mytilus edulis and Elliptio complanata), hemolymph was reduced during exposure to larger agglomerates and higher concentrations of CdS/CdTe QDs, with differences in species sensitivities attributed to the interactive effects of saltwater versus freshwater (i.e., higher ionic strength of saltwater) (243). A reduction in phagocytotic activity can be correlated to a decrease in overall organismal health.
Reproductive effects QDs adversely affect the reproduction and fecundity of several organisms, and the severity of impaired reproduction differs between organisms and the composition of the QDs. The disruption of vitellogenin (an egg-yolk precursor protein) production has been associated with QD exposure (263). Vitellogenin is vital for the successful production of eggs in females, and disruption of the production of the vitellogenin gene (vtg) or protein can cause adverse reproductive effects. QD-indolicidin exposure led to multi-generational reduction in vtg production in the daphnid D. magna, subsequently leading to reduced fecundity across all generations (264). Cadmium QD exposure causes lower hatch rates and embryo survival and is associated with disrupted egg production in both vertebrate and invertebrate models (249, 265, 266). Male reproduction is also adversely affected by reduced sperm production and quality leading to reduced fertilization rates in male Domestic Silk Moths (Bombyx mon) (267), and there is some evidence of endocrine disruption by increased vtg expression in male estuarine fish (Fundulus heteroclitus) (263). Therefore, the effects of QDs on reproduction are not only limited to egg production in females, but reduced hatching and embryo survival may be due to adverse impacts on both male and female reproduction.
Growth and Development QD exposure during critical windows of development leads to reduced growth in several organisms. Embryonic and larval organisms are particularly susceptible to long-term developmental effects, especially with chronic exposures throughout early developmental periods. Certain QD varieties, particularly Cd-based QDs, are even teratogenenic and cause severe malformations of offspring (249, 265, 266, 268). Embryonic rainbow trout (Oncorhynchus mykiss) experienced about a 5-fold higher incidence of malformations when exposed to 4×10⁻⁹ mol/L CdSe/ZnS QDs for 14 days compared to one day, demonstrating how sub-chronic QD exposure during sensitive periods can have long-term effects (229). Similarly, zebrafish embryos experienced significant developmental malformations and severely altered vascular patterning when exposed to 12.15 mg/L CdSe-MPA (265). Offspring growth is also heavily affected by maternal exposure to QDs, which caused reduced growth rates of offspring in the daphnid D. magna (264). Adult organisms exposed to QDs also experience reduced lifespan associated with dysregulation of reproduction in mature round worm C. elegans (249). Even diatom (Phaeodactylum tricornutum) growth rates decreased in response to QDs both with and without a shell (CdSe and CdSe/ZnS), likely due to the negative impacts of ROS and SOD formation (269). Terrestrial plants, such as wheat, experienced reduced shoot and root growth when exposed concurrently to CdTe QDs and UV-B radiation (270). Exposure during critical developmental timepoints can have long-term impacts, and exposure in advanced stages reduces growth and lifespan of a variety of organisms (271).
Transgenerational Toxicity Toxic metal ions are known to cause transgenerational effects in both vertebrate and invertebrate species through 1) maternal transfer of metals to offspring (263) and 2) epigenetic and prolonged transcriptomic alterations (267, 272, 273). Cadmium QDs also display transgenerational effects from cadmium ions manifesting in reduced fecundity, offspring reproduction, and offspring growth, which can be linked to prolonged adverse population-level impacts (272). Contreras et al. (274) determined that Cd-based QDs (CdSe) without a shell prevented normal offspring growth and caused reproductive impairments in subsequent generations compared to exposure to CdSe QDs with a ZnS shell; therefore, the toxic effects of the core-type QD are likely due to higher release of metal ions unhindered by the shell. In the estuarine fish, F. heteroclitus, internalized QDs accumulated in the liver and cadmium was detected in the eggs of parents fed CdSe/ZnS QDs daily (263). This observation raised concern for the transfer of QDs from the liver to eggs via egg yolk production pathways. In zebrafish, graphene QD exposure caused increased DNA methylation, which is a major mechanism for controlling the expression of certain genes through epigenetics (273). The evidence for both cadmium- and carbon-based QDs causing transgenerational effects raises concerns for possibility of population-level impacts.
Behavioral Effects Normal behaviors are fundamental for the survival of species. This is accomplished by successful foraging, prey capture, predator avoidance, reproduction, and reducing unnecesary movements that can compromise an organism’s chance of survival. The foot movement and filter feeding activity of the bivalve Scrobiculara plana was significantly reduced in response to subchronic exposure to CdS QDs, and these behavioral changes were more pronounced in QD exposures compared to ionic Cd at the same concentrations (275). Nest-making behavior was reduced in rainbow trout (Oncorhychus mykiss) larvae after short 4-day and sub-chronic 14-day exposures to 4 × 10⁻⁹ mol/L CdSe/ZnS–COOH QD (2659 μg/L equivalent Cd) (229). Larval zebrafish swimming speeds were altered after exposure to CdTe-TGA QDs using behavioral tests designed to assess locomotion responses to stress (276). Disruption of normal locomotion and feeding activities suggest that QDs may be neurotoxic and prolonged exposure may have adverse impacts at the organism-level.
Figure 6.

Example Adverse Outcome Pathway (AOP) for the molecular initiating events (MIE) of oxidative stress and reactive oxygen species formation associated with QD exposure resulting in a cascade of negative effects to aquatic organisms. Blue arrows indicate induction pathways and red arrows indicate inhibitory pathways. Dashed arrows indicate indirect and proposed effects.
4.9. Unique aspects of QD nanoparticle toxicity
Like some other engineered nanoparticles, QDs have the ability to enter individual cells because of two factors: 1) the incredibly small size of QDs (~2–20 nm) allows passage through cell membranes for easier endocytosis (277) and 2) surface modifications with organic molecules can facilitate more rapid passage through cell membranes (245). Additionally, different capping agents and surface modifications alter the toxicity of the nanoparticle itself (268). Whole QDs have been imaged in the digestive tracts of aquatic organisms, on the exterior and interior vacuoles of single-celled organisms, and agglomerated on the outside of plant roots (224, 239, 278, 279). Fluorescent imaging is often utilized to confirm the presence and concentration of intact QDs in organisms due to the useful optical properties of this class of nanoparticles. When fluorescence from pristine (intact) QDs is detected inside an organism, Hsu et al. (249) and Feswick et al. (241) argue this demonstrates that the adverse effects associated with QD exposure are due to the nanoparticle itself and not necessarily ionic metal. Although QDs may be imaged within the digestive system of an organism, this does not confirm that intact QDs are internalized into cells or have crossed the intestinal wall. QD nanoparticles internalized by plants can also reduce growth, affect ROS formation, and be detoxified through separate metabolic pathways unrelated to minimal Cd2+ ion release (252). Although the capping agents and surface modifications can reduce the release of core materials in short-term exposures, the retention of agglomerated or single QDs internally may add to long-term exposure risk because of particle degradation over time. For example, CdSe/ZnS QDs functionalized with carboxylic acid (−COOH) were internalized and retained in significantly higher concentrations in the tissues of the daphnid C. dubia compared to non-functionalized QDs even after a 24 hour depuration period (241). This demonstrates how surface modifications designed for biomedical and bioimaging applications that enter the environment may lead to higher internalization of QDs in aquatic organisms.
4.10. Comparing metal versus carbon-based QDs
Although the vast majority of QD studies related to environmental adverse effects are focused on metal-based QDs (especially Cd-based QDs), the numbers of original research studies investigating the effects of carbon-based QDs are increasing in response to the increasing usage (280)and possible banning or limiting of use of cadmium QDs (138). Initial toxicity testing with carbon-based QDs suggests they are less acutely toxic and cytotoxic than cadmium and other metal-based QDs which would support their eventual replacement of cadmium QDs in manufacturing and consumer products. However, carbon-based QDs elicit similar sublethal responses in oxidative stress and detoxification pathways as metal-based QDs (257). For instance, a study on green microalgae, Chorella vulgaris, demonstrated that small graphene oxide QDs resulted in a significant increases of oxidative stress and disrupted metabolomic processes such as chlorophyll biosynthesis (281). Similarly, carbon QDs induced oxidative stress pathways and reduced chlorophyll a production in freshwater phytoplankton (Scenedesmus obliquus) at 200 mg/L and 50 mg/L concentrations, respectively, for each endpoint (282). The highly similar pathways involved for both metal-based and carbon-based QD exposures reinforces the specific sublethal adverse effects caused by the nanoparticles compared to the acute effects associated with released metal ions. Therefore, to capture the full range of the adverse effects of all types of QDs, sublethal effects must be considered when evaluating potential ecological impacts.
4.11. Relevant adverse outcome pathways (AOPs) for QDs
In recent years, the AOP has been proposed as a hierarchical construct for relating the toxicological effects of a chemical or substance along a continuum starting with a molecular initating event (MIE) leading-up to negative effects at the population level (283). The AOP has many advantages for understanding toxicity including relating sublethal insults, such as oxidative stress, to organismal effects that can be applied for regulatory purposes. A particular advantage of the AOP is that they are agnostic of the specific stressor under investigation and can be applied to contaminants with common adverse impacts. For QDs, overlaps and similarities between oxidative stress and apoptosis pathways leading to negative impacts at the organism level can be visualized through a proposed AOP. As discussed above, pristine QDs promote ROS formation, which leads to a variety of cellular, tissue, and organ-level responses culminating in similar negative impacts. This results in a range of sublethal effects including cytoxicity, impaired reproduction, impaired growth, and delayed development (Figure 6). In a traditional regulatory paradigm, responses at the organism level (e.g., reduced growth and reproduction) would be used for regulating QDs. However, cellular, tissue and organ reponses predict such effects and could be considered as regulatory indicators or sentinels for QDs based on the proposed AOP framework.
5. DATA GAPS IN THE PERFORMANCE OF QUANTUM DOT RISK ASSESSMENT
Despite the scientific information currently available on the exposure and effects associated with QDs in the environment, there are several large data gaps that need to be addressed before it will be possible to accurately and successfully assess environmental risk and effectively develop regulations. Several of the most relevant data gaps are listed below:
There are unacceptable discrepancies—at times up to one or two orders of magnitude—in the projected global production of QDs. The error and variability in the production volumes contributes additional uncertainty to existing predictions of QD concentrations in the environment. More reliable data is needed about QD production on a global scale and on the amount of QDs currently in commerce.
Research on the synthesis of QDs (i.e., pristine, unweathered form) is readily available. However, very little is known about the amount of QDs embedded in different products. More high quality work is needed to account for Cd-based and/or Cd-free QDs used in applications such as thermoelectrics, LEDs, and solar cells. Similarly, experimental studies on release into different environmental phases during the entire life cycle of QD-containing products are not available. While theoretical studies have been carried out, these predictions are largely not validated by experimental or field work.
High quality agglomeration and dissolution rates of all classes of QDs under different environmental conditions (i.e., freshwater vs seawater, soils/sediments with various levels of organic matter, pH, salinity, UV intensity) is very limited, needs to be determined, and disseminated in the peer-reviewed scientific literature.
Understanding the factors that govern how different QDs degrade under various environmental conditions is vital for understanding their fate in different ecosystems and is a first step to estimating bioavailability and potential human health and ecological effects. Currently, this type of data is lacking. In addition, when the data is available, the physicochemical conditions in controlled experiments are often different from actual environmental settings. Consequently, creating a realistic environmental dataset for predicting the bioavailability and adverse effects of QDs or ionic metal core materials while challenging is critical. Harmonization of environmental testing conditions and reporting could be accomplished following the suggested guidelines of Geitner et al. (2020) (284).
As reflected in the discussion above, the vast majority of toxicological studies have focused nearly exclusively on Cd-based QDs. To achieve a comprehensive risk assessment of QDs, scientific investigations need to measure the adverse effects of other QDs, including Cd-free, carbon-based, silicon, and perovskite forms. In addition, most of the toxicological data available in the literature involved aquatic organisms. More research needs to be performed examining the adverse effects of QDs to terrestrial wildlife including birds.
So far, too many ecotoxicological studies have focused on acute effects. To be trully useful, these studies need to report the sublethal effects of QDs (e.g., EC50s and LOECs). Reports also need to include the concentrations of QDs investigated and the associated relative levels of core and shell components, such as cadmium or selenium, in order to make comparisons in toxicity between organisms, conditions, and types of QDs more viable. Another challenge in comparing studies is the use of different units for expressing amounts and concentrations, the use of consistent and standardized units relative to QDs would be beneficial. In addition, studies should be performed with environmentally realistic concentrations of QDs based on predicted/modeled concentrations, and, eventually, actual measured field concentrations. Given the continuing uncertainties associated with the adverse effects of QDs, as discussed here, assessing risk continues to be a challenge. In a meta-analysis, Notter et al. (2014)(285) evaluated the toxicity associated with three types of metallic nanoparticles (i.e., copper, zinc, silver) by assuming as a ‘worst case’ scenario all metals in a given nanoparticle dissolved. A similar approach should be considered for assessing risk associated with QDs. However, to use this approach, it is critical to understand how metal ion toxicity compares to the toxicity associated with the remaining QD.
Although not an issue unique to QDs, currently, regulation of chemicals is based primarily on lethal and/or sublethal effects at the organismal level (see the earlier discussion of the AOP). However, linking these effects, especially the sublethal effects, to population-level responses is critical because probable environmental exposures of QDs will likely lead to sublethal, rather than lethal, effects. Sublethal effects of QDs described in the scientific literature often lead to reduced reproduction and growth, which can have adverse effects on populations and communities. There are no studies measuring, predicting or modeling these linkages for QDs and this connection must be made for effective risk assessments and regulations.
Oxidative stress is clearly an important adverse effect caused by QDs. Standardizing sublethal endpoints related to oxidative stress AOPs will better inform realistic toxicity thresholds for QDs to endangered species, economically-important organisms, and sensitive ecosystems. Measuring ROS and SOD formation at the cellular level and quantifying cellular regeneration and apoptosis at the tissue level is a practical method of determining LOECs for each QD variety and for different species. The U.S. EPA and other regulatory agencies are interested in the most appropriate methods for regulating engineered nanomaterials, including QDs, that are entering the market, which may be different than past regulatory requirements as our knowledge base advances.
Organisms will likely be exposed to multiple types of QDs made from different toxic metals, carbon-based materials, and other newer QDs (as they become more common). Again, this is not an issue unique to QDs, but currently, there is extremely limited information on the adverse effects of mixtures of QD to organisms. There are some documented interactions of co-exposures with other types of environmental stressors such as UV radiation, salinity, and non-QD toxic metals (266, 286). Realistically, exposed organisms will also be subjected to exposures to various environmental stressors and QDs simultaneously, so it is imperative to understand the interaction of QD mixtures and multiple stressors.
Possibly conspicuous by their absence are any documented adverse effects to humans caused by environmental exposures to QDs. Of course, this does not necessarily mean such effects have not occurred, but they may not have been detected or reported. As discussed here, over the last twenty years or so, a growing body of scientific literature has reported the environmental exposure and adverse effects of QDs for a range of conditions and for a diversity of organisms. Most of these investigations have been performed under controlled laboratory conditions as measurement of QD under field conditions is very difficult. As QDs enter the environment in increasing numbers as by-products of manufacturing practices, use during their life cycle, and improper disposal, field studies will become increasingly important to understand actual QD ecological risk and for gauging the potential for exposure and adverse effects to humans. Of particular concern are those QDs specifically designed to interact with biological moieties via surface modification (e.g., those QDs used in the biomedical field).
6. SUMMARY
Measuring the concentrations of QDs once they enter the environment is difficult due to the challenge of distinguishing them from other natural and anthropogenic materials. Further, environmental processes including dissolution, degradation, agglomeration, and sedimentation complicate QD measurement. The majority of adverse effects data addresses Cd-based QDs even though many other types of QDs are on the market and are potentially released (or will be released) into the environment as QD usage increases over the next several decades. Despite that lack of coverage, the amounts of QDs currently entering the environment is relatively small, suggesting organismal exposure to QDs will likely occur at low concentrations leading to sublethal effects. The slow weathering, dissolution, and degradation of QDs releasing core constituents like ionic cadmium may contribute to prolonged chronic exposure. This will likely be especially true for benthic and lower trophic level organisms interacting with both pristine and weathered QDs present in sediments. However, it is important to recognize that because the study of QDs has been so focused on ionic metals released during degradation our understanding is very limited on the adverse effects of the QD nanoparticles and future research needs to further investigate intact QDs. Sediments are a sink for a range of environmental contaminants including QDs. Consequently, the highest concentration of and exposure to QDs will likely be in benthic environments, which will then lead to an increased risk of adverse effects to benthic organisms. In addition to the data gaps discussed above, we suggest future research evaluating the environmental impacts of QDs should be focused on determining sublethal effects for both individual QDs and mixtures of QDs to benthic organisms, especially keystone organisms, forming the foundation of food webs. Finally, adverse effects to humans caused by environmental exposure to QDs have not yet been documented.
Supplementary Material
ACKNOWLEDGEMENTS
The authors appreciate the insightful comments on the draft manuscript by the internal technical reviewers Joseph LiVolsi, Todd Luxton, Rick McKinney, and Bianca Ross. In addition, the authors thank Dr. Todd Luxton for his input on the preliminary structure of this review. The authors declare no conflicts of interest. Mention of trade names or commercial products does not constitute endorsement or recommendation for use. Funding for the research discussed in this manuscript was entirely by the U.S. Environmental Protection Agency. The views expressed in this article are those of the authors and do not necessarily represent the views or policies of the U.S. Environmental Protection Agency.
KEY TERMSa
- Acute toxicity
Adverse effect causing mortality to exposed organisms.
- Adverse outcome pathway (AOP)
Conceptual framework describing a pathway for assessing hazards to organisms and population (including humans) health. Also see Molecular Initiating Event (MIE).
- Agglomeration
Clustering of more than two nanoparticles, including quantum dots, resulting in increasing size of the growing particle. In this report, equivalent to aggregation.
- Aggregation
See Agglomeration.
- Alloying quantum dot
Semiconducting quantum dots formed by combining two semiconductors with different band gap energies resulting in properties distinct not only from the properties of their bulk counterparts but also from those of their parent semiconductors.
- Band gap
Difference in energy between the valence band and the conduction band of a solid material (such as an insulator or semiconductor) consisting of the range of energy values forbidden to electrons in the material.
- Benthic
Aquatic organisms, structures and functions associated with the sediments.
- Bioaccumulation
Accumulation of chemicals, materials or substances within the tissues of an organism.
- Bioavailability
Expression of chemical, material or substance present in a form that results in an exposure to an organism causing bioaccumulation and/or adverse effects.
- Biomagnification
As a result of trophic transfer, an increase in bioaccumulation of chemicals, materials or substances moving up the food chain
- Bohr radius
Radius of the smallest or ground-state electron orbit in the hydrogen atom, equal to about 5.29×10⁻⁹ centimeter.
- Capping agents
In this report, equivalent to capping ligands and surface coatings.
- Chemiluminescence
Luminescence (such as bioluminescence) due to chemical reaction
- Colloidal stability
Ability of particles to remain suspended in solution.
- Conduction band
Range of permissible energy values which an electron in a solid material allows the electron to dissociate from a particular atom and become a free charge carrier in the material.
- Crystalline size
Dimensions of a crystal.
- Cytotoxicity
Adverse effects of a compound (toxicity) to cells.
- Dispersibility
Quality or state of being distributed in a system or environment.
- Dissolution
In this report, the act or process of dissolving.
- Electrical conductivity
Magnitude of the capability to conduct electricity.
- Electrical double layer
Region existing at the boundary of two phases and assumed to consist of two oppositely charged layers (such as a layer of negative ions adsorbed on colloidal particles that attracts a layer of positive ions in the surrounding electrolytic solution).
- Electromagnetic radiation
Form of energy in waves including ultraviolet (UV), visible, and infrared (IR) regions.
- Electron-hole pairs
Two electrons belonging to one atom or shared by two atoms as a chemical bond. Same as Excitons.
- Electrostatic forces
Electrostatic interactions existing in attractive and repulsive forms between particles caused by their electric charges.
- Emission spectra
Electromagnetic spectrum deriving its characteristics from the material of which the emitting source is made and from the way in which the material is excited.
- Epigenetic
Heritable changes leading to different phenotypes due to changes in gene expression without alteration of DNA sequences.
- Eukaryote
Domain (Eukarya) or a higher taxonomic group (Eukaryota) above the kingdom including organisms composed of one or more cells containing visibly evident nuclei and organelles.
- Euphotic zone
Upper depths of a water body where light penetrates and supports plant growth.
- Excitation energy
Minimum amount of energy required to convert a normal stable molecule into a reactive molecule.
- Excitons
See Electron-hole pair.
- Fluorescence
Luminescence caused by the absorption of radiation at one wavelength followed by nearly immediate re-radiation (or emission) usually at a different wavelength that ceases almost at once when the incident radiation stops.
- Graphene
Extremely electrically conductive form of elemental carbon composed of a single flat sheet of carbon atoms arranged in a repeating hexagonal lattice.
- Graphene oxide
Oxidized form of graphene in which oxygen and hydrogen moieties are components of the carbon structure.
- Hetero-agglomeration
Agglomeration involving different particles, including nanoparticles. In contrast, homo-agglomeration involves agglomeration of particles of the same type.
- Humic acid
Natural dissolved and particulate organic matter formed by the degradation of terrestrial and aquatic biomass.
- Hydrodynamic diameter
Diameter of a particle in liquid solution.
- Immunotoxicity
Chemical, material or substance which causes toxicity to the immune system.
- Incandescent
Of, relating to, or being light produced by incandescence (i.e., white, glowing, or luminous with intense heat).
- Ionic
Characterized by metals in the form of ions. Often more bioavailable than other forms of metals enhancing the probability of causing adverse effects.
- Ionic strength
Expression of presence of dissolved ions in aqueous solution (e.g., seawater).
- Isoelectric point
Point or narrow range on a pH scale at which a reactive molecule or surface carries no electrical charge, or in which the negative and positive charges are equal resulting in a net zero charge.
- Liquid crystal display (LCD)
Image based on an organic liquid whose physical properties resemble a crystalline formation of loosely ordered molecular arrays similar to a regular crystalline lattice and an anisotropic refraction of light (i.e., refraction light in multiple directions rather than one direction (isotropic)).
- Luminescence
Low-temperature emission of light (as by a chemical or physiological process).
- Median effect concentration
Concentration of a chemical, material or substance causing a 50% sublethal effect (e.g., reduced growth, reproduction). Also, known as the EC50.
- Median lethal effect concentration
Concentration of a chemical, material or substance causing 50% mortality. Also known as the LC50.
- Molecular initiating event (MOI)
Initial interaction between a chemical, material or substance and a biomolecule causally linked to a negative outcome via a pathway. Also see Adverse Outcome Pathway (AOP).
- Monochromaticity
Consisting of one color.
- Monodispersed colloids
Colloidal particles of uniform size in a dispersed phase.
- No observable effect concentration
Highest concentration tested of a chemical, material or substance without a statistically-significant adverse effect. Also known as the NOEC.
- Nanocomposite materials
Nanomaterials put together molecule by molecule.
- Nanocrystal
Crystal with nanoscale dimensions.
- Nanomaterials
Substances consisting of nanoparticles with nanoscale dimensions.
- Nanoparticles
Particle whose size is measured in nanometers.
- Oxidative stress
Physiological stress on the body caused by the cumulative damage of reactive oxygen species and/or free radicals inadequately neutralized by antioxidants.
- Oxyanions
Anion containing one or more oxygen atoms bonded to another element (as in the sulfate and carbonate ions).
- Pelagic
Aquatic organisms living primarily in the water column.
- Perovskite
Mineral consisting of an oxide of calcium and titanium sometimes containing rare earth elements. Because of unique properties, increasingly used in the Quantum dot industry.
- Photo-bleaching
Removal of color by light energy.
- Photoluminescence
Luminescence in which the excitation is produced by ultraviolet (UV), visible, and infrared (IR) electromagnetic radiation.
- Photolysis
Chemical decomposition caused by radiant energy (such as light).
- Photooxidation
Oxidation under the influence of radiant energy (such as light).
- Photostability
Resistant to degradation under the influence of radiant energy and especially of light.
- Photovoltaic
Generation of voltage when radiant energy falls on the boundary between dissimilar substances (such as two different semiconductors).
- Physicochemical properties
Characteristics of a chemical, material or substance describing physical and chemicals traits (e.g., water solubility, vapor pressure).
- Precipitate
Descent of a chemical, material or substance from solution into a solid phase.
- Prokaryote
Unicellular microorganisms lacking a distinct nucleus and membrane-bound organelles classified as a kingdom (Prokaryotae synonym Monera) or into two domains (Bacteria and Archaea)
- Product lifecycle
Series of stages through which an industrial or consumer item (i.e., the product) passes during its lifetime from manufacturer to disposal.
- Quantum confinement
Restriction of the electronic wave function to smaller and smaller regions of space.
- Quantum dot
Engineered semiconductor nanocrystal with unique fluorescent, quantum confinement and quantum yield properties.
- Quantum efficiency
Ratio of the number of photoelectrons released in a photoelectric process to the number of radiation quanta absorbed.
- Quantum yield
See Quantum efficiency.
- Salting-out effect
Phenomena in which high ionic strength solutions cause dissolved substances and colloidal particles to precipitate from solution. Common when freshwater meets saltwater in estuaries.
- Sedimentation
Process of forming or depositing sediment including natural and anthropogenic particles.
- Semiconducting nanocrystal
Nanoscale crystal with the characteristics of a semiconductor.
- Spectral purity
Spectrum in which the dispersion is highly discriminative such that the light is practically monochromatic.
- Sublethal toxicity
Adverse effect causing non-lethal impacts potentially including cytotoxicity, transcriptomic alteration, immunotoxicity, reproductive, growth and developmental effects, transgenerational toxicity, and behavior effects.
- Teratogenetic
Adverse effects causing physical malformations in the developing embryo.
- Thermal stability
Ability to resist degradation resulting from heat.
- Toxicokinetics
Study of the absorption, distribution, metabolism, and elimination of hazardous chemicals, materials and substances by an organism.
- Transgenerational toxicity
Adverse effect to an organism caused by transfer from an ancestor.
- Transcriptomic alteration
Modification of an organism’s messenger RNA, or mRNA, molecules.
- Transformation
Process of altering a chemical, material or substance includes alterations caused by chemical reactions or interactions.
- Trophic transfer
Exchange of a chemical, material or substance from one biological level of organization to another biological level (e.g., from a plant consumer to a predator).
- Tunable wavelength
Ability to control a wavelength.
- Valence band
Range of permissible energy values of the highest energies an electron can have and still be associated with a particular atom of a solid material.
- Zero-dimensional
Without dimensions in any direction.
Footnotes
Sources:
Merriam-Webster.com Dictionary. 2021. Merriam-Webster, (https://www.merriam-webster.com/dictionary/). Accessed 3 June 2021.
OxfordLanguages. 2021. Oxford-English Dictionary, (https://languages.oup.com). Accessed 9 June 2021.
Sigma-Aldrich. 2021. (https://www.sigmaaldrich.com). Accessed 9 June 2021.
Stucky GD, JE MacDougall. 1990. Quantum confinement and host/guest chemistry: probing a new dimension. Science 247(4943):669–678.
The Free Dictionary. 2021. Farlex, (https://medical-dictionary.thefreedictionary.com). Accessed 9 June 2021.
REFERENCES
- 1.Reed M, Randall J, Aggarwal R, Matyi R, Moore T, Wetsel A. Observation of discrete electronic states in a zero-dimensional semiconductor nanostructure. Physical Review Letters. 1988;60(6):535. [DOI] [PubMed] [Google Scholar]
- 2.Reed M, Bate R, Bradshaw K, Duncan W, Frensley W, Lee J, et al. Spatial quantization in GaAs–AlGaAs multiple quantum dots. Journal of Vacuum Science & Technology B: Microelectronics Processing and Phenomena. 1986;4(1):358–60. [Google Scholar]
- 3.Park HJ, Shin DJ, Yu J. Categorization of Quantum Dots, Clusters, Nanoclusters, and Nanodots. Journal of Chemical Education. 2021. [Google Scholar]
- 4.Swarnkar A, Marshall AR, Sanehira EM, Chernomordik BD, Moore DT, Christians JA, et al. Quantum dot–induced phase stabilization of α-CsPbI3 perovskite for high-efficiency photovoltaics. Science. 2016;354(6308):92–5. [DOI] [PubMed] [Google Scholar]
- 5.Shirasaki Y, Supran GJ, Bawendi MG, Bulović V. Emergence of colloidal quantum-dot light-emitting technologies. Nature photonics. 2013;7(1):13. [Google Scholar]
- 6.Cotta MA. Quantum Dots and Their Applications: What Lies Ahead? ACS Applied Nano Materials. 2020;3(6):4920–4. [Google Scholar]
- 7.Hassan AI, Saleh HM. Quantum Dots: Properties and Applications 2021. 331–48 p. [Google Scholar]
- 8.Edwards EH, Fertig AA, McClelland KP, Meidenbauer MT, Chakraborty S, Krauss TD, et al. Enhancing the activity of photocatalytic hydrogen evolution from CdSe quantum dots with a polyoxovanadate cluster. Chemical Communications. 2020;56(62):8762–5. [DOI] [PMC free article] [PubMed] [Google Scholar]
- 9.Morgan DP, Kelley DF. What Does the Transient Absorption Spectrum of CdSe Quantum Dots Measure? The Journal of Physical Chemistry C. 2020;124(15):8448–55. [Google Scholar]
- 10.Qu L, Peng ZA, Peng X. Alternative routes toward high quality CdSe nanocrystals. Nano Lett. 2001;1(6):333–7. [Google Scholar]
- 11.Chen X, Nazzal AY, Xiao M, Peng ZA, Peng X. Photoluminescence from single CdSe quantum rods. Journal of luminescence. 2002;97(3–4):205–11. [Google Scholar]
- 12.Schreder B, Dem C, Schmitt M, Materny A, Kiefer W, Winkler U, et al. Raman spectroscopy of II–VI semiconductor nanostructures: CdS quantum dots. 2003;34(2):100–3. [Google Scholar]
- 13.Azpiroz JM, Ugalde JM, Infante I. Benchmark assessment of density functional methods on group II–VI MX (M= Zn, Cd; X= S, Se, Te) quantum dots. Journal of chemical theory and computation. 2014;10(1):76–89. [DOI] [PubMed] [Google Scholar]
- 14.Donegan J, Rakovich Y. Cadmium telluride quantum dots: advances and applications: CRC Press; 2013. [Google Scholar]
- 15.Chen Z, O’Brien S. Structure direction of II− VI semiconductor quantum dot binary nanoparticle superlattices by tuning radius ratio. Acs Nano. 2008;2(6):1219–29. [DOI] [PubMed] [Google Scholar]
- 16.Cipriano LA, Di Liberto G, Tosoni S, Pacchioni G. Quantum confinement in group III–V semiconductor 2D nanostructures. Nanoscale. 2020;12(33):17494–501. [DOI] [PubMed] [Google Scholar]
- 17.Wegner KD, Pouget S, Ling WL, Carrière M, Reiss PJCC. Gallium–a versatile element for tuning the photoluminescence properties of InP quantum dots. 2019;55(11):1663–6. [DOI] [PubMed] [Google Scholar]
- 18.Ginterseder M, Franke D, Perkinson CF, Wang L, Hansen EC, Bawendi MG. Scalable Synthesis of InAs Quantum Dots Mediated through Indium Redox Chemistry. Journal of the American Chemical Society. 2020;142(9):4088–92. [DOI] [PubMed] [Google Scholar]
- 19.Long Z, Zhang W, Tian J, Chen G, Liu Y, Liu RJICF. Recent research on the luminous mechanism, synthetic strategies, and applications of CuInS 2 quantum dots. 2021.
- 20.Bang J, Park J, Lee JH, Won N, Nam J, Lim J, et al. ZnTe/ZnSe (core/shell) type-II quantum dots: their optical and photovoltaic properties. Chemistry of Materials. 2010;22(1):233–40. [Google Scholar]
- 21.Kubendhiran S, Bao Z, Dave K, Liu R-S. Microfluidic synthesis of semiconducting colloidal quantum dots and their applications. ACS Applied Nano Materials. 2019;2(4):1773–90. [Google Scholar]
- 22.Vasudevan D, Gaddam RR, Trinchi A, Cole I. Core–shell quantum dots: Properties and applications. Journal of Alloys and Compounds. 2015;636:395–404. [Google Scholar]
- 23.Tarantini A, Wegner KD, Dussert F, Sarret G, Beal D, Mattera L, et al. Physicochemical alterations and toxicity of InP alloyed quantum dots aged in environmental conditions: A safer by design evaluation. NanoImpact. 2019;14:100168. [Google Scholar]
- 24.Zhu C, Chen Z, Gao S, Goh BL, Samsudin IB, Lwe KW, et al. Recent advances in non-toxic quantum dots and their biomedical applications. 2019;29(6):628–40. [Google Scholar]
- 25.Lin G, Chen T, Pan Y, Yang Z, Li L, Yong K-t, et al. Biodistribution and acute toxicity of cadmium-free quantum dots with different surface functional groups in mice following intratracheal inhalation. Nanotheranostics. 2020;4(3):173. [DOI] [PMC free article] [PubMed] [Google Scholar]
- 26.Chen W, Lv G, Hu W, Li D, Chen S, Dai Z. Synthesis and applications of graphene quantum dots: a review. Nanotechnology Reviews. 2018;7(2):157–85. [Google Scholar]
- 27.Lu J, Tang M, Zhang T. Review of toxicological effect of quantum dots on the liver. Journal of Applied Toxicology. 2019;39(1):72–86. [DOI] [PubMed] [Google Scholar]
- 28.Sadeghi S, Bahmani Jalali H, Melikov R, Ganesh Kumar B, Mohammadi Aria M, Ow-Yang CW, et al. Stokes-shift-engineered indium phosphide quantum dots for efficient luminescent solar concentrators. ACS applied materials & interfaces. 2018;10(15):12975–82. [DOI] [PMC free article] [PubMed] [Google Scholar]
- 29.Bharali DJ, Lucey DW, Jayakumar H, Pudavar HE, Prasad PN. Folate-receptor-mediated delivery of InP quantum dots for bioimaging using confocal and two-photon microscopy. Journal of the American Chemical Society. 2005;127(32):11364–71. [DOI] [PubMed] [Google Scholar]
- 30.Gao X, Du C, Zhuang Z, Chen W. Carbon quantum dot-based nanoprobes for metal ion detection. Journal of Materials Chemistry C. 2016;4(29):6927–45. [Google Scholar]
- 31.Tahir MB, Khalid NR, Rafique M, Iqbal T, Rafique MS, Ahmed A. Chapter 7 - Carbonaceous nanomaterials as photocatalysts. In: Tahir MB, Rafique M, Rafique MS, editors. Nanotechnology and Photocatalysis for Environmental Applications. Micro and Nano Technologies: Elsevier; 2020. p. 97–117. [Google Scholar]
- 32.Wang Y, Hu A. Carbon quantum dots: synthesis, properties and applications. 2014;2(34):6921–39. [Google Scholar]
- 33.Huang Z, Shen Y, Li Y, Zheng W, Xue Y, Qin C, et al. Facile synthesis of analogous graphene quantum dots with sp 2 hybridized carbon atom dominant structures and their photovoltaic application. Nanoscale. 2014;6(21):13043–52. [DOI] [PubMed] [Google Scholar]
- 34.Xie R, Wang Z, Zhou W, Liu Y, Fan L, Li Y, et al. Graphene quantum dots as smart probes for biosensing. Analytical Methods. 2016;8(20):4001–16. [Google Scholar]
- 35.Lei S, Zeng M, Huang D, Wang L, Zhang L, Xi B, et al. Synergistic High-flux Oil–Saltwater Separation and Membrane Desalination with Carbon Quantum Dots Functionalized Membrane. ACS Sustainable Chemistry & Engineering. 2019;7(16):13708–16. [Google Scholar]
- 36.Liu Y, Wu P. Graphene quantum dot hybrids as efficient metal-free electrocatalyst for the oxygen reduction reaction. ACS applied materials & interfaces. 2013;5(8):3362–9. [DOI] [PubMed] [Google Scholar]
- 37.Kou X, Jiang S, Park S-J, Meng L-Y. A review: recent advances in preparations and applications of heteroatom-doped carbon quantum dots. Dalton Transactions. 2020;49(21):6915–38. [DOI] [PubMed] [Google Scholar]
- 38.Li Q, Zhang S, Dai L, Li L-s. Nitrogen-doped colloidal graphene quantum dots and their size-dependent electrocatalytic activity for the oxygen reduction reaction. Journal of the American Chemical Society. 2012;134(46):18932–5. [DOI] [PubMed] [Google Scholar]
- 39.Wang Y, Hu A. Carbon quantum dots: synthesis, properties and applications. Journal of Materials Chemistry C. 2014;2(34):6921–39. [Google Scholar]
- 40.Zhu S, Tang S, Zhang J, Yang B. Control the size and surface chemistry of graphene for the rising fluorescent materials. Chemical communications. 2012;48(38):4527–39. [DOI] [PubMed] [Google Scholar]
- 41.Qian Z, Ma J, Shan X, Feng H, Shao L, Chen J. Highly luminescent N‐doped carbon quantum dots as an effective multifunctional fluorescence sensing platform. Chemistry–A European Journal. 2014;20(8):2254–63. [DOI] [PubMed] [Google Scholar]
- 42.Zhang R, Chen W. Nitrogen-doped carbon quantum dots: facile synthesis and application as a “turn-off” fluorescent probe for detection of Hg2+ ions. Biosensors and Bioelectronics. 2014;55:83–90. [DOI] [PubMed] [Google Scholar]
- 43.Zhang Y-Q, Ma D-K, Zhang Y-G, Chen W, Huang S-M. N-doped carbon quantum dots for TiO2-based photocatalysts and dye-sensitized solar cells. Nano Energy. 2013;2(5):545–52. [Google Scholar]
- 44.Farshbaf M, Davaran S, Rahimi F, Annabi N, Salehi R, Akbarzadeh A. Carbon quantum dots: recent progresses on synthesis, surface modification and applications. Artificial Cells, Nanomedicine, and Biotechnology. 2018;46(7):1331–48. [DOI] [PubMed] [Google Scholar]
- 45.Varma PR. Low-dimensional perovskites. Perovskite Photovoltaics: Elsevier; 2018. p. 197–229. [Google Scholar]
- 46.Watthage SC, Song Z, Phillips AB, Heben MJ. Evolution of perovskite solar cells. Perovskite Photovoltaics: Elsevier; 2018. p. 43–88. [Google Scholar]
- 47.Wang X, Bao Z, Chang Y-C, Liu R-S. Perovskite Quantum Dots for Application in High Color Gamut Backlighting Display of Light-Emitting Diodes. ACS Energy Letters. 2020;5(11):3374–96. [Google Scholar]
- 48.Le QV, Hong K, Jang HW, Kim SY. Halide perovskite quantum dots for light‐emitting diodes: properties, synthesis, applications, and outlooks. Advanced Electronic Materials. 2018;4(12):1800335. [Google Scholar]
- 49.Wang Y, Ding G, Mao J-Y, Zhou Y, Han S-T. Recent advances in synthesis and application of perovskite quantum dot based composites for photonics, electronics and sensors. Science and Technology of Advanced Materials. 2020;21(1):278–302. [DOI] [PMC free article] [PubMed] [Google Scholar]
- 50.Chen Q, De Marco N, Yang YM, Song T-B, Chen C-C, Zhao H, et al. Under the spotlight: The organic–inorganic hybrid halide perovskite for optoelectronic applications. Nano Today. 2015;10(3):355–96. [Google Scholar]
- 51.Krishnamurthy S, Pandey P, Kaur J, Chakraborty S, Nayak P, Sadhanala A, et al. Organic-Inorganic Hybrid and Inorganic Halide Perovskites: Structural and Chemical Engineering, Interfaces and Optoelectronic Properties. Journal of Physics D: Applied Physics. 2020. [Google Scholar]
- 52.Chen D, Chen X. Luminescent perovskite quantum dots: synthesis, microstructures, optical properties and applications. Journal of Materials Chemistry C. 2019;7(6):1413–46. [Google Scholar]
- 53.Li C, Lu X, Ding W, Feng L, Gao Y, Guo Z. Formability of ABX3 (X= F, Cl, Br, I) Halide Perovskites. Acta Crystallographica Section B: Structural Science. 2008;64(6):702–7. [DOI] [PubMed] [Google Scholar]
- 54.Rahim W, Cheng A, Lyu C, Shi T, Wang Z, Scanlon DO, et al. Geometric Analysis and Formability of the Cubic A2BX6 Vacancy-Ordered Double Perovskite Structure. Chemistry of Materials. 2020;32(22):9573–83. [Google Scholar]
- 55.Andoulsi-Fezei R, Sdiri N, Horchani-Naifer K, Férid M. Effect of temperature on the electrical properties of lanthanum ferrite. Spectrochimica Acta Part A: Molecular and Biomolecular Spectroscopy. 2018;205:214–20. [DOI] [PubMed] [Google Scholar]
- 56.Harvey SP, Messinger J, Zhu K, Luther JM, Berry JJ. Investigating the effects of chemical gradients on performance and reliability within perovskite solar cells with TOF‐SIMS. Advanced Energy Materials. 2020;10(26):1903674. [Google Scholar]
- 57.Manna S, Ghosh M, Chakraborty R, Ghosh S, Mandal SM. A Review on Quantum Dots: Synthesis to In-silico Analysis as Next Generation Antibacterial Agents. 2019;20(3):255–62 %J Current drug targets. [DOI] [PubMed] [Google Scholar]
- 58.Ziaudeen SA, Gaddam RR, Pallapothu PK, Sugumar MK, Rangarajan J. Supra gap excitation properties of differently confined PbS-nano structured materials studied with opto-impedance spectroscopy. Journal of Nanophotonics. 2013;7(1):073075. [Google Scholar]
- 59.Reiss P, Protiere M, Li L. Core/shell semiconductor nanocrystals. Small. 2009;5(2):154–68. [DOI] [PubMed] [Google Scholar]
- 60.Tonelli AM, Venturini J, Arcaro S, Henn JG, Moura DJ, Viegas AdC, et al. Novel core‐shell nanocomposites based on TiO2‐covered magnetic Co3O4 for biomedical applications. Journal of Biomedical Materials Research Part B: Applied Biomaterials. 2020;108(5):1879–87. [DOI] [PubMed] [Google Scholar]
- 61.Swafford LA, Weigand LA, Bowers MJ, McBride JR, Rapaport JL, Watt TL, et al. Homogeneously Alloyed CdS x Se1-x Nanocrystals: Synthesis, Characterization, and Composition/Size-Dependent Band Gap. 2006;128(37):12299–306. [DOI] [PubMed] [Google Scholar]
- 62.Regulacio MD, Han M-YJAocr. Composition-tunable alloyed semiconductor nanocrystals. 2010;43(5):621–30. [DOI] [PubMed] [Google Scholar]
- 63.Jang E, Jun S, Pu L. High quality CdSeS nanocrystals synthesized by facile single injection process and their electroluminescence. Chemical Communications. 2003(24):2964–5. [DOI] [PubMed] [Google Scholar]
- 64.Qian H, Qiu X, Li L, Ren J. Microwave-assisted aqueous synthesis: a rapid approach to prepare highly luminescent ZnSe (S) alloyed quantum dots. The Journal of Physical Chemistry B. 2006;110(18):9034–40. [DOI] [PubMed] [Google Scholar]
- 65.Regulacio MD, Han M-Y. Composition-tunable alloyed semiconductor nanocrystals. Accounts of chemical research. 2010;43(5):621–30. [DOI] [PubMed] [Google Scholar]
- 66.Zhong X, Feng Y, Knoll W, Han M. Alloyed zn x cd1-x s nanocrystals with highly narrow luminescence spectral width. Journal of the American Chemical Society. 2003;125(44):13559–63. [DOI] [PubMed] [Google Scholar]
- 67.Swafford LA, Weigand LA, Bowers MJ, McBride JR, Rapaport JL, Watt TL, et al. Homogeneously Alloyed CdS x Se1-x Nanocrystals: Synthesis, Characterization, and Composition/Size-Dependent Band Gap. Journal of the American Chemical Society. 2006;128(37):12299–306. [DOI] [PubMed] [Google Scholar]
- 68.Talapin DV, Lee J-S, Kovalenko MV, Shevchenko EV. Prospects of colloidal nanocrystals for electronic and optoelectronic applications. Chemical reviews. 2010;110(1):389–458. [DOI] [PubMed] [Google Scholar]
- 69.Drbohlavova J, Adam V, Kizek R, Hubalek J. Quantum dots—characterization, preparation and usage in biological systems. International journal of molecular sciences. 2009;10(2):656–73. [DOI] [PMC free article] [PubMed] [Google Scholar]
- 70.Hong NH. Chapter 1 - Introduction to Nanomaterials: Basic Properties, Synthesis, and Characterization. In: Hong NH, editor. Nano-Sized Multifunctional Materials. Micro and Nano Technologies: Elsevier; 2019. p. 1–19. [Google Scholar]
- 71.Linehan K, Doyle H. Size controlled synthesis of carbon quantum dots using hydride reducing agents. 2014;2(30):6025–31. [Google Scholar]
- 72.TingáZheng X, MingáLi C. Effect of particle shape on phagocytosis of CdTe quantum dot–cystine composites. MedChemComm. 2010;1(1):84–6. [Google Scholar]
- 73.Singh R, Bester G. Nanowire quantum dots as an ideal source of entangled photon pairs. Physical review letters. 2009;103(6):063601. [DOI] [PubMed] [Google Scholar]
- 74.Towe E, Pan D. Semiconductor quantum-dot nanostructures: Their application in a new class of infrared photodetectors. IEEE Journal of Selected Topics in Quantum Electronics. 2000;6(3):408–21. [Google Scholar]
- 75.Liu Y, Bose S, Fan W. Effect of size and shape on electronic and optical properties of CdSe quantum dots. Optik. 2018;155:242–50. [Google Scholar]
- 76.Costa-Fernández JM, Pereiro R, Sanz-Medel A. The use of luminescent quantum dots for optical sensing. TrAC Trends in Analytical Chemistry. 2006;25(3):207–18. [Google Scholar]
- 77.Dabbousi BO, Rodriguez-Viejo J, Mikulec FV, Heine JR, Mattoussi H, Ober R, et al. (CdSe) ZnS core− shell quantum dots: synthesis and characterization of a size series of highly luminescent nanocrystallites. The Journal of Physical Chemistry B. 1997;101(46):9463–75. [Google Scholar]
- 78.Chan WCW, Nie S. Quantum dot bioconjugates for ultrasensitive nonisotopic detection. Science. 1998;281(5385):2016–8. [DOI] [PubMed] [Google Scholar]
- 79.Sk MA, Ananthanarayanan A, Huang L, Lim KH, Chen P. Revealing the tunable photoluminescence properties of graphene quantum dots. Journal of Materials Chemistry C. 2014;2(34):6954–60. [Google Scholar]
- 80.Pedrueza E, Segura A, Abargues R, Bailach JB, Chervin JC, Martínez-Pastor JP. The effect of quantum size confinement on the optical properties of PbSe nanocrystals as a function of temperature and hydrostatic pressure. Nanotechnology. 2013;24(20):205701. [DOI] [PubMed] [Google Scholar]
- 81.Efros AL, Rosen M, Kuno M, Nirmal M, Norris DJ, Bawendi M. Band-edge exciton in quantum dots of semiconductors with a degenerate valence band: Dark and bright exciton states. Physical Review B. 1996;54(7):4843. [DOI] [PubMed] [Google Scholar]
- 82.Chen O, Wei H, Maurice A, Bawendi M, Reiss P. Pure colors from core–shell quantum dots. MRS bulletin. 2013;38(9):696–702. [Google Scholar]
- 83.LeCroy GE, Messina F, Sciortino A, Bunker CE, Wang P, Fernando KS, et al. Characteristic excitation wavelength dependence of fluorescence emissions in carbon “quantum” dots. 2017;121(50):28180–6. [Google Scholar]
- 84.Bera D, Qian L, Tseng T-K, Holloway PH. Quantum dots and their multimodal applications: a review. Materials. 2010;3(4):2260–345. [Google Scholar]
- 85.Sabah A, Tasleem S, Murtaza M, Nazir M, Rashid F. Effect of Polymer Capping on Photonic Multi-Core–Shell Quantum Dots CdSe/CdS/ZnS: Impact of Sunlight and Antibacterial Activity. 2020;124(16):9009–20. [Google Scholar]
- 86.Green M The nature of quantum dot capping ligands. 2010;20(28):5797–809. [Google Scholar]
- 87.Verma P, Pandey ACJOc. Capped semiconductor nanocrystals for device applications. 2011;284(3):881–4. [Google Scholar]
- 88.Hullavarad NV, Hullavarad SS. Optical properties of organic and inorganic capped CdS nanoparticles and the effects of x-ray irradiation on organic capped CdS nanoparticles. Journal of Vacuum Science & Technology A: Vacuum, Surfaces, and Films. 2008;26(4):1050–7. [Google Scholar]
- 89.Wang F, Tang R, Kao JLF, Dingman SD, Buhro WE. Spectroscopic Identification of Tri-n-octylphosphine Oxide (TOPO) Impurities and Elucidation of Their Roles in Cadmium Selenide Quantum-Wire Growth. Journal of the American Chemical Society. 2009;131(13):4983–94. [DOI] [PMC free article] [PubMed] [Google Scholar]
- 90.Luo X, Liu P, Truong NTN, Farva U, Park C. Photoluminescence blue-shift of CdSe nanoparticles caused by exchange of surface capping layer. The Journal of Physical Chemistry C. 2011;115(43):20817–23. [Google Scholar]
- 91.Petrie B, Barden R, Kasprzyk-Hordern B. A review on emerging contaminants in wastewaters and the environment: current knowledge, understudied areas and recommendations for future monitoring. Water research. 2015;72:3–27. [DOI] [PubMed] [Google Scholar]
- 92.Grandhi GK MA, Viswanatha R Understanding the Role of Surface Capping Ligands in Passivating the Quantum Dots Using Copper Dopants as Internal Sensor. 2016;120(35):19785–95. [Google Scholar]
- 93.Li Z, Peng X. Size/Shape-Controlled Synthesis of Colloidal CdSe Quantum Disks: Ligand and Temperature Effects. 2011;133(17):6578–86. [DOI] [PubMed] [Google Scholar]
- 94.Wang W, Banerjee S, Jia S, Steigerwald ML, Herman IP. Ligand Control of Growth, Morphology, and Capping Structure of Colloidal CdSe Nanorods. 2007;19(10):2573–80. [Google Scholar]
- 95.Patra S, Samanta A. Effect of Capping Agent and Medium on Light-Induced Variation of the Luminescence Properties of CdTe Quantum Dots: A Study Based on Fluorescence Correlation Spectroscopy, Steady State and Time-Resolved Fluorescence Techniques. 2014;118(31):18187–96. [Google Scholar]
- 96.Kortan AR, Hull R, Opila RL, Bawendi MG, Steigerwald ML, Carroll PJ, et al. Nucleation and growth of CdSe on ZnS quantum crystallite seeds, and vice versa, in inverse micelle media. 1990;112(4):1327–32 %J Journal of the American Chemical Society. [Google Scholar]
- 97.Murphy CJ. Peer reviewed: optical sensing with quantum dots: ACS Publications; 2002. [DOI] [PubMed] [Google Scholar]
- 98.Labeb M, Sakr A-H, Soliman M, Abdel-Fattah TM, Ebrahim SJOM. Effect of capping agent on selectivity and sensitivity of CdTe quantum dots optical sensor for detection of mercury ions. 2018;79:331–5. [Google Scholar]
- 99.Liu S, Wang H, Cheng Z, Liu HJS, Chemical AB. Hexametaphosphate-capped quantum dots as fluorescent probes for detection of calcium ion and fluoride. 2016;232:306–12. [Google Scholar]
- 100.Niu Q, Gao K, Lin Z, Wu W. Amine-capped carbon dots as a nanosensor for sensitive and selective detection of picric acid in aqueous solution via electrostatic interaction. 2013;5(21):6228–33. [Google Scholar]
- 101.Ramalingam G, Kathirgamanathan P, Manivannan N, Kasinathan K. Quantum Confinement Effect of 2D Nanomaterials. Quantum Dots-Fundamental and Applications: IntechOpen; 2020. [Google Scholar]
- 102.Ilaiyaraja N, Fathima SJ, Khanum F. Quantum dots: a novel fluorescent probe for bioimaging and drug delivery applications. Inorganic Frameworks as Smart Nanomedicines: Elsevier; 2018. p. 529–63. [Google Scholar]
- 103.Li C-Y, Karna SK, Wang C-W, Li W-HJIjoms. Spin polarization and quantum spins in Au nanoparticles. 2013;14(9):17618–42. [DOI] [PMC free article] [PubMed] [Google Scholar]
- 104.Edvinsson T Optical quantum confinement and photocatalytic properties in two-, one-and zero-dimensional nanostructures. R Soc Open Sci. 2018;5(9):180387. [DOI] [PMC free article] [PubMed] [Google Scholar]
- 105.Hardman R A toxicologic review of quantum dots: Toxicity depends on physicochemical and environmental factors. Environ Health Perspect. 2006;114(2):165–72. [DOI] [PMC free article] [PubMed] [Google Scholar]
- 106.Ranjbar-Navazi Z, Omidi Y, Eskandani M, Davaran S. Cadmium-free quantum dot-based theranostics. 2019;118:386–400. [Google Scholar]
- 107.Sargent EH. Colloidal quantum dot solar cells. 2012;6(3):133–5. [DOI] [PubMed] [Google Scholar]
- 108.Shang Y, Ning ZJNSR. Colloidal quantum-dots surface and device structure engineering for high-performance light-emitting diodes. 2017;4(2):170–83. [Google Scholar]
- 109.Chang J, Waclawik ER. Colloidal semiconductor nanocrystals: controlled synthesis and surface chemistry in organic media. RSC Advances. 2014;4(45):23505–27. [Google Scholar]
- 110.Valizadeh A, Mikaeili H, Samiei M, Farkhani SM, Zarghami N, Akbarzadeh A, et al. Quantum dots: synthesis, bioapplications, and toxicity. Nanoscale research letters. 2012;7(1):1–14. [DOI] [PMC free article] [PubMed] [Google Scholar]
- 111.Dey S, Govindaraj A, Biswas K, Rao CNR. Luminescence properties of boron and nitrogen doped graphene quantum dots prepared from arc-discharge-generated doped graphene samples. Chemical Physics Letters. 2014;595:203–8. [Google Scholar]
- 112.Xu X, Ray R, Gu Y, Ploehn HJ, Gearheart L, Raker K, et al. Electrophoretic analysis and purification of fluorescent single-walled carbon nanotube fragments. Journal of the American Chemical Society. 2004;126(40):12736–7. [DOI] [PubMed] [Google Scholar]
- 113.Zuo P, Lu X, Sun Z, Guo Y, He H. A review on syntheses, properties, characterization and bioanalytical applications of fluorescent carbon dots. Microchimica Acta. 2016;183(2):519–42. [Google Scholar]
- 114.Kalluri A, Debnath D, Dharmadhikari B, Patra P. Graphene quantum dots: Synthesis and applications. Methods in enzymology. 2018;609:335–54. [DOI] [PubMed] [Google Scholar]
- 115.Sun H, Ji H, Ju E, Guan Y, Ren J, Qu X. Synthesis of Fluorinated and Nonfluorinated Graphene Quantum Dots through a New Top‐Down Strategy for Long‐Time Cellular Imaging. Chemistry–A European Journal. 2015;21(9):3791–7. [DOI] [PubMed] [Google Scholar]
- 116.Pan D, Zhang J, Li Z, Wu M. Hydrothermal route for cutting graphene sheets into blue‐luminescent graphene quantum dots. Advanced materials. 2010;22(6):734–8. [DOI] [PubMed] [Google Scholar]
- 117.Pan D, Guo L, Zhang J, Xi C, Xue Q, Huang H, et al. Cutting sp 2 clusters in graphene sheets into colloidal graphene quantum dots with strong green fluorescence. J Mater Chem. 2012;22(8):3314–8. [Google Scholar]
- 118.Zhu S, Tang S, Zhang J, Yang B. Control the size and surface chemistry of graphene for the rising fluorescent materials. 2012;48(38):4527–39. [DOI] [PubMed] [Google Scholar]
- 119.Kong HS, Kim BJ, Kang KS. Room temperature photoluminescence of PbS quantum dots: Capping agent and thermal effect. Luminescence. 2019;34(3):387–90. [DOI] [PubMed] [Google Scholar]
- 120.Ray SC, Saha A, Jana NR, Sarkar R. Fluorescent carbon nanoparticles: synthesis, characterization, and bioimaging application. The Journal of Physical Chemistry C. 2009;113(43):18546–51. [Google Scholar]
- 121.Kim HH, Lee YJ, Park C, Yu S, Won SO, Seo WS, et al. Bottom‐Up Synthesis of Carbon Quantum Dots With High Performance Photo‐and Electroluminescence. Particle & Particle Systems Characterization. 2018;35(7):1800080. [Google Scholar]
- 122.Yadegari A, Khezri J, Esfandiari S, Mahdavi H, Karkhane AA, Rahighi R, et al. Bottom-up synthesis of nitrogen and oxygen co-decorated carbon quantum dots with enhanced DNA plasmid expression. Colloids and Surfaces B: Biointerfaces. 2019;184:110543. [DOI] [PubMed] [Google Scholar]
- 123.Xia C, Zhu S, Feng T, Yang M, Yang B. Evolution and synthesis of carbon dots: from carbon dots to carbonized polymer dots. Advanced Science. 2019;6(23):1901316. [DOI] [PMC free article] [PubMed] [Google Scholar]
- 124.Bertino MF, Gadipalli RR, Martin LA, Rich LE, Yamilov A, Heckman BR, et al. Quantum dots by ultraviolet and x-ray lithography. Nanotechnology. 2007;18(31):315603. [Google Scholar]
- 125.Sharma A, Das J. Small molecules derived carbon dots: synthesis and applications in sensing, catalysis, imaging, and biomedicine. Journal of nanobiotechnology. 2019;17(1):1–24. [DOI] [PMC free article] [PubMed] [Google Scholar]
- 126.Elugoke SE, Adekunle AS, Fayemi OE, Mamba BB, Sherif E-SM, Ebenso EE. Carbon-Based Quantum Dots for Electrochemical Detection of Monoamine Neurotransmitters. Biosensors. 2020;10(11):162. [DOI] [PMC free article] [PubMed] [Google Scholar]
- 127.Feng X, Zhang Y. A simple and green synthesis of carbon quantum dots from coke for white light-emitting devices. RSC advances. 2019;9(58):33789–93. [DOI] [PMC free article] [PubMed] [Google Scholar]
- 128.Liu X, Hao J, Liu J, Tao H, editors. Green synthesis of carbon quantum dots from lignite coal and the application in Fe3+ detection 2018: IOP Publishing. [Google Scholar]
- 129.Wang Y, Xia Y. Bottom-up and top-down approaches to the synthesis of monodispersed spherical colloids of low melting-point metals. Nano Lett. 2004;4(10):2047–50. [Google Scholar]
- 130.de la Calle I, Romero-Rivas V. Chapter 9 - The Role of Nanomaterials in Analytical Chemistry: Trace Metal Analysis. In: Mohan Bhagyaraj S, Oluwafemi OS, Kalarikkal N, Thomas S, editors. Applications of Nanomaterials. Micro and Nano Technologies: Woodhead Publishing; 2018. p. 251–301. [Google Scholar]
- 131.Morris-Cohen AJ, Frederick MT, Lilly GD, McArthur EA, Weiss EA. Organic surfactant-controlled composition of the surfaces of CdSe quantum dots. The Journal of Physical Chemistry Letters. 2010;1(7):1078–81. [Google Scholar]
- 132.Morris-Cohen AJ, Malicki M, Peterson MD, Slavin JWJ, Weiss EA. Chemical, structural, and quantitative analysis of the ligand shells of colloidal quantum dots. Chemistry of Materials. 2013;25(8):1155–65. [Google Scholar]
- 133.Resch-Genger U, Grabolle M, Cavaliere-Jaricot S, Nitschke R, Nann T. Quantum dots versus organic dyes as fluorescent labels. Nature methods. 2008;5(9):763. [DOI] [PubMed] [Google Scholar]
- 134.Dai X, Deng Y, Peng X, Jin Y. Quantum‐dot light‐emitting diodes for large‐area displays: towards the dawn of commercialization. Advanced materials. 2017;29(14):1607022. [DOI] [PubMed] [Google Scholar]
- 135.Pu Y, Lin L, Wang D, Wang J-X, Qian J, Chen J-F. Green synthesis of highly dispersed ytterbium and thulium co-doped sodium yttrium fluoride microphosphors for in situ light upconversion from near-infrared to blue in animals. J Colloid Interface Sci. 2018;511:243–50. [DOI] [PubMed] [Google Scholar]
- 136.Pillai KV, Gray PJ, Tien C-C, Bleher R, Sung L-P, Duncan TV. Environmental release of core–shell semiconductor nanocrystals from free-standing polymer nanocomposite films. Environmental Science: Nano. 2016;3(3):657–69. [DOI] [PMC free article] [PubMed] [Google Scholar]
- 137.Piccinno F, Gottschalk F, Seeger S, Nowack B. Industrial production quantities and uses of ten engineered nanomaterials in Europe and the world. Journal of Nanoparticle Research. 2012;14(9):1109. [Google Scholar]
- 138.Future-Markets. Future Markets Technology Reports: The Global Market for Quantum Dots. 2019.
- 139.Parliament E Objection to a delegated act: exemption for cadmium in illumination and display lighting applications Strasbourg, France: European Parliament (EP); 2016. [Available from: https://ec.europa.eu/environment/consultations/rohs7_en.htm. [Google Scholar]
- 140.Jo J-H, Jo D-Y, Lee S-H, Yoon S-Y, Lim H-B, Lee B-J, et al. InP-based quantum dots having an InP core, composition-gradient ZnSeS inner shell, and ZnS outer shell with sharp, bright emissivity, and blue absorptivity for display devices. ACS Applied Nano Materials. 2020;3(2):1972–80. [Google Scholar]
- 141.Jang E, Kim Y, Won Y-H, Jang H, Choi S-M. Environmentally friendly InP-based quantum dots for efficient wide color gamut displays. ACS Energy Letters. 2020;5(4):1316–27. [Google Scholar]
- 142.Brus LE. Electron–electron and electron‐hole interactions in small semiconductor crystallites: The size dependence of the lowest excited electronic state. The Journal of chemical physics. 1984;80(9):4403–9. [Google Scholar]
- 143.Reiss P, Carriere M, Lincheneau C, Vaure L, Tamang S. Synthesis of semiconductor nanocrystals, focusing on nontoxic and earth-abundant materials. Chemical reviews. 2016;116(18):10731–819. [DOI] [PubMed] [Google Scholar]
- 144.Won Y-H, Cho O, Kim T, Chung D-Y, Kim T, Chung H, et al. Highly efficient and stable InP/ZnSe/ZnS quantum dot light-emitting diodes. Nature. 2019;575(7784):634–8. [DOI] [PubMed] [Google Scholar]
- 145.Sadeghi S, Abkenar SK, Ow-Yang CW, Nizamoglu S. Efficient white LEDs using liquid-state magic-sized CdSe quantum dots. Scientific reports. 2019;9(1):1–9. [DOI] [PMC free article] [PubMed] [Google Scholar]
- 146.Khan N, Abas N. Comparative study of energy saving light sources. Renewable and sustainable energy reviews. 2011;15(1):296–309. [Google Scholar]
- 147.Pimputkar S, Speck JS, DenBaars SP, Nakamura S. Prospects for LED lighting. Nature photonics. 2009;3(4):180–2. [Google Scholar]
- 148.Liu J, Katahara J, Li G, Coe-Sullivan S, Hurt RH. Degradation Products from Consumer Nanocomposites: A Case Study on Quantum Dot Lighting. Environ Sci Technol. 2012;46(6):3220–7. [DOI] [PMC free article] [PubMed] [Google Scholar]
- 149.Wang G, Li Z, Ma N. Next-generation DNA-functionalized quantum dots as biological sensors. ACS chemical biology. 2017;13(7):1705–13. [DOI] [PubMed] [Google Scholar]
- 150.Lin Z, Pan D, Hu T, Liu Z, Su X. A near-infrared fluorescent bioassay for thrombin using aptamer-modified CuInS 2 quantum dots. Microchimica Acta. 2015;182(11–12):1933–9. [Google Scholar]
- 151.Zhang X, Liu M, Liu H, Zhang S. Low-toxic Ag2S quantum dots for photoelectrochemical detection glucose and cancer cells. Biosensors and Bioelectronics. 2014;56:307–12. [DOI] [PubMed] [Google Scholar]
- 152.Cui R, Gu Y-P, Bao L, Zhao J-Y, Qi B-P, Zhang Z-L, et al. Near-infrared electrogenerated chemiluminescence of ultrasmall Ag2Se quantum dots for the detection of dopamine. Analytical chemistry. 2012;84(21):8932–5. [DOI] [PubMed] [Google Scholar]
- 153.Yildiz HB, Freeman R, Gill R, Willner I. Electrochemical, Photoelectrochemical, and Piezoelectric Analysis of Tyrosinase Activity by Functionalized Nanoparticles. Analytical Chemistry. 2008;80(8):2811–6. [DOI] [PubMed] [Google Scholar]
- 154.Nakanishi T, Ohtani B, Uosaki K. Fabrication and characterization of CdS-nanoparticle mono-and multilayers on a self-assembled monolayer of alkanedithiols on gold. The Journal of Physical Chemistry B. 1998;102(9):1571–7. [Google Scholar]
- 155.Bakkers E, Roest A, Marsman A, Jenneskens L, De Jong-Van Steensel L, Kelly J, et al. Characterization of photoinduced electron tunneling in gold/SAM/Q-CdSe systems by time-resolved photoelectrochemistry. The Journal of Physical Chemistry B. 2000;104(31):7266–72. [Google Scholar]
- 156.Yue Z, Lisdat F, Parak WJ, Hickey SG, Tu L, Sabir N, et al. Quantum-dot-based photoelectrochemical sensors for chemical and biological detection. ACS applied materials & interfaces. 2013;5(8):2800–14. [DOI] [PubMed] [Google Scholar]
- 157.Mandal L, Verma B, Rani J, Patel PK. Progressive advancement of ZnS-based quantum dot LED. Optical and Quantum Electronics. 2021;53(1):1–20. [Google Scholar]
- 158.Jin X, Chen W, Li X, Guo H, Li Q, Zhang Z, et al. Thick-shell CdZnSe/ZnSe/ZnS quantum dots for bright white light-emitting diodes. Journal of Luminescence. 2021;229:117670. [Google Scholar]
- 159.Osman H, Li W, Zhang X, Chun F, Deng W, Moatasim M, et al. One-step hot injection synthesis of gradient alloy CdxZn1-xSySe1-y quantum dots with large-span self-regulating ability. Journal of Luminescence. 2019;206:565–70. [Google Scholar]
- 160.Liu F, Ding C, Zhang Y, Kamisaka T, Zhao Q, Luther JM, et al. GeI2 additive for high optoelectronic quality CsPbI3 quantum dots and their application in photovoltaic devices. Chemistry of Materials. 2019;31(3):798–807. [Google Scholar]
- 161.Zhou F, Li Z, Chen H, Wang Q, Ding L, Jin Z. Application of perovskite nanocrystals (NCs)/Quantum dots (QDs) in solar cells. Nano Energy. 2020:104757. [Google Scholar]
- 162.Melendres-Sánchez J, López-Delgado R, Saavedra-Rodríguez G, Carrillo-Torres R, Sánchez-Zeferino R, Ayón A, et al. Zinc sulfide quantum dots coated with PVP: applications on commercial solar cells. Journal of Materials Science: Materials in Electronics.1–9. [Google Scholar]
- 163.Ma Z, Wang L, Ji X, Chen X, Shi Z. Lead-Free Metal Halide Perovskites and Perovskite Derivatives as an Environmentally Friendly Emitter for Light-Emitting Device Applications. The Journal of Physical Chemistry Letters. 2020;11(14):5517–30. [DOI] [PubMed] [Google Scholar]
- 164.Nasr S, Hidouri T, Zouidi F. New Strategy against COVID-19: L-Serine Doped QDs for Fast Detection of COVID-19 and Blocking of S-Protein. ECS Journal of Solid State Science and Technology. 2020;9(10):106002. [Google Scholar]
- 165.Manivannan S, Ponnuchamy K. Quantum dots as a promising agent to combat COVID‐19. Applied organometallic chemistry. 2020;34(10):e5887. [DOI] [PMC free article] [PubMed] [Google Scholar]
- 166.Von der Kammer F, Ferguson PL, Holden PA, Masion A, Rogers KR, Klaine SJ, et al. Analysis of engineered nanomaterials in complex matrices (environment and biota): general considerations and conceptual case studies. 2012;31(1):32–49. [DOI] [PubMed] [Google Scholar]
- 167.Gottschalk F, Lassen C, Kjoelholt J, Christensen F, Nowack B. Modeling flows and concentrations of nine engineered nanomaterials in the Danish environment. International journal of environmental research public health. 2015;12(5):5581–602. [DOI] [PMC free article] [PubMed] [Google Scholar]
- 168.Mahendra S, Zhu HG, Colvin VL, Alvarez PJ. Quantum Dot Weathering Results in Microbial Toxicity. Environ Sci Technol. 2008;42(24):9424–30. [DOI] [PubMed] [Google Scholar]
- 169.Zhang S, Jiang Y, Chen C-S, Spurgin J, Schwehr KA, Quigg A, et al. Aggregation, dissolution, and stability of quantum dots in marine environments: importance of extracellular polymeric substances. Environ Sci Technol. 2012;46(16):8764–72. [DOI] [PubMed] [Google Scholar]
- 170.Wang Y, Nowack BJEp. Dynamic probabilistic material flow analysis of nano-SiO2, nano iron oxides, nano-CeO2, nano-Al2O3, and quantum dots in seven European regions. 2018;235:589–601. [DOI] [PubMed] [Google Scholar]
- 171.Gallagher MJ, Buchman JT, Qiu TA, Zhi B, Lyons TY, Landy KM, et al. Release, detection and toxicity of fragments generated during artificial accelerated weathering of CdSe/ZnS and CdSe quantum dot polymer composites. Environmental Science: Nano. 2018;5(7):1694–710. [Google Scholar]
- 172.Part F, Zaba C, Bixner O, Zafiu C, Hann S, Sinner E-K, et al. Traceability of fluorescent engineered nanomaterials and their fate in complex liquid waste matrices. Environ Pollut. 2016;214:795–805. [DOI] [PubMed] [Google Scholar]
- 173.Chopra SS, Bi Y, Brown FC, Theis TL, Hristovski KD, Westerhoff P. Interdisciplinary collaborations to address the uncertainty problem in life cycle assessment of nano-enabled products: case of the quantum dot-enabled display. Environmental Science: Nano. 2019;6(11):3256–67. [Google Scholar]
- 174.Brown FC, Bi Y, Chopra SS, Hristovski KD, Westerhoff P, Theis TL. End-of-Life Heavy Metal Releases from Photovoltaic Panels and Quantum Dot Films: Hazardous Waste Concerns or Not? ACS Sustainable Chemistry & Engineering. 2018;6(7):9369–74. [Google Scholar]
- 175.Miller RJ, Adeleye AS, Page HM, Kui L, Lenihan HS, Keller AA. Nano and traditional copper and zinc antifouling coatings: metal release and impact on marine sessile invertebrate communities. Journal of Nanoparticle Research. 2020;22(5):129. [Google Scholar]
- 176.Keller AA, McFerran S, Lazareva A, Suh S. Global life cycle releases of engineered nanomaterials. 2013;15(6):1692. [Google Scholar]
- 177.Lazareva A, Keller AAJASC, Engineering. Estimating potential life cycle releases of engineered nanomaterials from wastewater treatment plants. 2014;2(7):1656–65. [Google Scholar]
- 178.Are new quantum dot TVs bad for the environment? [press release]. 2015.
- 179.Fthenakis VM. Life cycle impact analysis of cadmium in CdTe PV production. Renewable and Sustainable Energy Reviews. 2004;8(4):303–34. [Google Scholar]
- 180.Cyrs WD, Avens HJ, Capshaw ZA, Kingsbury RA, Sahmel J, Tvermoes BE. Landfill waste and recycling: Use of a screening-level risk assessment tool for end-of-life cadmium telluride (CdTe) thin-film photovoltaic (PV) panels. Energy Policy. 2014;68:524–33. [Google Scholar]
- 181.Lee C, Huffman G, Nalesnik RJEs, technology. Medical waste management. 1991;25(3):360–3. [Google Scholar]
- 182.Vejerano EP, Leon EC, Holder AL, Marr LC. Characterization of particle emissions and fate of nanomaterials during incineration. Environmental Science: Nano. 2014;1(2):133–43. [Google Scholar]
- 183.Aich N, Kordas K, Ahmed SI, Sabo-Attwood T. The Hidden Risks of E-Waste: Perspectives from Environmental Engineering, Epidemiology, Environmental Health, and Human–Computer Interaction. Transforming Global Health: Springer; 2020. p. 161–78. [Google Scholar]
- 184.Smith T, Director SE. Corporate strategies for electronics recycling: a tale of two systems. Silicon Valley Toxics Coalition, San Jose. 2003. [Google Scholar]
- 185.Derfus AM, Chan WCW, Bhatia SN. Probing the cytotoxicity of semiconductor quantum dots. Nano Lett. 2004;4(1):11–8. [DOI] [PMC free article] [PubMed] [Google Scholar]
- 186.Li Y, Zhang W, Li K, Yao Y, Niu J, Chen Y. Oxidative dissolution of polymer-coated CdSe/ZnS quantum dots under UV irradiation: Mechanisms and kinetics. 2012;164:259–66. [DOI] [PubMed] [Google Scholar]
- 187.Kumar A, Zhou C. The race to replace tin-doped indium oxide: which material will win? ACS nano. 2010;4(1):11–4. [DOI] [PubMed] [Google Scholar]
- 188.Domingos RF, Franco C, Pinheiro JP. Stability of core/shell quantum dots—role of pH and small organic ligands. Environ Sci Pollut Res. 2013;20(7):4872–80. [DOI] [PubMed] [Google Scholar]
- 189.Xiao Y, Ho KT, Burgess RM, Cashman M. Aggregation, Sedimentation, Dissolution, and Bioavailability of Quantum Dots in Estuarine Systems. Environ Sci Technol. 2017;51(3):1357–63. [DOI] [PMC free article] [PubMed] [Google Scholar]
- 190.Paydary P, Larese-Casanova P. Water chemistry influences on long-term dissolution kinetics of CdSe/ZnS quantum dots. Journal of Environmental Sciences. 2020;90:216–33. [DOI] [PubMed] [Google Scholar]
- 191.Adeleye AS, Stevenson LM, Su Y, Nisbet RM, Zhang Y, Keller AAJEs, et al. Influence of phytoplankton on fate and effects of modified zerovalent iron nanoparticles. 2016;50(11):5597–605. [DOI] [PubMed] [Google Scholar]
- 192.Zeng C, Ramos-Ruiz A, Field JA, Sierra-Alvarez RJJoem. Cadmium telluride (CdTe) and cadmium selenide (CdSe) leaching behavior and surface chemistry in response to pH and O2. 2015;154:78–85. [DOI] [PubMed] [Google Scholar]
- 193.Hedberg J, Blomberg E, Odnevall Wallinder I. In the search for nanospecific effects of dissolution of metallic nanoparticles at freshwater-like conditions: A critical review. Environ Sci Technol. 2019;53(8):4030–44. [DOI] [PubMed] [Google Scholar]
- 194.Priester JH, Stoimenov PK, Mielke RE, Webb SM, Ehrhardt C, Zhang JP, et al. Effects of soluble cadmium salts versus CdSe quantum dots on the growth of planktonic Pseudomonas aeruginosa. 2009;43(7):2589–94. [DOI] [PubMed] [Google Scholar]
- 195.Vučemilović M, Vukelić N, Rajh TJJoP, Chemistry PA. Solubility and photocorrosion of small CdS particles. 1988;42(1):157–67. [Google Scholar]
- 196.Adeleye AS, Conway JR, Perez T, Rutten P, Keller AA. Influence of extracellular polymeric substances on the long-term fate, dissolution, and speciation of copper-based nanoparticles. Environ Sci Technol. 2014;48(21):12561–8. [DOI] [PubMed] [Google Scholar]
- 197.Adeleye AS, Keller AAJEs, technology. Interactions between algal extracellular polymeric substances and commercial TiO2 nanoparticles in aqueous media. 2016;50(22):12258–65. [DOI] [PubMed] [Google Scholar]
- 198.Sunda WG, Lewis JAM. Effect of complexation by natural organic ligands on the toxicity of copper to a unicellular alga, Monochrysis lutheri1. 1978;23(5):870–6. [Google Scholar]
- 199.Wu X, Liu H, Liu J, Haley KN, Treadway JA, Larson JP, et al. Immunofluorescent labeling of cancer marker Her2 and other cellular targets with semiconductor quantum dots. 2003;21(1):41–6. [DOI] [PubMed] [Google Scholar]
- 200.Jaiswal JK, Mattoussi H, Mauro JM, Simon SMJNb. Long-term multiple color imaging of live cells using quantum dot bioconjugates. 2003;21(1):47–51. [DOI] [PubMed] [Google Scholar]
- 201.Mulvihill MJ, Habas SE, Jen-La Plante I, Wan J, Mokari TJCoM. Influence of size, shape, and surface coating on the stability of aqueous suspensions of CdSe nanoparticles. 2010;22(18):5251–7. [Google Scholar]
- 202.Morelli E, Cioni P, Posarelli M, Gabellieri EJAt. Chemical stability of CdSe quantum dots in seawater and their effects on a marine microalga. 2012;122:153–62. [DOI] [PubMed] [Google Scholar]
- 203.Wang H, Adeleye AS, Huang Y, Li F, Keller AAJAic, Science i. Heteroaggregation of nanoparticles with biocolloids and geocolloids. 2015;226:24–36. [DOI] [PubMed] [Google Scholar]
- 204.Conway JR, Adeleye AS, Gardea-Torresdey J, Keller AA. Aggregation, dissolution, and transformation of copper nanoparticles in natural waters. Environ Sci Technol. 2015;49(5):2749–56. [DOI] [PubMed] [Google Scholar]
- 205.Keller AA, Adeleye AS, Conway JR, Garner KL, Zhao L, Cherr GN, et al. Comparative environmental fate and toxicity of copper nanomaterials. 2017;7:28–40. [Google Scholar]
- 206.Rochira JA, Gudheti MV, Gould TJ, Laughlin RR, Nadeau JL, Hess STJTJoPCC. Fluorescence intermittency limits brightness in CdSe/ZnS nanoparticles quantified by fluorescence correlation spectroscopy. 2007;111(4):1695–708. [Google Scholar]
- 207.Rocha TL, Gomes T, Cardoso C, Letendre J, Pinheiro JP, Sousa VS, et al. Immunocytotoxicity, cytogenotoxicity and genotoxicity of cadmium-based quantum dots in the marine mussel Mytilus galloprovincialis. Marine environmental research. 2014;101:29–37. [DOI] [PubMed] [Google Scholar]
- 208.Bayati M, Dai J, Zambrana A, Rees C, de Cortalezzi MF. Effect of water chemistry on the aggregation and photoluminescence behavior of carbon dots. Journal of Environmental Sciences. 2018;65:223–35. [DOI] [PubMed] [Google Scholar]
- 209.Elimelech M, Gregory J, Jia X. Particle deposition and aggregation: measurement, modelling and simulation: Butterworth-Heinemann; 2013. [Google Scholar]
- 210.Liu X, Li J, Huang Y, Wang X, Zhang X, Wang XJEs, et al. Adsorption, aggregation, and deposition behaviors of carbon dots on minerals. 2017;51(11):6156–64. [DOI] [PubMed] [Google Scholar]
- 211.Li Q, Chen B, Xing BJEs, technology. Aggregation kinetics and self-assembly mechanisms of graphene quantum dots in aqueous solutions: Cooperative effects of pH and electrolytes. 2017;51(3):1364–76. [DOI] [PubMed] [Google Scholar]
- 212.Frank BP, Sigmon LR, Deline AR, Lankone RS, Gallagher MJ, Zhi B, et al. Photochemical Transformations of Carbon Dots in Aqueous Environments. Environ Sci Technol. 2020;54(7):4160–70. [DOI] [PubMed] [Google Scholar]
- 213.Dager A, Uchida T, Maekawa T, Tachibana M. Synthesis and characterization of mono-disperse carbon quantum dots from fennel seeds: photoluminescence analysis using machine learning. Scientific reports. 2019;9(1):1–12. [DOI] [PMC free article] [PubMed] [Google Scholar]
- 214.Van Sark WG, Frederix PL, Bol AA, Gerritsen HC, Meijerink AJC. Blueing, bleaching, and blinking of single CdSe/ZnS quantum dots. 2002;3(10):871–9. [Google Scholar]
- 215.Pechstedt K, Whittle T, Baumberg J, Melvin T. Photoluminescence of colloidal CdSe/ZnS quantum dots: the critical effect of water molecules. The Journal of Physical Chemistry C. 2010;114(28):12069–77. [Google Scholar]
- 216.Van Sark WG, Frederix PL, Van den Heuvel DJ, Gerritsen HC, Bol AA, Van Lingen JN, et al. Photooxidation and photobleaching of single CdSe/ZnS quantum dots probed by room-temperature time-resolved spectroscopy. 2001;105(35):8281–4. [Google Scholar]
- 217.Durn J, Guindo M, Delgado AJJoc, science i. Electrophoretic properties of colloidal dispersions of monodisperse zinc sulfide: effects of potential-determining ions and surface oxidation. 1995;173(2):436–42. [Google Scholar]
- 218.Chen X, Fang G, Liu C, Dionysiou DD, Wang X, Zhu C, et al. Cotransformation of carbon dots and contaminant under light in aqueous solutions: a mechanistic study. Environ Sci Technol. 2019;53(11):6235–44. [DOI] [PubMed] [Google Scholar]
- 219.Adeleye AS, Ho KT, Zhang M, Li Y, Burgess RM. Fate and transformation of graphene oxide in estuarine and marine waters. Environ Sci Technol. 2019;53(10):5858–67. [DOI] [PMC free article] [PubMed] [Google Scholar]
- 220.Pakarinen K, Petersen EJ, Alvila L, Waissi‐Leinonen GC, Akkanen J, Leppänen MT, et al. A screening study on the fate of fullerenes (nC60) and their toxic implications in natural freshwaters. Environmental toxicology and chemistry. 2013;32(6):1224–32. [DOI] [PubMed] [Google Scholar]
- 221.Wang Y, Nowack B. Environmental risk assessment of engineered nano-SiO2, nano iron oxides, nano-CeO2, nano-Al2O3, and quantum dots. Environ Toxicol Chem. 2018;37(5):1387–95. [DOI] [PubMed] [Google Scholar]
- 222.Bouldin JL, Ingle TM, Sengupta A, Alexander R, Hannigan RE, Buchanan RA. Aqueous toxicity and food chain transfer of quantum dots™ in freshwater algae and Ceriodaphnia dubia. 2008;27(9):1958–63. [DOI] [PMC free article] [PubMed] [Google Scholar]
- 223.Al-Salim N, Barraclough E, Burgess E, Clothier B, Deurer M, Green S, et al. Quantum dot transport in soil, plants, and insects. Science of The Total Environment. 2011;409(17):3237–48. [DOI] [PubMed] [Google Scholar]
- 224.Navarro DA, Bisson MA, Aga DS. Investigating uptake of water-dispersible CdSe/ZnS quantum dot nanoparticles by Arabidopsis thaliana plants. J Hazard Mater. 2012;211:427–35. [DOI] [PubMed] [Google Scholar]
- 225.Zhang D, Hua T, Xiao F, Chen C, Gersberg RM, Liu Y, et al. Uptake and accumulation of CuO nanoparticles and CdS/ZnS quantum dot nanoparticles by Schoenoplectus tabernaemontani in hydroponic mesocosms. Ecological Engineering. 2014;70:114–23. [Google Scholar]
- 226.Modlitbová P, Pořízka P, Novotný K, Drbohlavová J, Chamradová I, Farka Z, et al. Short-term assessment of cadmium toxicity and uptake from different types of Cd-based Quantum Dots in the model plant Allium cepa L. Ecotox Environ Safe. 2018;153:23–31. [DOI] [PubMed] [Google Scholar]
- 227.Modlitbová P, Novotný K, Pořízka P, Klus J, Lubal P, Zlámalová-Gargošová H, et al. Comparative investigation of toxicity and bioaccumulation of Cd-based quantum dots and Cd salt in freshwater plant Lemna minor L. Ecotox Environ Safe. 2018;147:334–41. [DOI] [PubMed] [Google Scholar]
- 228.Xu M, Deng G, Liu S, Chen S, Cui D, Yang L, et al. Free cadmium ions released from CdTe-based nanoparticles and their cytotoxicity on Phaeodactylum tricornutum. Metallomics. 2010;2(7):469–73. [DOI] [PubMed] [Google Scholar]
- 229.Jurgelėnė Ž, Kazlauskienė N, Montvydienė D, Kulvietis V, Rotomskis R, Jokšas K. Embryotoxicity of Quantum Dots in Rainbow Trout Oncorhynchus mykiss During the Hatching Period. Bulletin of Environmental Contamination and Toxicology. 2018;101(2):191–6. [DOI] [PubMed] [Google Scholar]
- 230.Boyes WK, Thornton BLM, Al-Abed SR, Andersen CP, Bouchard DC, Burgess RM, et al. A comprehensive framework for evaluating the environmental health and safety implications of engineered nanomaterials. Critical Reviews in Toxicology. 2017;47(9):771–814. [DOI] [PubMed] [Google Scholar]
- 231.Bundschuh M, Filser J, Lüderwald S, McKee MS, Metreveli G, Schaumann GE, et al. Nanoparticles in the environment: where do we come from, where do we go to? Environmental Sciences Europe. 2018;30(1):6. [DOI] [PMC free article] [PubMed] [Google Scholar]
- 232.Navarro DAG, Watson DF, Aga DS, Banerjee S. Natural Organic Matter-Mediated Phase Transfer of Quantum Dots in the Aquatic Environment. Environ Sci Technol. 2009;43(3):677–82. [DOI] [PubMed] [Google Scholar]
- 233.Canesi L, Ciacci C, Fabbri R, Marcomini A, Pojana G, Gallo G. Bivalve molluscs as a unique target group for nanoparticle toxicity. Marine Environmental Research. 2012;76:16–21. [DOI] [PubMed] [Google Scholar]
- 234.Holbrook RD, Murphy KE, Morrow JB, Cole KD. Trophic transfer of nanoparticles in a simplified invertebrate food web. Nature Nanotechnology. 2008;3(6):352–5. [DOI] [PubMed] [Google Scholar]
- 235.Lee W-M, An Y-J. Evidence of three-level trophic transfer of quantum dots in an aquatic food chain by using bioimaging. Nanotoxicology. 2015;9(4):407–12. [DOI] [PubMed] [Google Scholar]
- 236.Gupta GS, Kumar A, Senapati VA, Pandey AK, Shanker R, Dhawan A. Laboratory Scale Microbial Food Chain To Study Bioaccumulation, Biomagnification, and Ecotoxicity of Cadmium Telluride Quantum Dots. Environ Sci Technol. 2017;51(3):1695–706. [DOI] [PubMed] [Google Scholar]
- 237.Werlin R, Priester JH, Mielke RE, Krämer S, Jackson S, Stoimenov PK, et al. Biomagnification of cadmium selenide quantum dots in a simple experimental microbial food chain. Nature Nanotechnology. 2011;6(1):65–71. [DOI] [PubMed] [Google Scholar]
- 238.Koo Y, Wang J, Zhang Q, Zhu H, Chehab EW, Colvin VL, et al. Fluorescence Reports Intact Quantum Dot Uptake into Roots and Translocation to Leaves of Arabidopsis thaliana and Subsequent Ingestion by Insect Herbivores. Environ Sci Technol. 2015;49(1):626–32. [DOI] [PubMed] [Google Scholar]
- 239.Lewinski NA, Zhu H, Jo H-J, Pham D, Kamath RR, Ouyang CR, et al. Quantification of Water Solubilized CdSe/ZnS Quantum Dots in Daphnia magna. Environ Sci Technol. 2010;44(5):1841–6. [DOI] [PubMed] [Google Scholar]
- 240.NILSSON JR. On Food Vacuoles in Tetrahymena pyriformis GL. The Journal of Protozoology. 1977;24(4):502–7. [DOI] [PubMed] [Google Scholar]
- 241.Feswick A, Griffitt RJ, Siebein K, Barber DS. Uptake, retention and internalization of quantum dots in Daphnia is influenced by particle surface functionalization. Aquatic Toxicology. 2013;130:210–8. [DOI] [PubMed] [Google Scholar]
- 242.de Vasconcelos Lima M, de Andrade Pereira MI, Cabral Filho PE, Nascimento de Siqueira W, Milca Fagundes Silva HA, de França EJ, et al. Studies on Toxicity of Suspensions of CdTe Quantum Dots to Biomphalaria glabrata Mollusks. 2019;38(10):2128–36. [DOI] [PubMed] [Google Scholar]
- 243.Bruneau A, Fortier M, Gagne F, Gagnon C, Turcotte P, Tayabali A, et al. Size distribution effects of cadmium tellurium quantum dots (CdS/CdTe) immunotoxicity on aquatic organisms. Environmental Science-Processes & Impacts. 2013;15(3):596–607. [DOI] [PubMed] [Google Scholar]
- 244.Bottrill M, Green M. Some aspects of quantum dot toxicity. Chemical Communications. 2011;47(25):7039–50. [DOI] [PubMed] [Google Scholar]
- 245.Hu L, Zhang C, Zeng G, Chen G, Wan J, Guo Z, et al. Metal-based quantum dots: synthesis, surface modification, transport and fate in aquatic environments and toxicity to microorganisms. RSC Advances. 2016;6(82):78595–610. [Google Scholar]
- 246.Parks AN, Portis LM, Schierz PA, Washburn KM, Perron MM, Burgess RM, et al. Bioaccumulation and toxicity of single-walled carbon nanotubes to benthic organisms at the base of the marine food chain. 2013;32(6):1270–7. [DOI] [PubMed] [Google Scholar]
- 247.Freixa A, Acuña V, Sanchís J, Farré M, Barceló D, Sabater S. Ecotoxicological effects of carbon based nanomaterials in aquatic organisms. Science of The Total Environment. 2018;619–620:328–37. [DOI] [PubMed] [Google Scholar]
- 248.Leigh K, Bouldin J, Buchanan R. Effects of Exposure to Semiconductor Nanoparticles on Aquatic Organisms. Journal of Toxicology. 2012;2012:397657. [DOI] [PMC free article] [PubMed] [Google Scholar]
- 249.Hsu P-CL, O’Callaghan M, Al-Salim N, Hurst MRH. Quantum dot nanoparticles affect the reproductive system of Caenorhabditis elegans. 2012;31(10):2366–74. [DOI] [PubMed] [Google Scholar]
- 250.Pace HE, Lesher EK, Ranville JF. INFLUENCE OF STABILITY ON THE ACUTE TOXICITY OF CdSe/ZnS NANOCRYSTALS TO DAPHNIA MAGNA. Environ Toxicol Chem. 2010;29(6):1338–44. [DOI] [PubMed] [Google Scholar]
- 251.Chen N, He Y, Su Y, Li X, Huang Q, Wang H, et al. The cytotoxicity of cadmium-based quantum dots. Biomaterials. 2012;33(5):1238–44. [DOI] [PubMed] [Google Scholar]
- 252.Marmiroli M, Lepore GO, Pagano L, d’Acapito F, Gianoncelli A, Villani M, et al. The fate of CdS quantum dots in plants as revealed by extended X-ray absorption fine structure (EXAFS) analysis. Environmental Science: Nano. 2020;7(4):1150–62. [Google Scholar]
- 253.Yao K, Lv X, Zheng G, Chen Z, Jiang Y, Zhu X, et al. Effects of Carbon Quantum Dots on Aquatic Environments: Comparison of Toxicity to Organisms at Different Trophic Levels. Environ Sci Technol. 2018;52(24):14445–51. [DOI] [PubMed] [Google Scholar]
- 254.Munari M, Sturve J, Frenzilli G, Sanders MB, Christian P, Nigro M, et al. Genotoxic effects of Ag2S and CdS nanoparticles in blue mussel (Mytilus edulis) haemocytes. Chem Ecol. 2014;30(8):719–25. [Google Scholar]
- 255.Santos AR, Miguel AS, Macovei A, Maycock C, Balestrazzi A, Oliva A, et al. CdSe/ZnS Quantum Dots trigger DNA repair and antioxidant enzyme systems in Medicago sativacells in suspension culture. BMC Biotechnology. 2013;13(1):111. [DOI] [PMC free article] [PubMed] [Google Scholar]
- 256.Xu J, He H, Wang Y-Y, Yan R, Zhou L-J, Liu Y-z, et al. New aspects of the environmental risks of quantum dots: prophage activation. Environmental Science: Nano. 2018;5(7):1556–66. [Google Scholar]
- 257.Deng S, Jia PP, Zhang JH, Junaid M, Niu AP, Ma YB, et al. Transcriptomic response and perturbation of toxicity pathways in zebrafish larvae after exposure to graphene quantum dots (GQDs). J Hazard Mater. 2018;357:146–58. [DOI] [PubMed] [Google Scholar]
- 258.Pagano L, Caldara M, Villani M, Zappettini A, Marmiroli N, Marmiroli M. In Vivo-In Vitro Comparative Toxicology of Cadmium Sulphide Quantum Dots in the Model Organism Saccharomyces cerevisiae. Nanomaterials. 2019;9(4). [DOI] [PMC free article] [PubMed] [Google Scholar]
- 259.Majumdar S, Pagano L, Wohlschlegel JA, Villani M, Zappettini A, White JC, et al. Proteomic, gene and metabolite characterization reveal the uptake and toxicity mechanisms of cadmium sulfide quantum dots in soybean plants. Environmental Science: Nano. 2019;6(10):3010–26. [Google Scholar]
- 260.Marmiroli M, Pagano L, Savo Sardaro ML, Villani M, Marmiroli N. Genome-Wide Approach in Arabidopsis thaliana to Assess the Toxicity of Cadmium Sulfide Quantum Dots. Environ Sci Technol. 2014;48(10):5902–9. [DOI] [PubMed] [Google Scholar]
- 261.Marmiroli M, Pagano L, Pasquali F, Zappettini A, Tosato V, Bruschi CV, et al. A genome-wide nanotoxicology screen of Saccharomyces cerevisiae mutants reveals the basis for cadmium sulphide quantum dot tolerance and sensitivity. Nanotoxicology. 2016;10(1):84–93. [DOI] [PubMed] [Google Scholar]
- 262.Gagne F, Auclair J, Turcotte P, Fournier M, Gagnon C, Sauve S, et al. Ecotoxicity of CdTe quantum dots to freshwater mussels: Impacts on immune system, oxidative stress and genotoxicity. Aquatic Toxicology. 2008;86(3):333–40. [DOI] [PubMed] [Google Scholar]
- 263.Blickley TM, Matson CW, Vreeland WN, Rittschof D, Di Giulio RT, McClellan-Green PD. Dietary CdSe/ZnS quantum dot exposure in estuarine fish: Bioavailability, oxidative stress responses, reproduction, and maternal transfer. Aquatic Toxicology. 2014;148:27–39. [DOI] [PubMed] [Google Scholar]
- 264.Maselli V, Siciliano A, Giorgio A, Falanga A, Galdiero S, Guida M, et al. Multigenerational effects and DNA alterations of QDs-Indolicidin on Daphnia magna. Environ Pollut. 2017;224:597–605. [DOI] [PubMed] [Google Scholar]
- 265.Zhang W, Lin KF, Sun X, Dong QX, Huang CJ, Wang HL, et al. Toxicological effect of MPA-CdSe QDs exposure on zebrafish embryo and larvae. Chemosphere. 2012;89(1):52–9. [DOI] [PubMed] [Google Scholar]
- 266.Zhang W, Sun X, Chen L, Lin K-F, Dong Q-X, Huang C-J, et al. Toxicological effect of joint cadmium selenium quantum dots and copper ion exposure on zebrafish. Environ Toxicol Chem. 2012;31(9):2117–23. [DOI] [PubMed] [Google Scholar]
- 267.Yan S-Q, Xing R, Zhou Y-F, Li K-L, Su Y-Y, Qiu J-F, et al. Reproductive toxicity and gender differences induced by cadmium telluride quantum dots in an invertebrate model organism. Scientific Reports. 2016;6(1):34182. [DOI] [PMC free article] [PubMed] [Google Scholar]
- 268.King-Heiden TC, Wiecinski PN, Mangham AN, Metz KM, Nesbit D, Pedersen JA, et al. Quantum Dot Nanotoxicity Assessment Using the Zebrafish Embryo. Environ Sci Technol. 2009;43(5):1605–11. [DOI] [PMC free article] [PubMed] [Google Scholar]
- 269.Morelli E, Cioni P, Posarelli M, Gabellieri E. Chemical stability of CdSe quantum dots in seawater and their effects on a marine microalga. Aquatic Toxicology. 2012;122:153–62. [DOI] [PubMed] [Google Scholar]
- 270.Chen H, Gong Y, Han R. Cadmium Telluride Quantum Dots (CdTe-QDs) and Enhanced Ultraviolet-B (UV-B) Radiation Trigger Antioxidant Enzyme Metabolism and Programmed Cell Death in Wheat Seedlings. PLOS ONE. 2014;9(10):e110400. [DOI] [PMC free article] [PubMed] [Google Scholar]
- 271.Weis JS, Weis P. Pollutants as developmental toxicants in aquatic organisms. 1987;71:77–85. [DOI] [PMC free article] [PubMed] [Google Scholar]
- 272.Ambrosone A, Mattera L, Marchesano V, Quarta A, Susha AS, Tino A, et al. Mechanisms underlying toxicity induced by CdTe quantum dots determined in an invertebrate model organism. Biomaterials. 2012;33(7):1991–2000. [DOI] [PubMed] [Google Scholar]
- 273.Hu J, Lin W, Lin B, Wu K, Fan H, Yu Y. Persistent DNA methylation changes in zebrafish following graphene quantum dots exposure in surface chemistry-dependent manner. Ecotox Environ Safe. 2019;169:370–5. [DOI] [PubMed] [Google Scholar]
- 274.Contreras EQ, Cho M, Zhu H, Puppala HL, Escalera G, Zhong W, et al. Toxicity of Quantum Dots and Cadmium Salt to Caenorhabditis elegans after Multigenerational Exposure. Environ Sci Technol. 2013;47(2):1148–54. [DOI] [PMC free article] [PubMed] [Google Scholar]
- 275.Buffet P-E, Zalouk-Vergnoux A, Poirier L, Lopes C, Risso-de-Faverney C, Guibbolini M, et al. Cadmium sulfide quantum dots induce oxidative stress and behavioral impairments in the marine clam Scrobicularia plana. 2015;34(7):1659–64. [DOI] [PubMed] [Google Scholar]
- 276.Zhang W, Lin KF, Miao YN, Dong QX, Huang CJ, Wang HL, et al. Toxicity assessment of zebrafish following exposure to CdTe QDs. J Hazard Mater. 2012;213:413–20. [DOI] [PubMed] [Google Scholar]
- 277.Katsumiti A, Gilliland D, Arostegui I, Cajaraville MP. Cytotoxicity and cellular mechanisms involved in the toxicity of CdS quantum dots in hemocytes and gill cells of the mussel Mytilus galloprovincialis. Aquatic Toxicology. 2014;153:39–52. [DOI] [PubMed] [Google Scholar]
- 278.Jackson BP, Pace HE, Lanzirotti A, Smith R, Ranville JF. Synchrotron X-ray 2D and 3D elemental imaging of CdSe/ZnS quantum dot nanoparticles in Daphnia magna. Analytical and Bioanalytical Chemistry. 2009;394(3):911–7. [DOI] [PubMed] [Google Scholar]
- 279.Zhang SJ, Jiang YL, Chen CS, Creeley D, Schwehr KA, Quigg A, et al. Ameliorating effects of extracellular polymeric substances excreted by Thalassiosira pseudonana on algal toxicity of CdSe quantum dots. Aquatic Toxicology. 2013;126:214–23. [DOI] [PubMed] [Google Scholar]
- 280.Wang S, Cole IS, Li Q. The toxicity of graphene quantum dots. RSC Advances. 2016;6(92):89867–78. [Google Scholar]
- 281.Ouyang S, Hu X, Zhou Q. Envelopment–Internalization Synergistic Effects and Metabolic Mechanisms of Graphene Oxide on Single-Cell Chlorella vulgaris Are Dependent on the Nanomaterial Particle Size. ACS Applied Materials & Interfaces. 2015;7(32):18104–12. [DOI] [PubMed] [Google Scholar]
- 282.Yao H, Li J, Song Y, Zhao H, Wei Z, Li X, et al. Synthesis of ginsenoside Re-based carbon dots applied for bioimaging and effective inhibition of cancer cells. Int J Nanomed. 2018;13:6249. [DOI] [PMC free article] [PubMed] [Google Scholar]
- 283.Ankley GT, Bennett RS, Erickson RJ, Hoff DJ, Hornung MW, Johnson RD, et al. Adverse outcome pathways: A conceptual framework to support ecotoxicology research and risk assessment. 2010;29(3):730–41. [DOI] [PubMed] [Google Scholar]
- 284.Geitner NK, Ogilvie Hendren C, Cornelis G, Kaegi R, Lead JR, Lowry GV, et al. Harmonizing across environmental nanomaterial testing media for increased comparability of nanomaterial datasets. Environmental Science: Nano. 2020;7(1):13–36. [Google Scholar]
- 285.Notter DA, Mitrano DM, Nowack B. Are nanosized or dissolved metals more toxic in the environment? A meta-analysis. Environ Toxicol Chem. 2014;33(12):2733–9. [DOI] [PubMed] [Google Scholar]
- 286.Silva BF, Andreani T, Gavina A, Vieira MN, Pereira CM, Rocha-Santos T, et al. Toxicological impact of cadmium-based quantum dots towards aquatic biota: Effect of natural sunlight exposure. Aquatic Toxicology. 2016;176:197–207. [DOI] [PubMed] [Google Scholar]
Associated Data
This section collects any data citations, data availability statements, or supplementary materials included in this article.