

Abstract
Objective:
Our original aim was to validate and norm common eating disorder (ED) symptom measures in a large, representative community sample of transgender adults in the US. We recruited via Amazon Mechanical Turk (MTurk), a popular online recruitment and data collection platform both within and outside of the eating disorder (ED) field. We present an overview of our experience using MTurk.
Method:
Recruitment began in Spring 2020; our original target N was 2,250 transgender adults stratified evenly across the US. Measures included a demographics questionnaire, the Eating Disorder Examination-Questionnaire (EDE-Q), and the Eating Attitudes Test-26 (EAT-26). Consistent with current literature recommendations, we implemented a comprehensive set of attention and validity measures to reduce and identify bot responding, data farming, and participant misrepresentation.
Results:
Recommended validity and attention checks failed to identify the majority of likely invalid responses. Our collection of two similar ED measures, thorough weight history assessment, and gender identity experiences allowed us to examine response concordance and identify impossible and improbable responses, which revealed glaring discrepancies and invalid data. Further, qualitative data (e.g., emails received from MTurk workers) raised concerns about economic conditions facing MTurk workers that could compel misrepresentation.
Discussion:
Our results strongly suggest most of our data were invalid, and call into question results of recently-published MTurk studies. We assert that caution and rigor must be applied when using MTurk as a recruitment tool for ED research, and offer several suggestions for ED researchers to mitigate and identify invalid data.
Keywords: MTurk, crowdsourcing, online, data collection, validity, eating disorders
1. Introduction
1.1. The Original Study
Transgender individuals are at increased eating disorder (ED) risk (Nagata, Ganson, et al., 2020), but common ED assessment tools were normed on primarily or entirely cisgender samples (Lavender et al., 2017). Thus, the authors originally planned to recruit a transgender United States (US)-based adult community sample via Amazon Mechanical Turk (MTurk) and 1) assess the factor structure and invariance of commonly-used ED measures and 2) establish norms on the best-fitting models.
1.2. Rationale for Choosing MTurk
MTurk is an increasingly popular method of online data collection (Behrend et al., 2011; Keith et al., 2017) that provides a platform for individuals (i.e., “workers”) to complete online survey tasks (i.e., HITs [human-intelligence tasks]) for payment. MTurk is the most popular crowdsourced data option for researchers (Dennis et al., 2020), and is widely-used in the ED literature, with dozens of studies published in the last five years alone (e.g., Carr et al., 2019; Cunningham et al., 2016; Lydecker et al., 2018; Lydecker & Grilo, 2017; Rasmusson et al., 2019; Tylka & Calogero, 2019; Vartanian et al., 2018), including several psychometric/validation studies (e.g., Scharmer et al., 2020; Sladek et al., 2018; Zickgraf & Ellis, 2018).
We chose to recruit via MTurk for several reasons. One, MTurk generally has lower data collection costs relative to Qualtrics, Survey Monkey, and research firms (Brandon et al., 2014), and can be used for recruitment, whereas services such as Qualtrics, REDCap, and Survey Monkey are primarily for data collection. Two, we aimed to recruit a group that represents just 0.6% of the population (Flores et al., 2016). Part of MTurk’s appeal is its broad reach to diverse populations, providing researchers access to individuals who might otherwise be missed via traditional recruitment methods (Smith et al., 2015). Moreover, its anonymous, web-based platform might provide greater comfort in sharing personal information than traditional methods (Shapiro et al., 2013), which we felt was particularly important given the considerable stigma transgender individuals face. Further, early reviews suggested MTurk samples were more demographically diverse, older, and with more work experience than traditional convenience and college samples (Behrend et al., 2011; Buhrmester et al., 2011). Therefore, we believed MTurk provided an ideal platform to recruit a large, diverse community sample of transgender adults. Finally, early MTurk reviews were promising, suggesting the platform was not only convenient and inexpensive, but also resulted in high-quality data that appeared as reliable as traditional data collection methods (Behrend et al., 2011; Buhrmester et al., 2011). As researchers both outside of and within the ED field continue to publish using MTurk samples, and voice confidence in their data’s validity (e.g., Kambanis et al., 2021), we were excited by MTurk’s potential to help us obtain high-quality data from a hard-to-access population.
1.3. MTurk Concerns
Despite its increasing use in psychological research, there are ongoing concerns about potential risks to MTurk data quality, which have intensified in recent years (e.g., Chmielewski & Kucker, 2020; Dennis et al., 2020). One concern is financial interests or pressures might lead MTurk workers to respond in a way that is deceptive or inaccurate (Barends & de Vries, 2019). For instance, if MTurk participants have high financial need, they might complete tasks quickly, sacrificing data quality, to accumulate more payments. Recent articles highlight the potential risk of bots (computer programs that complete HITs) and data farming (using virtual private servers [VPS] to bypass location or IP restrictions) to compromise data quality on MTurk (Buchanan & Scofield, 2018; Dupuis et al., 2019; Yarrish et al., 2019). Although bots appear relatively rare and easily screened through strategies such as reCAPTCHA tasks (e.g., Kennedy et al., 2020), data farming techniques are increasingly sophisticated, reducing the utility of IP-address-based screening procedures (Dennis et al., 2020).
Given these concerns, we exerted substantial effort to design our data collection and screening procedures to minimize and exclude low-quality and fraudulent responses. There is considerable literature on how to obtain high quality MTurk data (e.g., Yarrish et al., 2019), and we went above and beyond current recommendations. Therefore, we perceived these protections, combined with the potential reach, convenience, and efficiency MTurk provided (especially when attempting to recruit during the COVID-19 pandemic), would yield high quality data from our target sample. Below, we outline our experience using MTurk to recruit a transgender sample for a psychometric evaluation of ED measures, and the iterative steps taken to prevent fraudulent, invalid, and low quality MTurk data.
2. Method
2.1. Target Sample
Because we aimed to establish norms on ED measures, we were interested in obtaining a representative sample. In particular, we wanted to reach people in rural areas, under-researched areas, and areas with poor access to gender-affirming healthcare. MTurk allows researchers to restrict data collection to certain regions of the US via IP address. Thus, we stratified recruitment equally across eight US regions (New England, Mideast, Southeast, Great Lakes, Plains, Rocky Mountain, Southwest, and Far West), as defined by the US Bureau of Economic Analysis (www.bea.gov).
After conducting an a priori power analysis and accounting for a conservative estimate of 50% data lost after screening and validity checks, our recruitment target was 4,500 participants (500/region; resulting in a final sample of 2,250), which would be sufficient to detect a medium-sized effect at 80% power. Adults ≥18 years residing in the US and identifying as transgender were eligible.
2.2. Measures
Participants completed a comprehensive demographic survey assessing age, race and ethnicity, gender identity, gender-confirming medical interventions, sex assigned at birth, socioeconomic status, and weight history.
We chose to administer the Eating Disorder Examination-Questionnaire (EDE-Q; Fairburn & Beglin, 2008) and the Eating Attitudes Test-26 (EAT-26; Garner et al., 1982), due to their wide and ongoing use within the field (e.g., Dunn et al., 2019; Kang et al., 2017), and recent use with transgender samples (Nagata, Compte, et al., 2020). The EDE-Q has four subscales (restraint, eating concern, shape concern, and weight concern) and a global score, and also assesses frequency of objective binge episodes (OBEs), self-induced vomiting, laxative abuse, and diuretic misuse over the last 28 days. The EAT-26 has three subscales (dieting, bulimia/food preoccupation, and oral control) and a total score, and assesses behavioral frequencies over the last six months (e.g., OBEs and compensatory behaviors). Both instruments have demonstrated internal consistency and the ability to discriminate between those with and without EDs (Berg et al., 2012; Garner & Garfinkel, 1979; Mintz & O’Halloran, 2000). We also included measures of weight-bias internalization, gender identity, and gender dysphoria.
2.3. Procedures
The host institution granted ethics approval (IRB #19-619). Recruitment occurred via MTurk, with questionnaires hosted by Qualtrics (https://www.qualtrics.com).
2.3.1. Procedures to protect data quality.
We used several strategies to minimize low-quality data. Although MTurk offers the option to pre-screen participants for an additional fee, gender within MTurk is coded as a male/female binary. Thus, we declined MTurk’s pre-screening option and included questions assessing age and gender identity prior to the consent form. Initially eligible individuals were directed to the consent form, where they provided age and gender identity again. Those not meeting eligibility criteria and not consenting could not progress in the survey.
We implemented additional protections consistent with recent recommendations (Dennis et al., 2020; Kennedy et al., 2020; Yarrish et al., 2019) to enhance data quality. First, only MTurk workers with a HIT approval rating ≥95% (i.e., the ratio of completed tasks approved for payment) were eligible, as this rating corresponds to recent research recommendations (e.g., Dennis et al., 2020) and should yield a sample of workers who consistently and accurately complete MTurk tasks as assessed by the task developers. Second, we selected our compensation rate ($1.50 USD for ~10 minutes) carefully. We wanted to pay above the US federal minimum wage because Amazon does not provide workers legal protections, leaving them vulnerable to exploitation and without avenues for recourse (Bergvall-Kåreborn & Howcroft, 2014). However, we also did not want to over-incentivize the task and increase the risk for misrepresentation, especially when attempting to recruit a group that represents such a small proportion of the general population (Flores et al., 2016; Hara et al., 2018; Yarrish et al., 2019). Third, study advertising was intentionally vague to not reveal the inclusion criteria. Fourth, participants could not reopen the survey with the same IP address following completion.
We also designed our survey to include the following additional recommendations to limit invalid responses: 1) reCAPTCHA task; 2) open-ended questions to identify nonsensical or irrelevant responses; 3) assessment of demographic variables (e.g., weight, height, gender) multiple times with slight modifications across questionnaires (e.g., age as both a dropdown and text box). Finally, there were two attention checks (e.g., “To continue completing the survey, select option C below”), and the survey ended for those not answering correctly. All participants completing the surveys without failing any aforementioned checks received a numeric password to receive HIT approval and payment through MTurk.
3. Data Collection and Screening
3.1. Concerns Raised During Data Collection
Despite implementing what we perceived as particularly rigorous procedures to minimize risks to data quality, shortly after the start of data collection, we began receiving emails from MTurk participants that raised concerns among the team about both the financial pressures facing MTurk workers and potential threats to data credibility. In several emails, workers wrote that equipment and/or site failures (e.g., Internet loss during survey completion) precluded them from completing the surveys, and requested a manual override to receive payment despite lack of completion. Other messages expressed feeling pressured (by unknown sources) to complete the HIT or be approved for payment. We received messages from those not meeting inclusion criteria who wrote they felt tricked or misled by the two screening questions, and others who felt exploited for not being paid to complete them. The research team was particularly troubled by one email received from a worker who pleaded for their HIT to be approved because they needed the money to feed their child.
Throughout data collection, the research team also observed participants attempting to complete the survey and request payment multiple times. Specifically, 453 participants intentionally requested multiple approvals and payment requests with the same HIT completion code, and we eventually blocked eight participants who attempted to complete the HIT ≥19 times.
3.2. Data Screening and Cleaning
Post-data collection, our initial plans to conduct further screening were fairly simple, including analysis of survey completion time and calculation of person-total correlation and Mahalanobis distance as recommended by Dupuis et al. (2019). Below, we outline the iterative nature of data screening and cleaning (See Figure 1 for a quantitative breakdown of this process).
Figure 1.
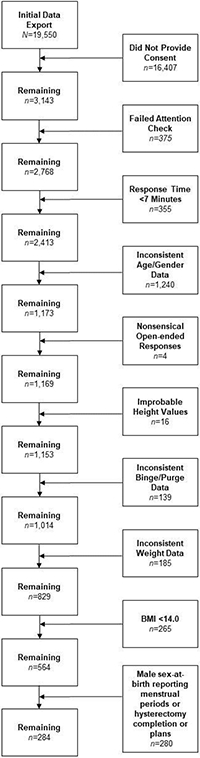
CONSORT diagram of MTurk data screening steps
Our initial data export contained 19,550 rows of data, with each row representing one attempted or completed survey response; of those, 3,143 passed the initial pre-screening questions and provided consent. The remaining 16,407 rows reflected separate attempts to complete the survey, which failed either due to lack of pre-screening eligibility or consent.
Among initially eligible and consenting participants, 359 did not complete the attention check, and 16 responded incorrectly. Then, we calculated descriptive statistics for survey completion time in minutes, as we noticed a large proportion of responses with improbably-fast completion times. All IRB-approved research team members piloted the survey. Average and fastest completion were 8 and ~7.5 minutes, respectively. We determined 7 minutes was the fastest feasible time to complete the survey with attention and removed any responses completed in <7 minutes (n=355).
Next, we assessed within-participant data concordance. Participants provided gender identity and age twice. First, we removed individuals with inconsistent age data (n=180) and those who did not consistently identify as transgender (n=1,060). Then, we screened data for nonsensical responses to open-ended questions (e.g., providing a numerical value for ‘occupation’; n=4). We also removed individuals with improbable height values (i.e., <4 and >8 feet; n=16).
At this point, we hoped our data screening steps were almost complete. However, research team members observed unusual and even impossible responses to EDE-Q behavioral frequency items and weight data. For instance, there were hundreds of instances of participants endorsing dozens (and up to hundreds) of binge, vomiting, laxative, diuretic, and compensatory exercise episodes within a 28-day span. We realized that administering two measures of ED symptoms provided an opportunity to not only screen for improbable or impossible responses, but also examine data concordance.
The EDE-Q asks, out of the last 28 days, how many days a binge occurred and the total number of binge episodes. Four individuals reported no binge episodes, but >0 binge days, and 31 reported no binge days, but >0 binge episodes. Additionally, 28 individuals reported >28 out of 28 binge days. On the EAT-26, 49 individuals reported “Never” having a binge episode in the last 6 months, but >0 binge episodes in the last 28 days on the EDE-Q. Similarly, 27 individuals reported “Never” self-inducing vomiting in the last 6 months on the EAT-26, but >0 purge episodes in the last 28 days on the EDE-Q.
Participants reported current, ideal, highest, and lowest weights at adult height, with responses restricted to height in feet and inches (measured via two dropdown fields) and weight in pounds (measured via free text field). We calculated BMI for all indices. We removed individuals reporting highest < current weight (n=156), and lowest > than both highest (n=2) and current weight (n=27). We chose to be strict in this removal, as most responses reflected impossible values (e.g., current weight=145 pounds, highest weight=60 pounds), rather than potential misinterpretation of the survey question.
When examining the remaining responses, we observed a preponderance of improbable BMI values. Of the 829 retained responses, the average current, highest, lowest, and ideal BMI values were 20.73, 23.32, 17.13, and 19.02, respectively, which are far below recent averages (~29) for adults in the US (Fryar et al., 2018), as well as recent studies with trans and gender-expansive populations (~28; Nagata, Compte, et al., 2020; Nagata, Murray, et al., 2020). Indeed, 32.1% of the remaining responses reported a BMI within the underweight category, far above the most recent estimate of 1.6% of adults ≥20 years (Fryar et al., 2020). Therefore, we removed any individuals reporting BMI values <14.00 (n=265). Although it was possible this step would exclude individuals with severe eating pathology, even many inpatient anorexia nervosa trials show average BMI values >14.00 at admission (Herpertz-Dahlmann et al., 2014; Lynch et al., 2013). At this point, average BMI values increased (e.g., M current BMI=24.17), though 7.6% of the sample still reported a BMI value classified as “underweight.”
After this extensive data cleaning, we chose to proceed with our final screening steps, including the calculation of person-total correlations and Mahalanobis distance, as recommended by Dupuis et al., (2019). However, these indices were uninterpretable and conflicting. Mahalanobis distance values were generally large, suggesting a considerable proportion of responses were multivariate outliers. Additionally, these values were not concordant with person-total correlations, rendering us unable to identify any further suspicious responses. We hoped this reflected the adequacy of our data screening process and proceeded with analyses.
However, when calculating descriptive statistics by sex-at-birth, we encountered more evidence to suggest a large proportion of our data were invalid. Of individuals assigned male-at-birth, 25 reported a history of hysterectomy, 69 reported planning to do so, 101 reported considering it in the future, and 75 reported wanting to, but not having access. A further 10 reported they experienced menstrual periods, leaving only 86 individuals assigned male-at-birth reporting no intentions to have a hysterectomy and no menstrual periods.
4. Discussion
4.1. Abandoning the Planned Project
We undertook these extensive and rigorous screening measures with the hope of obtaining a sample of high quality data to complete the proposed project. However, these procedures yielded 284 potentially valid records out of 3,143 responses providing consent. This represents a loss of 90% of data for this project within the context of evidence-based security measures. The research team convened and concluded, given the vast majority of our data were of questionable quality, we could not ethically disseminate or interpret analyses from this sample. However, given MTurk is the most popular online crowdsourcing platform for researchers (Dennis et al., 2020), and continues to be widely used in the ED field (e.g., Carr et al., 2019; Kambanis et al., 2021; Lydecker et al., 2018), we felt a responsibility to share our experience and offer caution and recommendations to other ED researchers.
4.2. Interpreting Our Results
During data collection, emails from MTurk workers were often imploring and even desperate in tone, and we encountered hundreds of instances of workers attempting to complete the HIT and receive payment multiple times. This troubled the research team and gave the impression that many workers were facing considerable economic hardship, an initially surprising result in light of the literature we consulted during the study design phase. Specifically, early work found that MTurk data quality was consistent across low to high compensation rates (e.g., Buhrmester et al., 2011), which became widely accepted as evidence most MTurk workers were not motivated primarily by financial incentives (Bohannon, 2011; Buhrmester et al., 2011; Litman et al., 2015). Some cautioned higher compensation rates could actually compromise data quality by compelling workers to attempt multiple HITs or misrepresent themselves for studies for which they were not eligible (Bohannon, 2011; Buhrmester et al., 2011).
What we learned, however, was that these early studies were based on compensation rates well below the US minimum wage, meaning most US-based workers could not rely on HITs as primary income (Litman et al., 2015). Thus, it seemed plausible that many US-based workers at the time were not motivated by financial incentives (Litman et al., 2015). However, after the US, the greatest proportion of MTurk workers are in India, where the minimum wage ranges from 28-50 cents/hour and where many workers are relying on HITs as primary income (Burnham et al., 2018; Litman et al., 2015). Although we restricted our study to US-based workers for the purpose of our aims, these protections are relatively easily circumvented and data farming is proliferating, allowing workers to 1) gain access to US-restricted studies from international locations, and 2) submit duplicate responses to accumulate payments (Dennis et al., 2020; Kennedy et al., 2020). Whereas our compensation rate was equivalent to ~13 minutes of work at the US federal minimum wage, it would be equivalent to three hours of work at $.50/hour, thus having an arguably greater economic impact on a worker in India, for example. However, more recent research suggests MTurk workers in both India and the US are financially motivated (Litman et al., 2015), and workers in either location could have used VPS to bypass IP-address restrictions and submit multiple HITs. Further, we began data collection in March 2020 during the onset of the COVID-19 pandemic, which had massive, global economic consequences, and likely intensified financial pressures (Brodeur et al., 2021).
The widespread data inconsistencies, improbable/impossible values, and nonsensical open-ended responses in our survey lend further support that our survey was accessed by data farmers. Research shows data farmers often have limited English proficiency and are motivated or pressured to complete tasks quickly, which can compromise data quality, particularly for complex tasks or those requiring advanced English proficiency (Moss & Litman, 2018). Our survey contained words and phrases like “hysterectomy” and “self-induced vomiting,” which might be unfamiliar to individuals with limited English knowledge.
Though we designed our survey carefully to prevent low quality and invalid data, our data screening process took on a life of its own. We were thankfully compelled to tug at each loose thread we came across, but these only led to more and more, before our project fully unraveled. Ultimately, >90% of the data we collected appeared invalid, which is still likely an underestimate given how discrepant the average BMIs and behavioral frequencies were from other adult community samples. Though it is possible our attempts to recruit a group that represents just 0.6% of adults in the US (Flores et al., 2016) led to disproportionate attempts at misrepresentation, our experience raises substantial concerns about the validity of published MTurk data, particularly within the last few years. Additionally troubling is that these data are often published and affirmed as reliable, but usually lack adequate screening measures or detail on how data validity was verified.
4.3. Extant MTurk Research
Although it is well-known that sampling bias is a risk of MTurk because workers are often not representative of the general population (Keith et al., 2017), one notable trend is that MTurk workers show elevated rates of psychopathology generally (Arditte et al., 2016; Jensen-Doss et al., 2021; Keith et al., 2017; Shapiro et al., 2013), and ED symptomatology specifically (Kambanis et al., 2021). For instance, Arditte et al. (2016) found that MTurk workers reported mood and anxiety symptoms at levels comparable to those with clinical disorders. Further, a recent integrative review found that MTurk participants were less emotionally stable, and had lower well-being, greater negative affect, and more negative attitudes than other samples (Keith et al., 2017). Rather than view these findings as concerning for potential participant misrepresentation or lack of data integrity, however, researchers often conclude that evidence of elevated psychopathology could make MTurk a particularly valuable tool for collecting data from clinical populations (e.g., Kambanis et al., 2021; Shapiro et al., 2013). Our findings suggest those conclusions may be more complicated and raise questions about the integrity of published MTurk data.
In a study conducted during COVID-19, Kambanis et al. (2021) explored rates of EDs and ED behaviors in a sample of MTurk workers. The authors employed a rigorous process to mitigate invalid data, including validity/attention checks, >75% HIT rates, duplicate response monitoring, and evaluation of completion time (although participants completing the survey in <60% of median completion time were retained). Overall, 14% failed validity checks, similar to past research (Arditte et al., 2016). Their results revealed an alarming proportion of MTurk workers (40%) meeting DSM-5 ED criteria, far above what is typically found in community samples (e.g., men=2.2%, women=8.4%; Galmiche et al., 2019), even in those at elevated ED-risk (e.g., 13.5% of college women; Eisenberg et al., 2011). There were similarly troubling rates of specific ED-symptom endorsement, such as 65.6% of the sample endorsing objective binge episodes (OBEs), 45.2% endorsing self-induced vomiting, and 48.7% endorsing laxative misuse (Kambanis et al., 2021). Again, these rates are far above what is typically found in high-risk populations (e.g., 21.3% OBEs, 8.8% self-induced vomiting, 8.3% laxative misuse in college women; Luce et al., 2008), and are higher or comparable to those reported in clinical samples (e.g., 20.7% laxative misuse, 65.7% OBEs; Dahlgren et al., 2017). Additionally, 27.1% of their overall sample reported any lifetime ED treatment and 18.1% endorsed current ED treatment (Kambanis et al., 2021). These high rates of treatment-seeking are remarkable within a heterogeneous community sample, considering researchers find comparable rates when looking only at individuals with EDs (Eisenberg et al., 2011; Hart et al., 2011). Given the high rates of ED symptomatology endorsed, the authors concluded MTurk might be a particularly valuable recruitment source for ED-related research (Kambanis et al., 2021).
However, these findings raised alarm in the research team, as we noted disturbing parallels with our data. For instance, even when removing all data we could identify as likely invalid, leaving us with only 284 participants, between two-thirds and three-fourths of the remaining sample endorsed OBEs, self-induced vomiting, laxative misuse, and compensatory exercise. Similarly, almost 40% met criteria for being high-ED risk (i.e., EDE-Q global score ≥ 4.0; Mond et al., 2004). Finally, similar to Kambanis et al. (2021), reported BMIs in our data were notably lower than reported averages for US adults overall and transgender adults, specifically (e.g., Fryar et al., 2018; Nagata, Compte, et al., 2020), with an unusual proportion of impossible and improbable BMI values (e.g., <10).
4.4. Caution and Suggestions for ED Researchers
Taken together, we want to both 1) caution ED researchers (as consumers of MTurk research and when considering using MTurk for recruitment and data collection) about the vulnerability of crowdsourced data to poor data quality and 2) propose that ED researchers are uniquely positioned to conduct comprehensive screening of data collected via MTurk. Given the growing evidence of fraudulent and low-quality MTurk data (e.g., Chmielewski & Kucker, 2020; Kennedy et al., 2020) and the unexpected findings of recent studies (e.g., Kambanis et al., 2021), we assert that ED researchers must be rigorous in data screening to ensure high-quality data are gathered from the intended sample.
The potential implications of disseminating invalid or low-quality data cannot be overstated and should not be minimized. Our original aim was to validate and establish norms of two commonly-used ED measures in transgender adults. Had we published invalid or low-quality data, we would have risked exacerbating disparities or obfuscating understanding of ED behaviors in a group already underrepresented in the literature. If ED researchers elect to use MTurk in the future, despite known data quality threats and evolving technology, there are several data screening steps they can take beyond recent recommendations (Dennis et al., 2020; Dupuis et al., 2019; Yarrish et al., 2019; see Table 1).
Table 1.
Summary of Recommendations for Eating Disorder Researchers Using MTurk
| Recommendations | |
|---|---|
| 1 | Employ the most current, empirically-based recommendations (e.g., Moss & Litman, 2018; Dennis et al., 2020; Dupuis et al., 2019; Yarrish et al., 2019) |
| 2 | Stay current on the literature, as threats to crowdsourced data collection (e.g., fraudulent VPN, data farming) continually evolve. Suggestions include: Google Scholar alert to track new literature published on crowdsourcing data validity; literature reviews during each research phase (i.e., study design, data collection, analysis, and manuscript preparation) to ensure practices are in accordance with recommendations |
| 2 | Repeat questions in different sections of the survey with slight modifications (e.g., age via both text box and dropdown) |
| 3 | Integrate open-ended and numerical fields to identify nonsensical or improbable values (e.g., self-identify sociodemographic information; “How many days/week do you consume caffeine?”) |
| 4 | Assess preferred reporting system for numerical and/or biometric data |
| 5 | Gather multiple weight indices and screen for inconsistent or improbable values (e.g., current, highest, lowest, ideal weight at current height) |
| 6 | Include questions that can be cross-referenced to evaluate response consistency (e.g., Have you had a binge episode in the last 28 days? How many days have you had a binge episode?) |
| 7 | Collect at least two similar measures or cross-reference data within one survey |
| 8 | Provide detailed description of MTurk data screening procedures (including reasons for and numbers of records excluded), such that other researchers could follow steps and obtain same results (consider CONSORT diagram); include in supplementary material when journal space limitations prohibitive of including in text |
| 9 | Journal teams procure expert reviewers and in-house staff to evaluate integrity and validity of data from crowdsourced samples (Dennis et al., 2020); require researchers address data validity concerns in manuscript |
| 10 | Journals require full transparency around data cleaning and quality checking; establish mandatory minimum standards for publication and consider requiring CONSORT chart of iterative process researchers undertook to screen and remove likely invalid data |
First, consistent with recommendations, we suggest repeating questions in different parts of the survey with slight modifications, such as assessing age both via text box and dropdown. In general, open-ended and numerical questions provide opportunities to identify nonsensical or improbable values. Second, consistent with Kambanis et al. (2021), we recommend assessing participants’ preferred reporting system when assessing height and weight. However, we also recommend capturing several different weight indices to evaluate response consistency and validity. Third, researchers might also consider including questions that can be cross-referenced (e.g., age and number of birthdays) for data screening and attention checks. Fourth, if ED researchers are collecting data on ED attitudes and/or behaviors, we recommend either including at least two measures, or cross-referencing data within one survey. For instance, researchers could examine concordance of the reported number of binge episodes with number of binge days (e.g., flagging participants who report binge days>binge episodes). Although gathering multiple ED surveys could increase participant burden, there are several relatively brief tools that assess cognitive and behavioral ED symptoms, including the newly-developed 11-item Stanford-Washington University Eating Disorder Screen (Graham et al., 2019), the five-question SCOFF (Hill et al., 2009) and the 18-item Eating Disorder Diagnostic Scale (EDDS; Stice et al., 2000) to mitigate this risk.
Finally, during the literature review for this paper, we were dismayed to find generally minimal, if any, details about how researchers screened MTurk data. This lack of transparency both makes it difficult to assess the integrity of the data within those studies and also significantly hampers reproducibility. We strongly recommend researchers provide detailed, reproducible steps on MTurk data screening procedures that would aid other researchers and provide confidence in findings. When journal space limitations are prohibitive, we recommend publishing these details in supplementary material. Editorial boards of peer reviewed publications should consider procuring expert reviewers or in-house staff to assist with evaluation of validity and integrity of online data collection (Dennis et al., 2020), and manuscript guidelines should require explanation of data security and validation procedures for crowdsourced data. This may include a requirement for a CONSORT diagram outlining data screening steps and record removal, ensuring replication is possible and full transparency is guaranteed, as well as explicit comment on the possible limits to data validity in the manuscript. In the future, it might also be helpful to publish formal MTurk screening guidelines for biopsychosocial research that are regularly revised to reflect technological advances.
It is important to note this study’s limitations. Although we had reasonable suspicion about our data quality, we cannot confirm our data’s source nor its validity. As evidence of invalid and/or fraudulent data accumulated, we became stricter in removing data. Thus, it is possible we excluded some data from the target population. We began collecting data at the beginning of the COVID-19 pandemic, making it plausible economic threats and extraordinary financial hardship contributed to the degree of poor data quality we found. Nevertheless, concerns about MTurk data validity are hardly new (e.g., Goodman et al., 2013), and are likely to continue as technology evolves and outpaces recommended protections.
Finally, we focused on MTurk in this paper because it is the most popular crowdsourcing platform for researchers, and the method we used for recruitment for this project. However, data quality concerns are not unique to MTurk, and we direct readers to Palan & Schitter (2018) and Peer et al. (2017) for information on alternate platforms.
Conclusion
We intended to recruit a nationally-representative sample of transgender adults residing in the US via MTurk to validate and norm commonly-used ED measures. During data collection and analysis, we encountered accumulating evidence of invalid data despite implementing recommended protections. The purpose of this paper was to outline our data screening process, caution ED researchers using MTurk for recruitment, and offer several recommendations to prevent and mitigate low quality and/or invalid data. Given the growing research citing low quality and invalid MTurk data, it is highly improbable our findings were unique. Therefore, we implore other researchers using MTurk to use stringent and current data screening methods to ensure published results are valid.
Footnotes
The authors have no conflicts of interest to declare.
Research supported with funds made available from the West Virginia Clinical Translational Science Institute through Charleston Area Medical Center Health Education & Research Institute.
References
- Arditte KA, Çek D, Shaw AM, & Timpano KR (2016). The importance of assessing clinical phenomena in Mechanical Turk research. Psychological Assessment, 28, 684–691. 10.1037/pas0000217 [DOI] [PubMed] [Google Scholar]
- Barends AJ, & de Vries RE (2019). Noncompliant responding: Comparing exclusion criteria in MTurk personality research to improve data quality. Personality and Individual Differences, 143, 84–89. 10.1016/j.paid.2019.02.015 [DOI] [Google Scholar]
- Behrend TS, Sharek DJ, Meade AW, & Wiebe EN (2011). The viability of crowdsourcing for survey research. Behavior Research Methods, 43, 800–813. 10.3758/s13428-011-0081-0 [DOI] [PubMed] [Google Scholar]
- Berg KC, Stiles-Shields EC, Swanson SA, Peterson CB, Lebow J, & Le Grange D (2012). Diagnostic concordance of the interview and questionnaire versions of the eating disorder examination. International Journal of Eating Disorders, 45, 850–855. 10.1002/eat.20948 [DOI] [PMC free article] [PubMed] [Google Scholar]
- Bergvall-Kåreborn B, & Howcroft D (2014). Amazon Mechanical Turk and the commodification of labour. New Technology, Work and Employment, 29, 213–223. 10.1111/ntwe.12038 [DOI] [Google Scholar]
- Bohannon J (2011). Social science for pennies. In Science (Vol. 334, Issue 6054, p. 307). American Association for the Advancement of Science. 10.1126/science.334.6054.307 [DOI] [PubMed] [Google Scholar]
- Brandon DM, Long JH, Loraas TM, Mueller-Phillips J, & Vansant B (2014). Online instrument delivery and participant recruitment services: Emerging opportunities for behavioral accounting research. Behavioral Research in Accounting, 26(1), 1–23. 10.2308/BRIA-50651 [DOI] [Google Scholar]
- Brodeur A, Gray D, Islam A, & Bhuiyan S (2021). A literature review of the economics of COVID-19. Journal of Economic Surveys. 10.1111/JOES.12423 [DOI] [PMC free article] [PubMed] [Google Scholar]
- Buchanan EM, & Scofield JE (2018). Methods to detect low quality data and its implication for psychological research. Behavior Research Methods, 50, 2586–2596. 10.3758/s13428-018-1035-6 [DOI] [PubMed] [Google Scholar]
- Buhrmester M, Kwang T, & Gosling SD (2011). Amazon’s mechanical Turk: A new source of inexpensive, yet high-quality, data? Perspectives on Psychological Science, 6, 3–5. 10.1177/1745691610393980 [DOI] [PubMed] [Google Scholar]
- Burnham MJ, Le YK, & Piedmont RL (2018). Who is Mturk? Personal characteristics and sample consistency of these online workers. Mental Health, Religion and Culture, 21, 934–944. 10.1080/13674676.2018.1486394 [DOI] [Google Scholar]
- Carr MM, Lydecker JA, White MA, & Grilo CM (2019). Examining physical activity and correlates in adults with healthy weight, overweight/obesity, or binge-eating disorder. International Journal of Eating Disorders, 52, 159–165. 10.1002/eat.23003 [DOI] [PMC free article] [PubMed] [Google Scholar]
- Chmielewski M, & Kucker SC (2020). An MTurk crisis? Shifts in data quality and the impact on study results. Social Psychological and Personality Science, 11, 464–473. 10.1177/1948550619875149 [DOI] [Google Scholar]
- Cunningham HE, Pearman S, & Brewerton TD (2016). Conceptualizing primary and secondary pathological exercise using available measures of excessive exercise. International Journal of Eating Disorders, 49, 778–792. 10.1002/eat.22551 [DOI] [PubMed] [Google Scholar]
- Dahlgren CL, Stedal K, & Rø Ø (2017). Eating Disorder Examination Questionnaire (EDE-Q) and Clinical Impairment Assessment (CIA): Clinical norms and functional impairment in male and female adults with eating disorders. Nordic Journal of Psychiatry, 71, 256–261. 10.1080/08039488.2016.1271452 [DOI] [PubMed] [Google Scholar]
- Dennis SA, Goodson BM, & Pearson CA (2020). Online worker fraud and evolving threats to the integrity of mturk data: A discussion of virtual private servers and the limitations of ip-based screening procedures. Behavioral Research in Accounting, 32, 119–134. 10.2308/bria-18-044 [DOI] [Google Scholar]
- Dunn TM, Hawkins N, Gagliano S, & Stoddard K (2019). Individuals who self-identify as having “orthorexia nervosa” score in the clinical range on the Eating Attitudes Test-26. Eating and Weight Disorders - Studies on Anorexia, Bulimia and Obesity, 24, 1025–1030. 10.1007/s40519-019-00651-6 [DOI] [PubMed] [Google Scholar]
- Dupuis M, Meier E, & Cuneo F (2019). Detecting computer-generated random responding in questionnaire-based data: A comparison of seven indices. Behavior Research Methods, 51, 2228–2237. 10.3758/s13428-018-1103-y [DOI] [PubMed] [Google Scholar]
- Eisenberg D, Nicklett EJ, Roeder K, & Kirz NE (2011). Eating disorder symptoms among college students: Prevalence, persistence, correlates, and treatment-seeking. Journal of American College Health, 59, 700–707. 10.1080/07448481.2010.546461 [DOI] [PMC free article] [PubMed] [Google Scholar]
- Fairburn CG, & Beglin SJ (2008). Eating Disorder Examination Questionnaire (EDE-Q 6.0). In Fairburn CG (Ed.), Cognitive behavior therapy and eating disorders (pp. 309–313). Guilford Press. [Google Scholar]
- Flores AR, Herman JL, Gates GJ, & Brown TNT (2016). How many adults identify as transgender in the United States? https://williamsinstitute.law.ucla.edu/publications/trans-adults-united-states/ [Google Scholar]
- Fryar CD, Carroll MD, & Afful J (2020). Prevalence of underweight among adults ages 20 and over: United States, 1960-1962 through 2017-2018. National Center for Health Statistics. https://www.cdc.gov/nchs/data/hestat/underweight-adult-17-18/ESTAT-Underweight-Adult-H.pdf [Google Scholar]
- Fryar CD, Kruszon-Moran D, Gu Q, & Ogden CL (2018). Mean body weight, height, waist circumference, and body mass index among adults: United States 1999-2000 through 2015-2016. National Center for Health Statistics. https://www.cdc.gov/nchs/data/nhsr/nhsr122-508.pdf [PubMed] [Google Scholar]
- Galmiche M, Déchelotte P, Lambert G, & Tavolacci MP (2019). Prevalence of eating disorders over the 2000-2018 period: A systematic literature review. American Journal of Clinical Nutrition, 109, 1402–1413. 10.1093/ajcn/nqy342 [DOI] [PubMed] [Google Scholar]
- Garner DM, & Garfinkel PE (1979). The Eating Attitudes Test: An index of the symptoms of anorexia nervosa. Psychological Medicine, 9, 273–279. 10.1017/S0033291700030762 [DOI] [PubMed] [Google Scholar]
- Garner DM, Olmsted MP, Bohr Y, & Garfinkel PE (1982). The Eating Attitudes Test: Psychometric features and clinical correlates. Psychological Medicine, 12, 871–878. 10.1017/S0033291700049163 [DOI] [PubMed] [Google Scholar]
- Goodman JK, Cryder CE, & Cheema A (2013). Data collection in a flat world: The strengths and weaknesses of Mechanical Turk samples. Journal of Behavioral Decision Making, 26, 213–224. 10.1002/BDM.1753 [DOI] [Google Scholar]
- Graham AK, Trockel M, Weisman H, Fitzsimmons-Craft EE, Balantekin KN, Wilfley DE, & Taylor CB (2019). A screening tool for detecting eating disorder risk and diagnostic symptoms among college-age women. Journal of American College Health, 67, 357–366. 10.1080/07448481.2018.1483936 [DOI] [PMC free article] [PubMed] [Google Scholar]
- Hara K, Adams A, Milland K, Savage S, Callison-Burch C, & Bigham JP (2018). A data-driven analysis of workers’ earnings on Amazon Mechanical Turk. Conference on Human Factors in Computing Systems - Proceedings, 2018-April, 1–14. 10.1145/3173574.3174023 [DOI] [Google Scholar]
- Hart LM, Granillo MT, Jorm AF, & Paxton SJ (2011). Unmet need for treatment in the eating disorders: A systematic review of eating disorder specific treatment seeking among community cases. Clinical Psychology Review, 31, 727–735. 10.1016/j.cpr.2011.03.004 [DOI] [PubMed] [Google Scholar]
- Herpertz-Dahlmann B, Schwarte R, Krei M, Egberts K, Warnke A, Wewetzer C, Pfeiffer E, Fleischhaker C, Scherag A, Holtkamp K, Hagenah U, Bühren K, Konrad K, Schmidt U, Schade-Brittinger C, Timmesfeld N, & Dempfle A (2014). Day-patient treatment after short inpatient care versus continued inpatient treatment in adolescents with anorexia nervosa (ANDI): A multicentre, randomised, open-label, non-inferiority trial. The Lancet, 383, 1222–1229. 10.1016/S0140-6736(13)62411-3 [DOI] [PubMed] [Google Scholar]
- Hill LS, Reid F, Morgan JF, & Lacey JH (2009). SCOFF, the development of an eating disorder screening questionnaire. International Journal of Eating Disorders, 43, 344–351. 10.1002/eat.20679 [DOI] [PubMed] [Google Scholar]
- Jensen-Doss A, Patel ZS, Casline E, Mora Ringle VA, & Timpano KR (2021). Using Mechanical Turk to study parents and children: An examination of data quality and representativeness. Journal of Clinical Child & Adolescent Psychology, 1–15. 10.1080/15374416.2020.1815205 [DOI] [PubMed] [Google Scholar]
- Kambanis PE, Bottera AR, & De Young KP (2021). Eating disorder prevalence among Amazon MTurk workers assessed using a rigorous online, self-report anthropometric assessment. Eating Behaviors, 41, 101481. 10.1016/j.eatbeh.2021.101481 [DOI] [PubMed] [Google Scholar]
- Kang Q, Chan RCK, Li X, Arcelus J, Yue L, Huang J, Gu L, Fan Q, Zhang H, Xiao Z, & Chen J (2017). Psychometric properties of the Chinese version of the Eating Attitudes Test in young female patients with eating disorders in mainland China. European Eating Disorders Review, 25, 613–617. 10.1002/erv.2560 [DOI] [PubMed] [Google Scholar]
- Keith MG, Tay L, & Harms PD (2017). Systems perspective of Amazon Mechanical Turk for organizational research: Review and recommendations. Frontiers in Psychology, 8, 1359–1359. 10.3389/fpsyg.2017.01359 [DOI] [PMC free article] [PubMed] [Google Scholar]
- Kennedy R, Clifford S, Burleigh T, Waggoner PD, Jewell R, & Winter NJG (2020). The shape of and solutions to the MTurk quality crisis. Political Science Research and Methods, 8, 614–629. 10.1017/psrm.2020.6 [DOI] [Google Scholar]
- Lavender JM, Brown TA, & Murray SB (2017). Men, muscles, and eating disorders: An overview of traditional and muscularity-oriented disordered eating. Current Psychiatry Reports, 19, 1–7. 10.1007/s11920-017-0787-5 [DOI] [PMC free article] [PubMed] [Google Scholar]
- Litman L, Robinson J, & Rosenzweig C (2015). The relationship between motivation, monetary compensation, and data quality among US- and India-based workers on Mechanical Turk. Behavior Research Methods, 47, 519–528. 10.3758/s13428-014-0483-x [DOI] [PubMed] [Google Scholar]
- Luce KH, Crowther JH, & Pole M (2008). Eating Disorder Examination Questionnaire (EDE-Q): Norms for undergraduate women. International Journal of Eating Disorders, 41, 273–276. 10.1002/eat.20504 [DOI] [PubMed] [Google Scholar]
- Lydecker JA, & Grilo CM (2017). Children of parents with BED have more eating behavior disturbance than children of parents with obesity or healthy weight. International Journal of Eating Disorders, 50, 648–656. 10.1002/eat.22648 [DOI] [PMC free article] [PubMed] [Google Scholar]
- Lydecker JA, Shea M, & Grilo CM (2018). Driven exercise in the absence of binge eating: Implications for purging disorder. International Journal of Eating Disorders, 51, 139–145. 10.1002/eat.22811 [DOI] [PMC free article] [PubMed] [Google Scholar]
- Lynch TR, Gray KLH, Hempel RJ, Titley M, Chen EY, & O’Mahen HA (2013). Radically open-dialectical behavior therapy for adult anorexia nervosa: Feasibility and outcomes from an inpatient program. BMC Psychiatry, 13, 1–17. 10.1186/1471-244X-13-293 [DOI] [PMC free article] [PubMed] [Google Scholar]
- Mintz LB, & O’Halloran MS (2000). The Eating Attitudes Test: Validation with DSM-IV eating disorder criteria. Journal of Personality Assessment, 74, 489–503. 10.1207/S15327752JPA7403_11 [DOI] [PubMed] [Google Scholar]
- Mond JM, Hay PJ, Rodgers B, Owen C, & Beumont PJV (2004). Validity of the Eating Disorder Examination Questionnaire (EDE-Q) in screening for eating disorders in community samples. Behaviour Research and Therapy, 42, 551–567. 10.1016/S0005-7967(03)00161-X [DOI] [PubMed] [Google Scholar]
- Moss A, & Litman L (2018). After the bot scare: Understanding what’s been happening with data collection on MTurk and how to stop it. Cloud Research. https://www.cloudresearch.com/resources/blog/after-the-bot-scare-understanding-whats-been-happening-with-data-collection-on-mturk-and-how-to-stop-it/ [Google Scholar]
- Nagata JM, Compte EJ, Cattle CJ, Flentje A, Capriotti MR, Lubensky ME, Murray SB, Obedin-Maliver J, & Lunn MR (2020). Community norms for the Eating Disorder Examination Questionnaire (EDE-Q) among gender-expansive populations. Journal of Eating Disorders, 8, 74. 10.1186/s40337-020-00352-x [DOI] [PMC free article] [PubMed] [Google Scholar]
- Nagata JM, Ganson KT, & Austin SB (2020). Emerging trends in eating disorders among sexual and gender minorities. Current Opinion in Psychiatry, 33, 562–567. 10.1097/YCO.0000000000000645 [DOI] [PMC free article] [PubMed] [Google Scholar]
- Nagata JM, Murray SB, Compte EJ, Pak EH, Schauer R, Flentje A, Capriotti MR, Lubensky ME, Lunn MR, & Obedin-Maliver J (2020). Community norms for the Eating Disorder Examination Questionnaire (EDE-Q) among transgender men and women. Eating Behaviors, 37, 101381. 10.1016/j.eatbeh.2020.101381 [DOI] [PMC free article] [PubMed] [Google Scholar]
- Palan S, & Schitter C (2018). Prolific.ac—A subject pool for online experiments. Journal of Behavioral and Experimental Finance, 17, 22–27. 10.1016/j.jbef.2017.12.004 [DOI] [Google Scholar]
- Peer E, Brandimarte L, Samat S, & Acquisti A (2017). Beyond the Turk: Alternative platforms for crowdsourcing behavioral research. Journal of Experimental Social Psychology, 70, 153–163. 10.1016/j.jesp.2017.01.006 [DOI] [Google Scholar]
- Rasmusson G, Lydecker JA, Coffino JA, White MA, & Grilo CM (2019). Household food insecurity is associated with binge-eating disorder and obesity. International Journal of Eating Disorders, 52, 28–35. 10.1002/eat.22990 [DOI] [PMC free article] [PubMed] [Google Scholar]
- Scharmer C, Donahue JM, Heiss S, & Anderson DA (2020). Factor structure of the Eating Disorder Examination – Questionnaire among heterosexual and sexual minority males. Eating Behaviors, 38, 101403. 10.1016/j.eatbeh.2020.101403 [DOI] [PubMed] [Google Scholar]
- Shapiro DN, Chandler J, & Mueller PA (2013). Using Mechanical Turk to study clinical populations. Clinical Psychological Science, 1, 213–220. 10.1177/2167702612469015 [DOI] [Google Scholar]
- Sladek MR, Salk RH, & Engeln R (2018). Negative body talk measures for Asian, Latina(o), and White women and men: Measurement equivalence and associations with ethnic-racial identity. Body Image, 25, 66–77. 10.1016/J.BODYIM.2018.02.005 [DOI] [PubMed] [Google Scholar]
- Smith NA, Sabat IE, Martinez LR, Weaver K, & Xu S (2015). A convenient solution: Using MTurk to sample from hard-to-reach populations. Industrial and Organizational Psychology, 8, 220–228. 10.1017/iop.2015.29 [DOI] [Google Scholar]
- Stice E, Telch CF, & Rizvi SL (2000). Development and validaton of the Eating Disorder Diagnostic Scale: A brief self-report measure of anorexia, bulimia, and binge-eating disorder. Psychological Assessment, 12, 123–131. 10.1037/1040-3590.12.2.123 [DOI] [PubMed] [Google Scholar]
- Tylka TL, & Calogero RM (2019). Perceptions of male partner pressure to be thin and pornography use: Associations with eating disorder symptomatology in a community sample of adult women. International Journal of Eating Disorders, 52, 189–194. 10.1002/eat.22991 [DOI] [PubMed] [Google Scholar]
- Vartanian LR, Hayward LE, Smyth JM, Paxton SJ, & Touyz SW (2018). Risk and resiliency factors related to body dissatisfaction and disordered eating: The identity disruption model. International Journal of Eating Disorders, 51, 322–330. 10.1002/eat.22835 [DOI] [PubMed] [Google Scholar]
- Yarrish C, Groshon L, Mitchell JD, Appelbaum A, Klock S, Winternitz T, & Friedman-Wheeler DG (2019). Finding the signal in the noise: Minimizing responses from bots and inattentive humans in online research. The Behavior Therapist, 42, 235–242. [Google Scholar]
- Zickgraf HF, & Ellis JM (2018). Initial validation of the Nine Item Avoidant/Restrictive Food Intake Disorder Screen (NIAS): A measure of three restrictive eating patterns. Appetite, 123, 32–42. 10.1016/j.appet.2017.11.111 [DOI] [PubMed] [Google Scholar]