Figure 3.

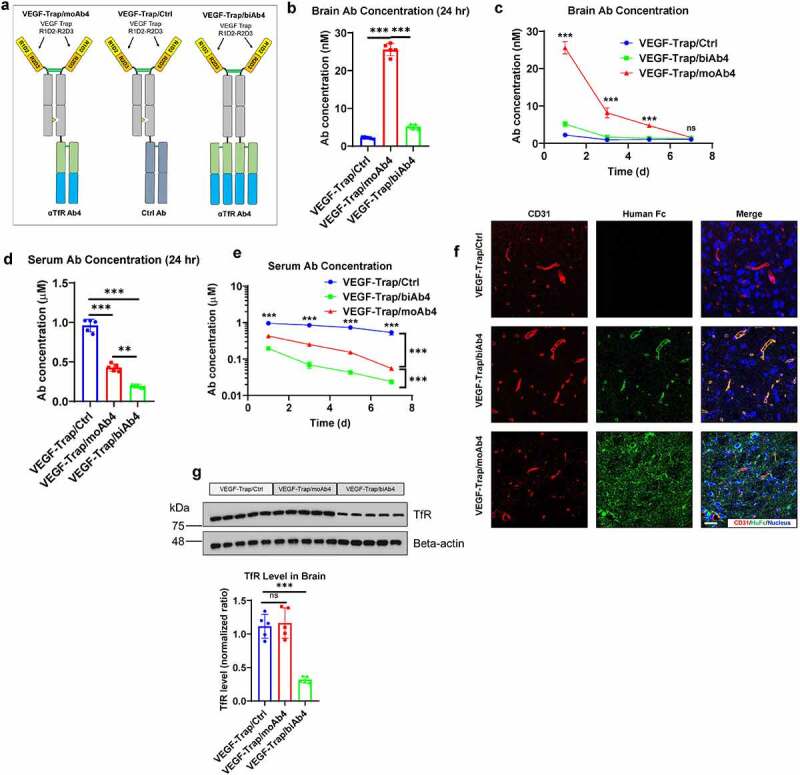
Characterization of VEGF-Trap/αTfR bispecific antibody brain entry. a. Illustration showing the design of bispecific antibodies used in this figure. b. Antibody concentrations in perfused brains 24 hours after the mice were treated with designated antibodies at 20 mg/kg through intraperitoneal injection. c. Antibody concentrations in perfused brains at designated time points after treatment as described in b. d. Antibody concentrations in serum 24 hours after the mice were treated as described in b. e. Antibody concentrations in serum at designated time points after treatment as described in b. f. Immunofluorescent staining of perfused mouse brain tissues 24 hours after treatment as described in b. Scale bar = 20 μm. g. Western blotting showing the level of total TfR in mouse brain lysates 24 hours after treatment as described in b. The Western blotting signals were quantified and shown in a bar graph. For all the animal studies, n = 5 mice per group. Error bars represent mean ± SD. For the statistical analysis, ns = not statistically different, *** P < .001, two-tailed Student t-test.
