Abstract
Background:
Genome wide association studies (GWAS) have identified many genetic variants associated with increased risk of Alzheimer’s disease (AD). These susceptibility loci may effect AD indirectly through a combination of physiological brain changes. Many of these neuropathologic features are detectable via magnetic resonance imaging (MRI).
Methods:
In this study, we examine the effects of such brain imaging derived phenotypes (IDPs) with genetic etiology on AD, using and comparing the following methods: two-sample Mendelian randomization (2SMR), generalized summary statistics based Mendelian randomization (GSMR), transcriptome wide association studies (TWAS) and the adaptive sum of powered score (aSPU) test. These methods do not require individual-level genotypic and phenotypic data but instead can rely only on an external reference panel and GWAS summary statistics.
Results:
Using publicly available GWAS datasets from the International Genomics of Alzheimer’s Project (IGAP) and UK Biobank’s (UKBB) brain imaging initiatives, we identify 35 IDPs possibly associated with AD, many of which have well established or biologically plausible links to the characteristic cognitive impairments of this neurodegenerative disease.
Conclusions:
Our results highlight the increased power for detecting genetic associations achieved by multiple correlated SNP-based methods, i.e., aSPU, GSMR and TWAS, over MR methods based on independent SNPs (as instrumental variables).
Keywords: aSPU test, Mendelian randomization, MRI, SPU tests, Sum test, TWAS
Author summary:
Structural and functional brain changes play a key role in Alzheimer’s disease progression, but recent studies suggest that many of these risk phenotypes remain unidentified. We implement and compare multiple tests of genetically-regulated brain imaging phenotypes (IDPs) associated with AD that leverage publicly available GWAS summary statistics on AD and 1,578 IDPs from IGAP and UK Biobank, respectively. We identify 35 AD-associated IDPs, including both novel and well established risk phenotypes. Our results emphasize the improved power of the aSPU, GSMR, and TWAS tests over MR approaches, the former of which utilizes multiple correlated SNPs.
INTRODUCTION
In 2016, Alzheimer’s disease (AD) was the 6th leading cause of death in the United States, directly affecting an estimated 5.4 million Americans and incurring $236 billion of total healthcare costs [1]. Alzheimer’s disease is a neurodegenerative disease characterized by dementia, accumulation of beta-amyloid plaques and tau proteins on neurons, and brain inflammation and atrophy. In recent decades, characterization of AD and its preclinical stages has relied more heavily on physiological brain phenotypes as identified through magnetic resonance images (MRI). Structural MRI identifies volumetric and vascular changes in the brain and can be used to diagnose many established causes of Alzheimer’s disease, such as hippocampal atrophy, white matter hyperintensities (WMH), and cerebral bleeds [2]. Recent studies have shown changes in connectivity patterns amongst AD patients, such as increased connectivity in the parietal region, which can be identified via resting state functional MRI (rfMRI) [3]. Diffusion MRI (dMRI) provides a detailed characterization of the brain’s microstructure and has been used to implicate white matter damage in AD pathogenesis [4].
Over the last two decades, advances in genotyping technology and statistical methods for identifying genotype-disease associations in genome-wide association studies (GWAS) have facilitated the identification of many genetic markers associated with AD. The International Genomics of Alzheimer’s Project (IGAP) performed a two stage meta-analysis of genetic data across four studies in AD and published GWAS summary statistics based on a combined set of 17,008 AD cases and 37,154 controls [5]. Their results identified 19 SNPs with significant AD associations (p < 5 × 10⁻⁸).
Combining knowledge of genetic and MRI-derived biomarkers could reveal new insights into AD. Mendelian randomization (MR) is a commonly used instrumental variable (IV) approach that tests for a putatively causal endophenotype-disease association by leveraging known information about SNP-endophenotype and SNP-disease relationships. MR relies on the principle that a genetic variant only affects a complex disease by way of intermediate endophenotypes, such as the collection of brain abnormalities that characterize Alzheimer’s disease. Two-sample Mendelian randomization (2SMR) typically uses independent sets of GWAS summary statistics from the endophenotype and disease to test for this causal effect using a single SNP as an IV [6]. Various methods exist to combine single-IV MR estimates across a set of GWAS-significant and independent SNPs/IVs. These methods are adapted from the meta-analysis literature, and include inverse variance weighted (IVW), weighted median, Egger regression, simple mode and weighted mode meta analyses. A possibly more powerful extension of the 2SMR model is the so-called generalized summary statistic based Mendelian randomization (GSMR) model, a generalized least squares based method that allows and accounts for linkage disequilibrium (LD) between multiple correlated SNPs as IVs [7].
Similar to MR methods, the method of transcriptome wide association studies (TWAS) aims to identify genetically-regulated gene expression (or another endophenotype) causally associated with a complex disease [8–14]. TWAS was originally designed to study the effect of cis-regulated gene expression on disease outcomes, but has since been generalized for the study of other intermediary endophenotypes, including neuroimaging endophenotypes [15]. In particular, TWAS has been applied to GWAS of neuroimaging phenotypes [16,17]. Due to the use of multiple possibly correlated SNPs (as IVs), TWAS is expected to be more powerful than 2SMR, which is to be confirmed here. On the other hand, the IV assumptions will likely be violated for both MR and TWAS, especially with correlated SNPs used in TWAS [18,19], leading to invalid causal conclusions.
Evidently, TWAS is equivalent to the (weighted) Sum (of score) test, which is itself a special case in the class of the sum of powered score (SPU) tests [20,21]. This class of tests was developed to address the loss of power incurred by the Sum test when many genetic variants have opposite signed effects on the disease. Any given SPU test has varying performance based on the underlying unknown association patterns of the data, motivating the development of a data adaptive sum of powered score (aSPU) test to provide a consistently powerful test for SNPs-disease associations. These tests have the added flexibility of only requiring GWAS summary statistics and an external reference panel [22].
In this study, we integrate GWAS summary data for AD and 1,578 heritable brain image derived phenotypes (IDPs) as endophenotypes using 2SMR, GSMR, TWAS/Sum and aSPU tests. One goal is to identify candidate IDPs associated with, and possibly causal to (if the IV assumptions hold for 2SMR, GSMR and TWAS) AD. The other aim is to compare the power of these methods. In particular, since various 2SMR methods are typically based only on independent SNPs (as IVs), while other methods incorporate and thereby take advantage of possibly correlated SNPs, the 2SMR methods are expected to have lower power, as confirmed here. On the other hand, the aSPU does not have an interpretation for causal inference like the TWAS/Sum and MR tests do, but due to likely violations of the assumptions in the latter methods, as recently discussed for TWAS [18,19], we regard any significant result by any method as only an association, not necessarily causal. Strictly speaking, the aSPU test is only intended to detect SNPs-disease associations. However, by the use of an IDP to select and construct weights for SNPs, any significant result by the (weighted) aSPU test would suggest a possible association between the IDP and the disease. Hence, throughout this paper, if an TDP yields a significant aSPU test based on IDP-selected and weighted SNPs, we loosely conclude this IDP is association with AD. Our application of the aSPU test to integrate IDPs with AD (or other disease/trait) GWAS is related to, but differing from the so-called imaging-wide association studies (IWAS), in which only cis-SNPs associated with the expression level of each gene (i.e., cis-eSNPs for each gene) are used in turn for each gene [15]; in contrast, here we use an IDP to select and weight genome-wide (nearly) significant SNPs. Our methodology is similar to [23], which considered other GWAS traits, not necessarily IDPs, as intermediate traits or endophenotypes for AD. We use summary statistics from IGAP and UK Biobank’s (UKBB) brain imaging initiative, in addition to a reference panel of European ancestry from the 1000 Genomes Project for estimation of LD correlations [24,25]. For each test, we filter the UKBB IDP GWAS summary statistics at three different significance thresholds (5 × 10⁻⁴, 5 × 10⁻⁵, and 5 × 10⁻⁶) and compare results. Ultimately, we aim to identify IDPs with consistently significant associations across these tests and GWAS significance thresholds, as well as compare the power of the considered tests for detecting genetic associations.
RESULTS
Table 1 gives the number of significant IDP-AD associations for each test (q < 0.05) after filtering SNPs from each IDP GWAS at a 5 × 10⁻⁵ significance threshold. While there were a number of significant IDPs using the aSPU, Sum and GSMR tests, no IDPs were significant based on any of the 2SMR meta-analyses. The marginal −log10 q-values for each IDP from the GSMR, Sum and aSPU tests are illustrated in Fig. 1. Of the 1,578 considered IDPs, 13 were significant for both aSPU and GSMR (Fig. 2). These consisted of two dMRI, three T1-FAST ROIs, one T2 FLAIR BIANCA, and seven rfMRI measures. As expected, only a subset of the aSPU significant IDPs were also supported by the Sum test results at the 5 × 10⁻⁵ GWAS significance threshold. Specifically, 10 of the 35 aSPU significant IDPs were also significant for the Sum test, eight of which were also identified by GSMR. Manhattan plots for each of these eight IDPs, as given in Fig. 3, illustrate the pattern of marginal associations for the genome-wide variants included in each test.
Table 1.
Number of significant associations based on each test at the 5 × 10⁻⁵ significance threshold
| Test | Number of significant associations |
|---|---|
| SUM | 10 |
| aSPU | 35 |
| GSMR | 13 |
| Egger regression | 0 |
| IVW | 0 |
| Simple mode | 0 |
| Weighted median | 0 |
| Weighted mode | 0 |
Figure 1. Manhattan plots comparing GSMR, aSPU and Sum tests.
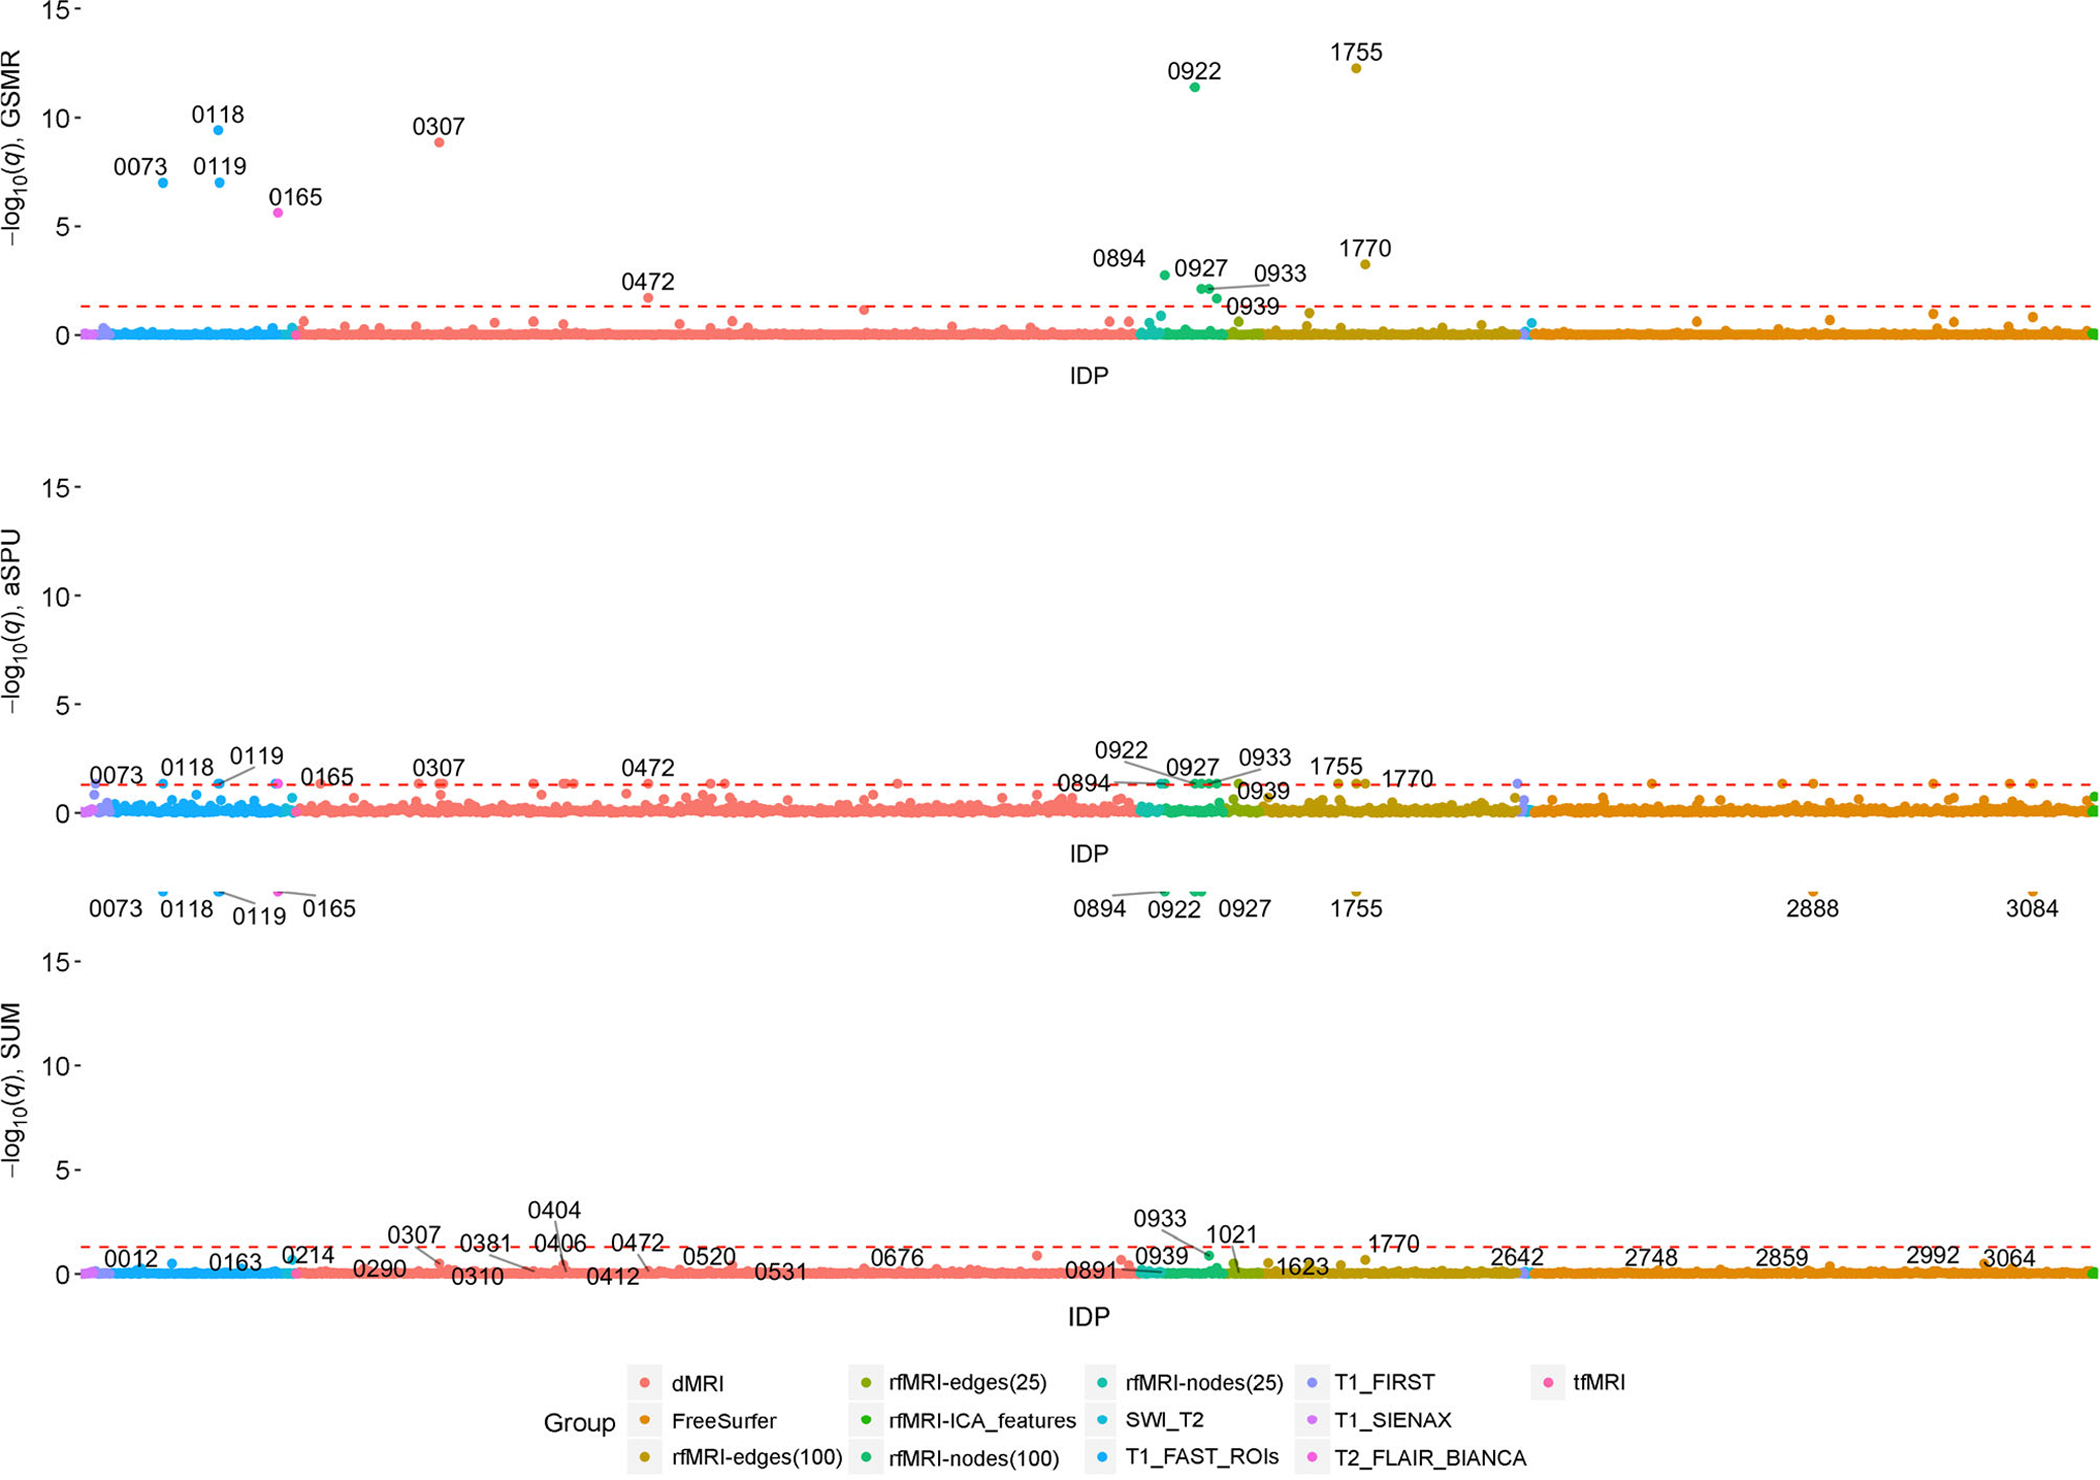
Significant IDPs labelled with IDP ID number from UKBB.
Figure 2.
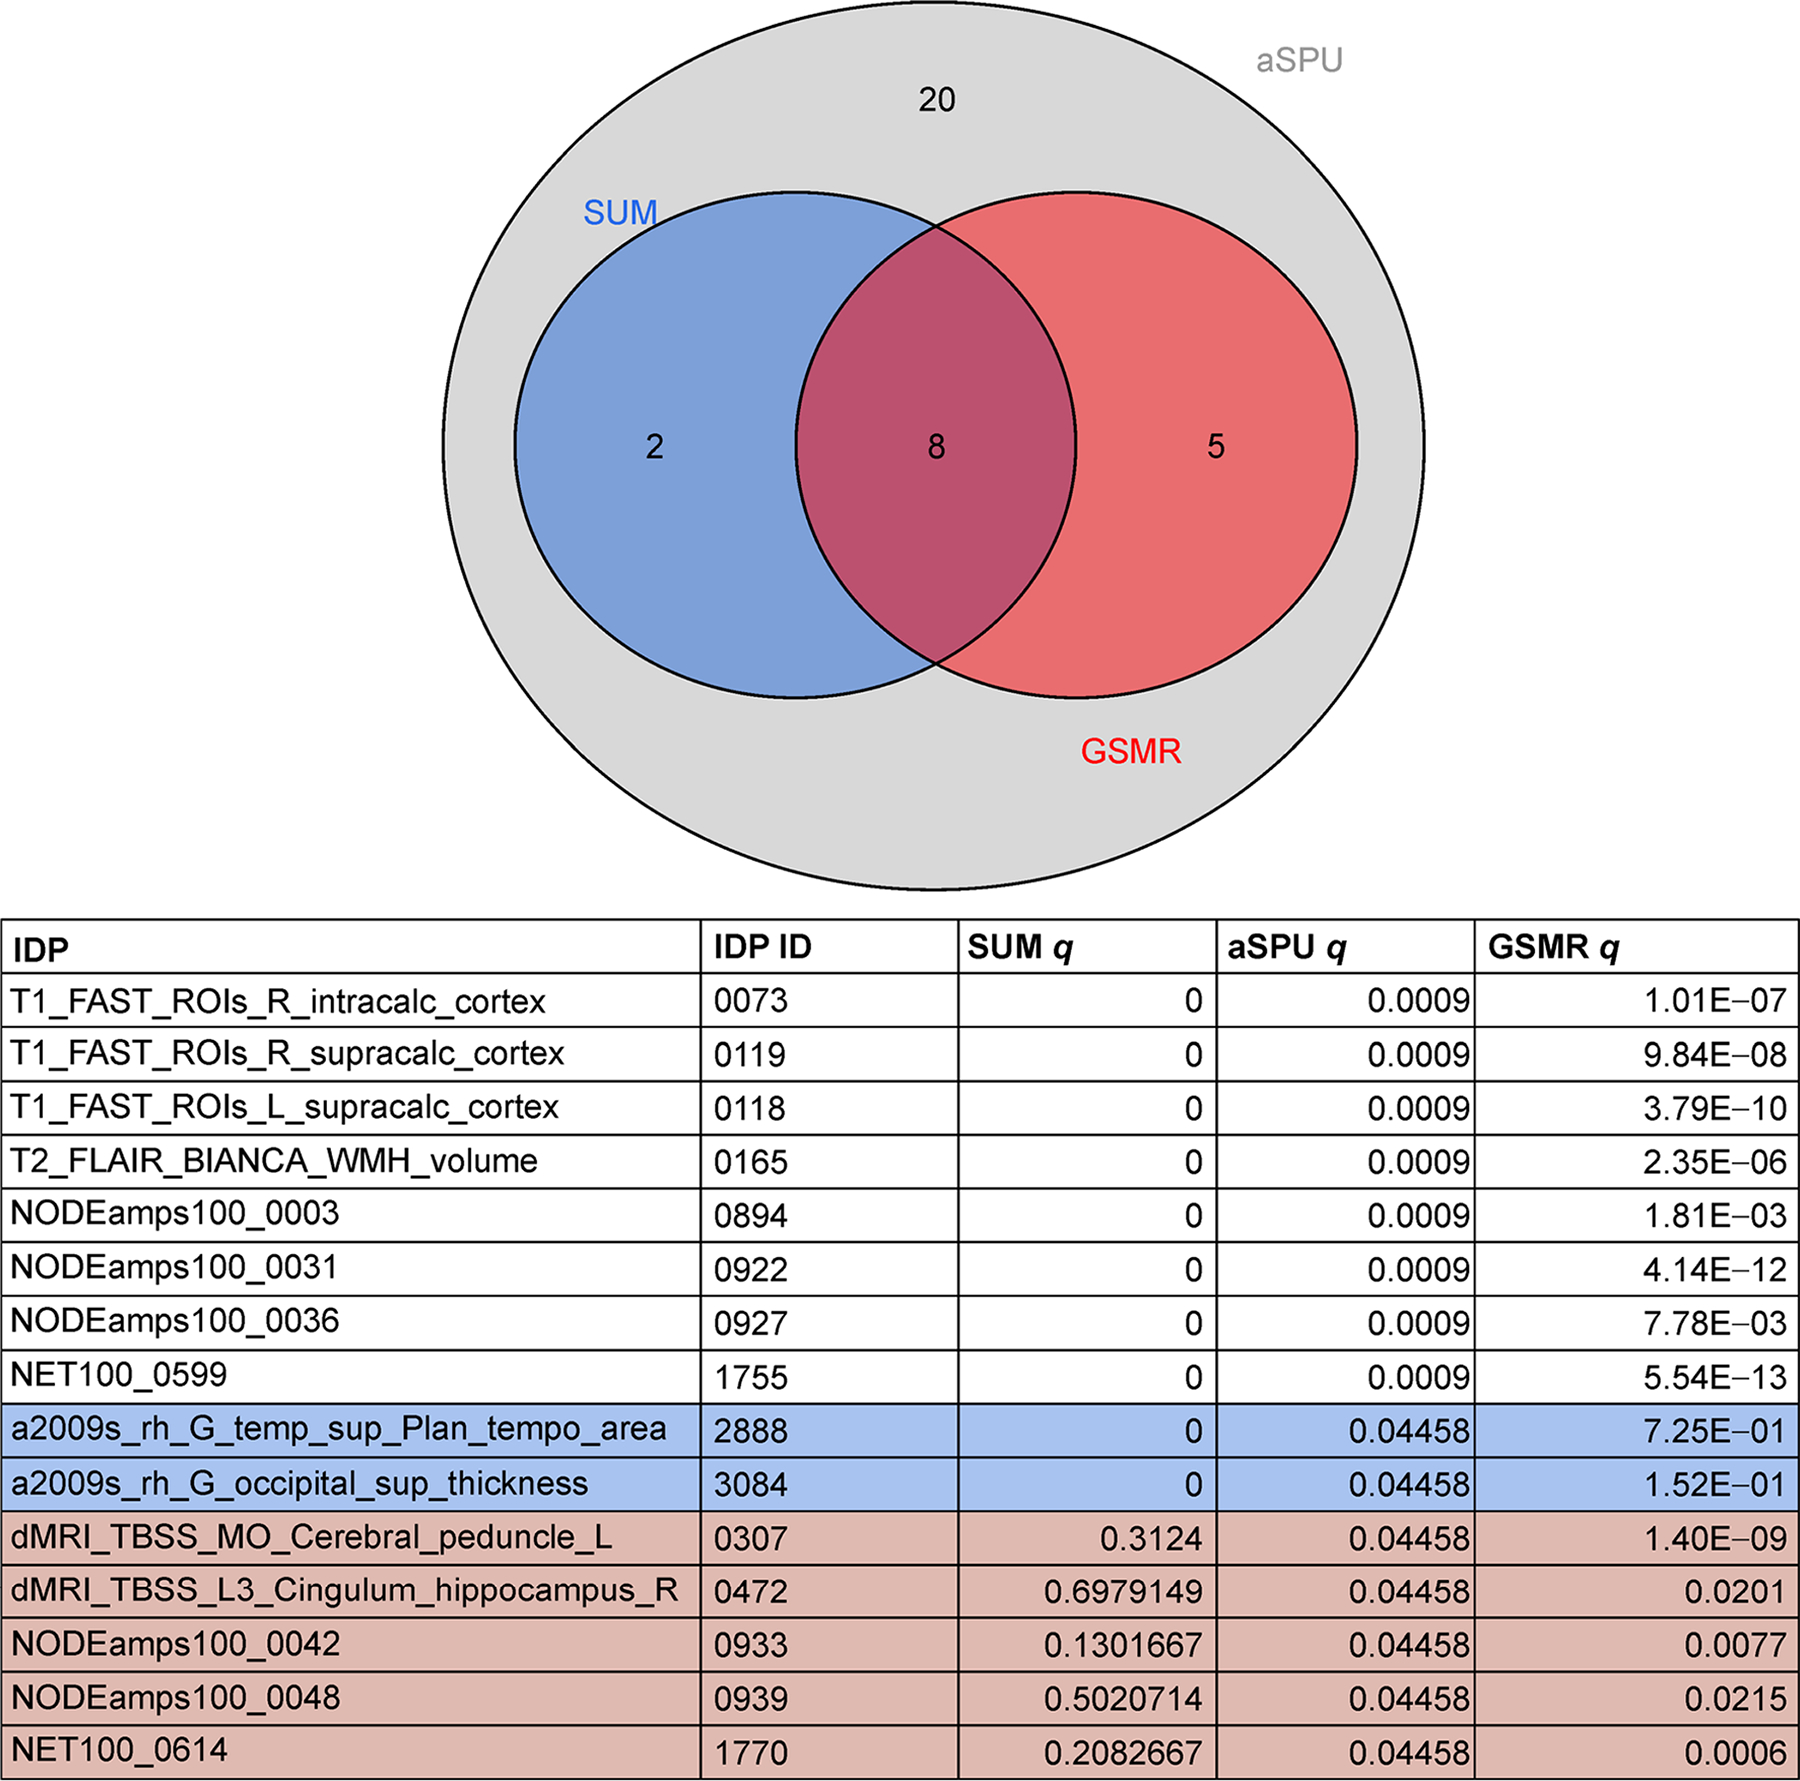
Significant IDPs for GSMR, aSPU and Sum tests for the 5 × 10⁻⁵ SNP significant threshold.
Figure 3. Manhattan plots for the 8 IDPs with significant tests for GSMR, Sum and aSPU tests.
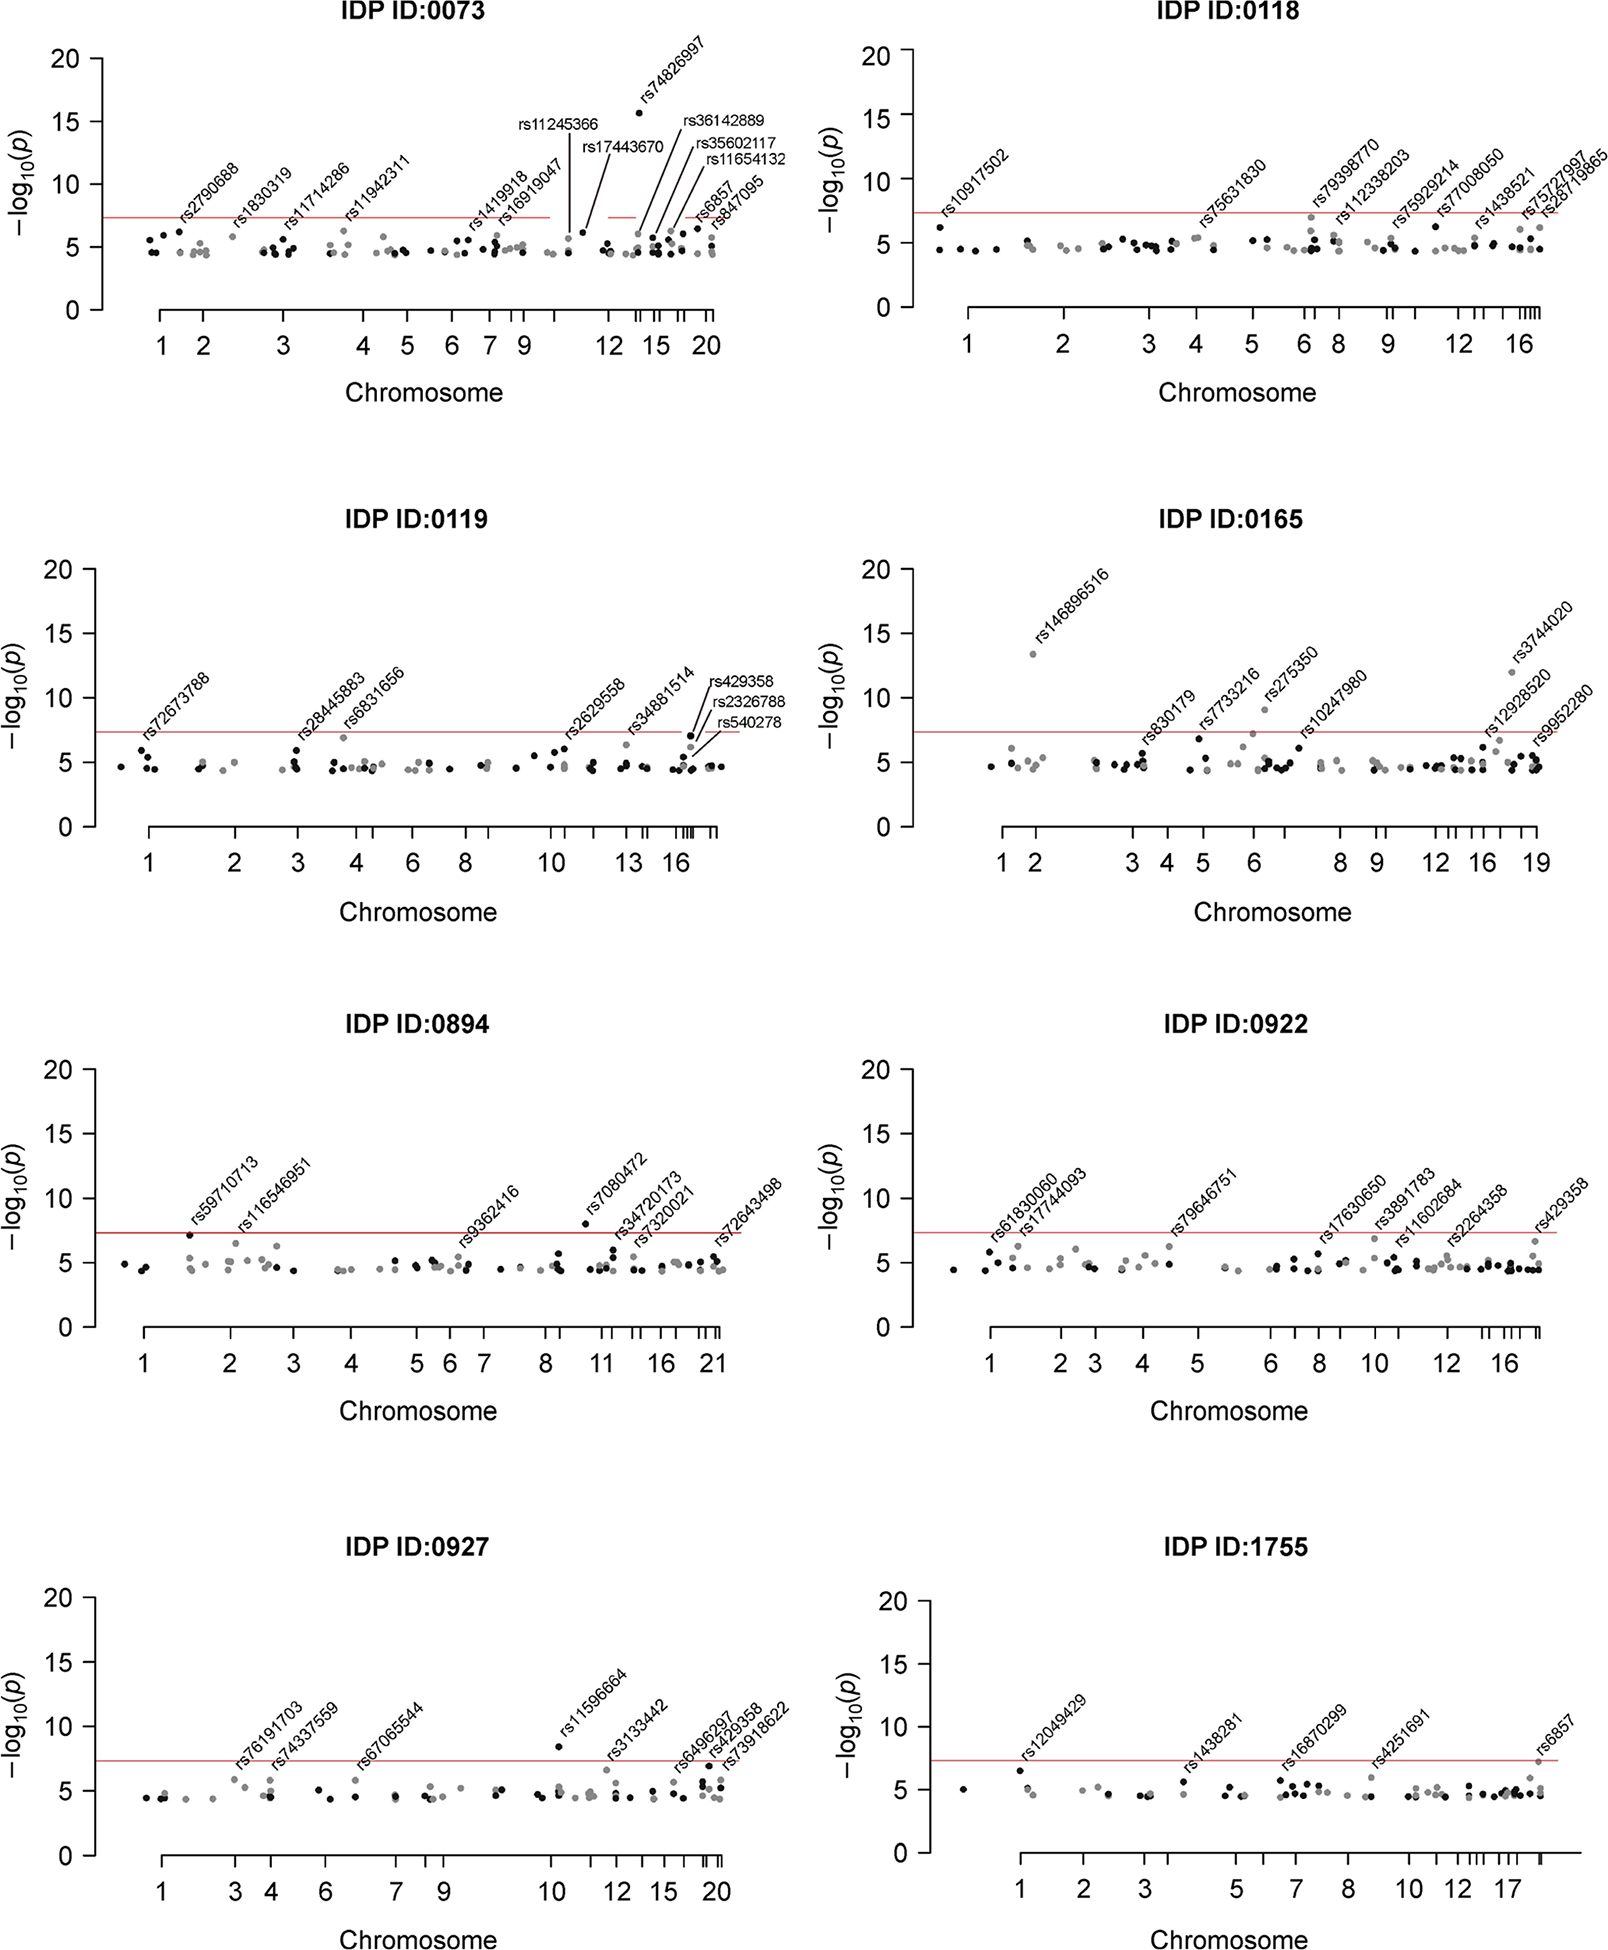
All plotted SNPs have IDP GWAS marginal p < 5 × 10⁻⁵ and passed clumping at an LD cutoff of 0.1. The red line represents genome-wide significance (p < × 5 × 10⁻⁸).
Many of these identified IDPs have supported associations with AD in the literature. Three T1-weighted structural MRI phenotypes related to the calcarine sulcus were significant for all three tests; right and left supracalcarine cortices and the right intracalcarine cortex. The calcarine sulcus houses the primary visual cortex and is involved in visuospatial perception and object recognition. Atrophy in this region has previously been implicated in AD pathogenesis [26]. Another notable IDP that was significant for all three tests is the volume of white matter hyperintensities (WMH), lesions of white matter tissue characterized by increased brightness on a T2-weighted structural MRI scan. Increased WMH volume is characteristic of the aging brain and has a well established role in late onset AD progression [27]. Other noteworthy brain phenotypes identified by at least one test at the 5 × 10⁻⁵ GWAS significance threshold include volumetric measures of the thalamus, as well as connectivity within the tapetum, cerebral peduncle, longitudinal fasciculus, cingulum-hippocampus network, and both posterior and anterior limbs of the internal capsule (Table 2). These IDPs all have previously identified AD-associations [28–32].
Table 2.
List of all IDPs significant for aSPU at the 5 × 10⁻⁵ GWAS significance threshold
| IDP | IDP fullname | q-value |
|---|---|---|
| 0012 | IDP_T1_FIRST_right_thalamus_volume | 0.04458 |
| 0073 | IDP_T1_FAST_ROIs_R_intracalc_cortex | 0.04458 |
| 0118 | IDP_T1_FAST_ROIs_L_supracalc_cortex | 0.04458 |
| 0119 | IDP_T1_FAST_ROIs_R_supracalc_cortex | 0.04458 |
| 0163 | IDP_T1_FAST_ROIs_V_cerebellum_X | 0.04458 |
| 0165 | IDP_T2_FLAIR_BIANCA_WMH_volume | 0.04458 |
| 0214 | IDP_dMRI_TBSS_FA_Posterior_limb_of_internal_capsule_R | 0.04458 |
| 0290 | IDP_dMRI_TBSS_MD_Tapetum_R | 0.04458 |
| 0307 | IDP_dMRI_TBSS_MO_Cerebral_peduncle_L | 0.04458 |
| 0310 | IDP_dMRI_TBSS_MO_Posterior_limb_of_internal_capsule_R | 0.04458 |
| 0381 | IDP_dMRI_TBSS_L1_Superior_longitudinal_fasciculus_L | 0.04458 |
| 0404 | IDP_dMRI_TBSS_L2_Anterior_limb_of_internal_capsule_R | 0.04458 |
| 0406 | IDP_dMRI_TBSS_L2_Posterior_limb_of_internal_capsule_R | 0.04458 |
| 0412 | IDP_dMRI_TBSS_L2_Superior_corona_radiata_R | 0.04458 |
| 0472 | IDP_dMRI_TBSS_L3_Cingulum_hippocampus_R | 0.04458 |
| 0520 | IDP_dMRI_TBSS_ICVF_Cingulum_hippocampus_R | 0.04458 |
| 0531 | IDP_dMRI_TBSS_ICVF_Tapetum_L | 0.04458 |
| 0676 | IDP_dMRI_ProbtrackX_MD_slf_l | 0.04458 |
| 0891 | NODEamps25_0021 | 0.04458 |
| 0894 | NODEamps100_0003 | 0.04458 |
| 0922 | NODEamps100_0031 | 0.04458 |
| 0927 | NODEamps100_0036 | 0.04458 |
| 0933 | NODEamps100_0042 | 0.04458 |
| 0939 | NODEamps100_0048 | 0.04458 |
| 1021 | NET25_0075 | 0.04458 |
| 1623 | NET100_0467 | 0.04458 |
| 1755 | NET100_0599 | 0.04458 |
| 1770 | NET100_0614 | 0.04458 |
| 2642 | IDP_T1_FIRST_left_thalamus_volume_plus_IDP_T1_FIRST_right_thalamus_volume | 0.04458 |
| 2748 | a2009s_lh_G&S_occipital_inf_area | 0.04458 |
| 2859 | a2009s_rh_G&S_cingul-Mid-Ant_area | 0.04458 |
| 2888 | a2009s_rh_G_temp_sup-Plan_tempo_area | 0.04458 |
| 2992 | a2009s_lh_G_temp_sup-Lateral_thickness | 0.04458 |
| 3064 | DKTatlas_rh_MeanThickness_thickness | 0.04458 |
| 3084 | a2009s_rh_G_occipital_sup_thickness | 0.04458 |
Figures 4 and 5 illustrate the numbers of significant IDPs at the 5 × 10⁻⁴ and 5 × 10⁻⁶ SNP significance thresholds, respectively. As with the 5 × 10⁻⁵ SNP significance threshold, no IDPs were significant for any 2SMR tests. At the 5 × 10⁻⁶ threshold, seven IDPs were significant for all three tests (Sum, aSPU and GSMR), five of which overlapped with the 5 × 10⁻⁵ threshold based results. No IDPs were significant for all three tests (Sum, GSMR, and aSPU) at the 5 × 10⁻⁴ SNP significance threshold, but of the four IDPs that were significant for both aSPU and GSMR, three were found to be significant under the other SNP significance thresholds. The following five IDPs were significant for all three GWAS significance thresholds for at least one test: T1 FAST ROIs Right Intracalcarine Cortex (ID = 0073), T1 FAST ROI Right Supracalcarine Cortex (ID = 0119), NODEamps100-0031 (ID = 0922), NODEamps100-0036 (ID = 0927) and NET100-0599 (ID = 1755), where the latter three IDPs are rfMRI measures.
Figure 4.
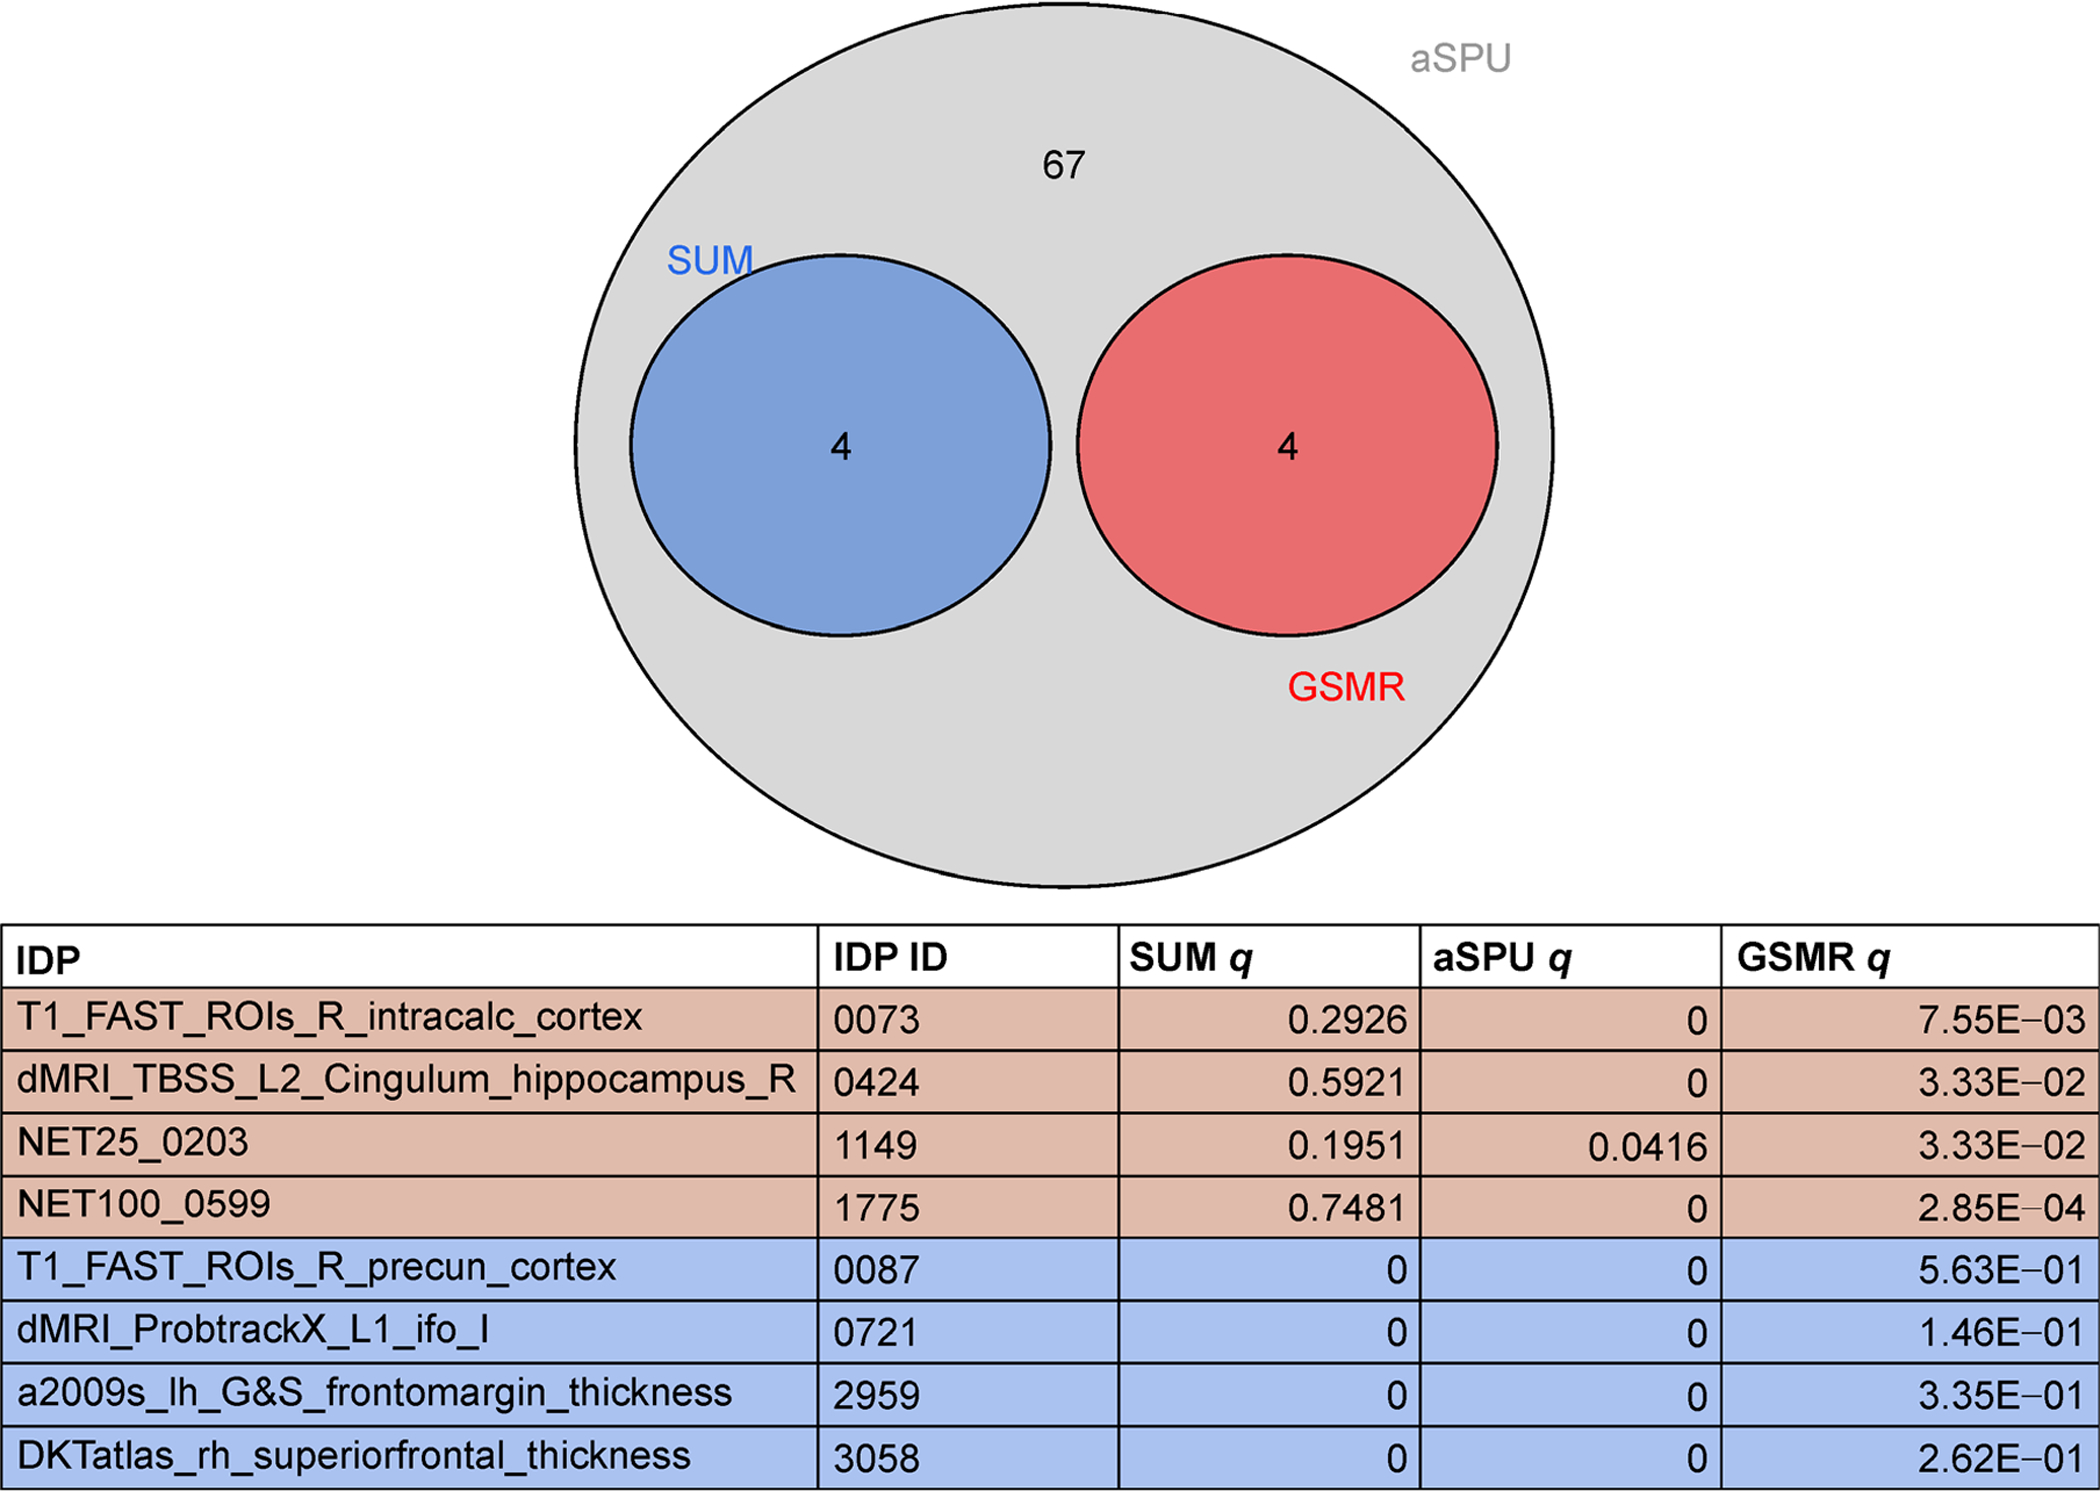
Significant IDPs for GSMR, aSPU and Sum tests at the 5 × 10⁻⁴ SNP significance threshold.
Figure 5.
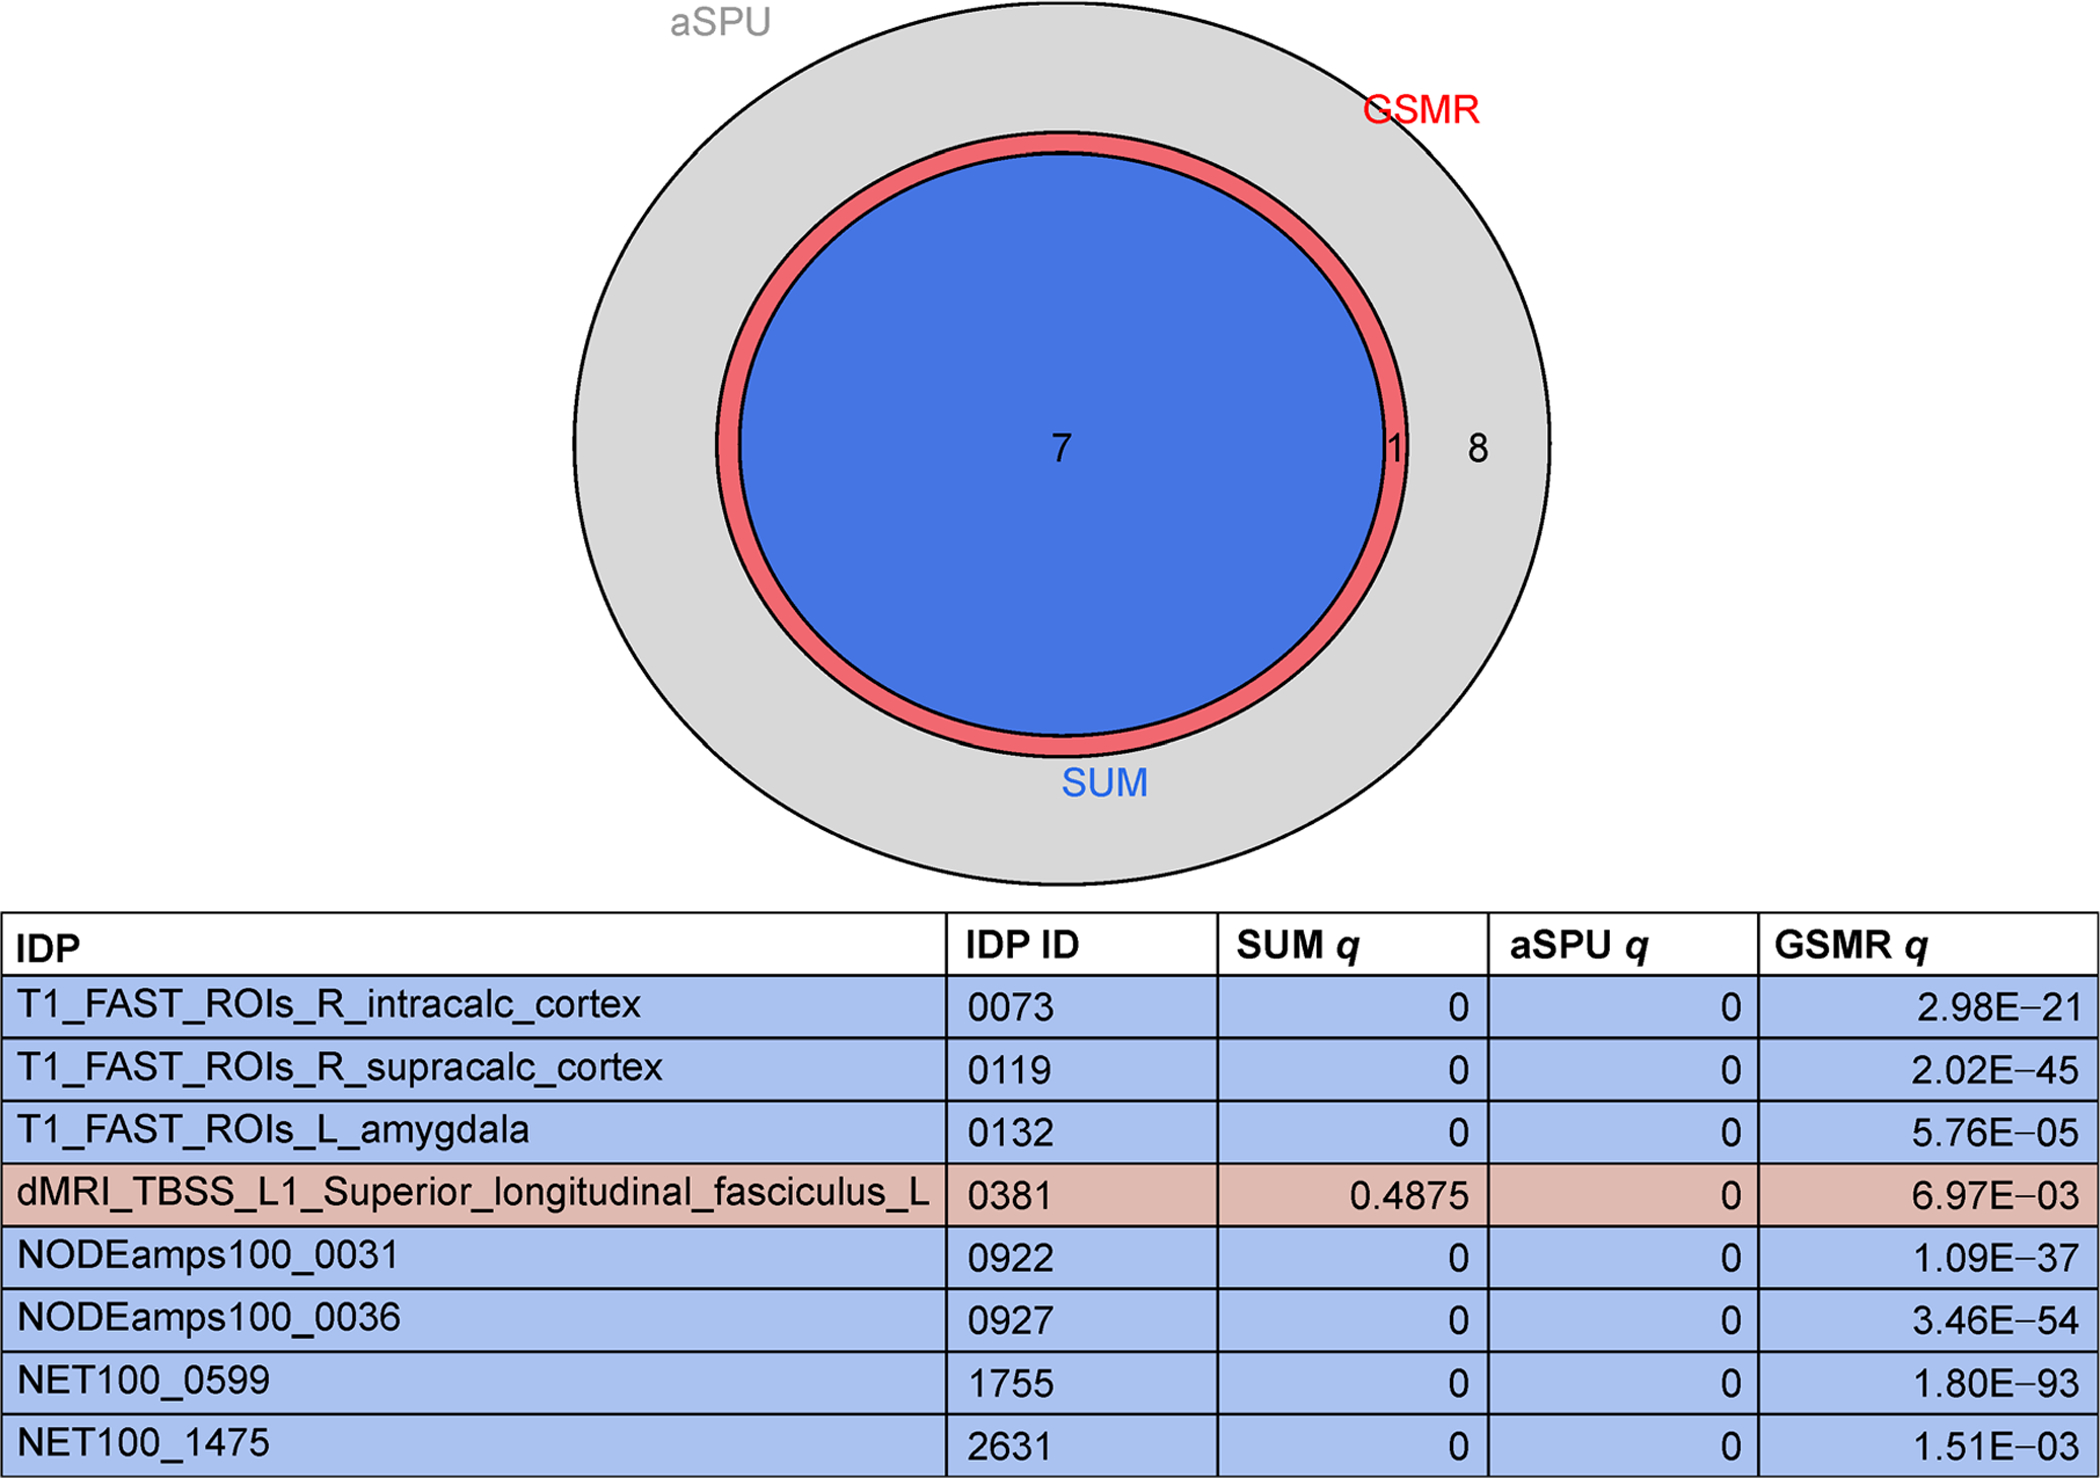
Significant IDPs for GSMR, aSPU and Sum tests at the 5 × 10⁻⁶ SNP significance threshold.
It is not entirely surprising that the GSMR and aSPU tests, increasing power by considering multiple SNPs and their LD correlations, identified more significant IDPs than the 2SMR methods. Nonetheless, we investigate the association patterns of some of the aSPU and GSMR significant IDPs to reveal potential explanations for their lack of significance under any 2SMR models.
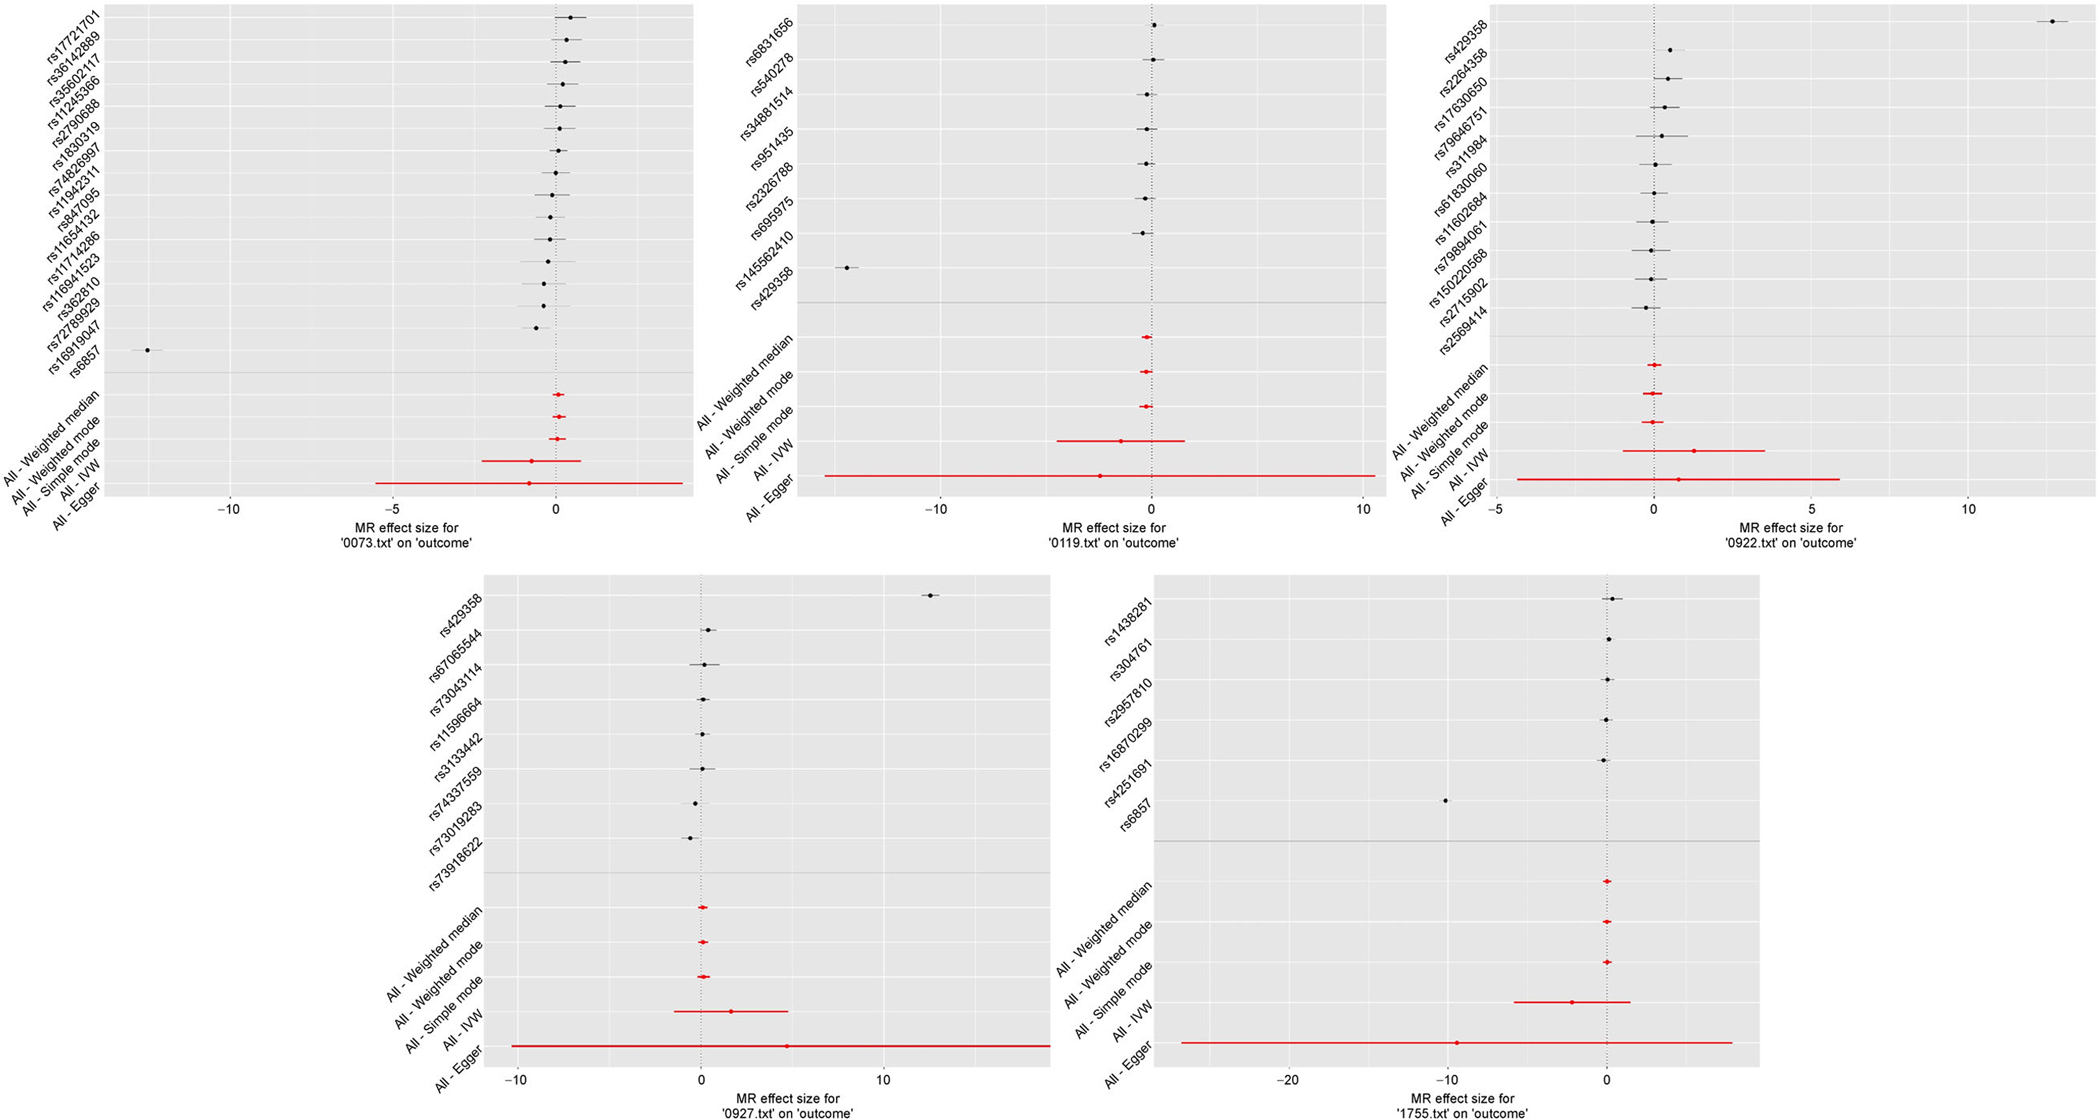
The power of the 2SMR tests can heavily rely on the independence between SNPs. Accordingly, we used a clumping R2 cutoff of 0.001 for all 2SMR models, as opposed to R2= 0.1 used for the SPU and GSMR tests. This resulted in fewer SNPs being considered in the 2SMR models as compared to the other multivariate models, though the difference was not substantial (Fig. 6). Via visual inspection of MR plots, we deduce that these excluded SNPs were not outliers and did not likely cause the discrepancies between 2SMR and multivariate models (Fig. 7). Forest plots of the marginal SNP effects at the 5 × 10⁻⁶ GWAS significance threshold show that the confidence intervals for all meta-analyses included the null value (Fig. 8). In particular, the Egger regression and IVW causal estimates, which were consistently furthest from the null value, had very large variances that drove our null findings. Ultimately, we maintain that these results highlight the improved power of the multivariate models, which account for aggregated effects and LD, over the 2SMR methods.
Figure 6.
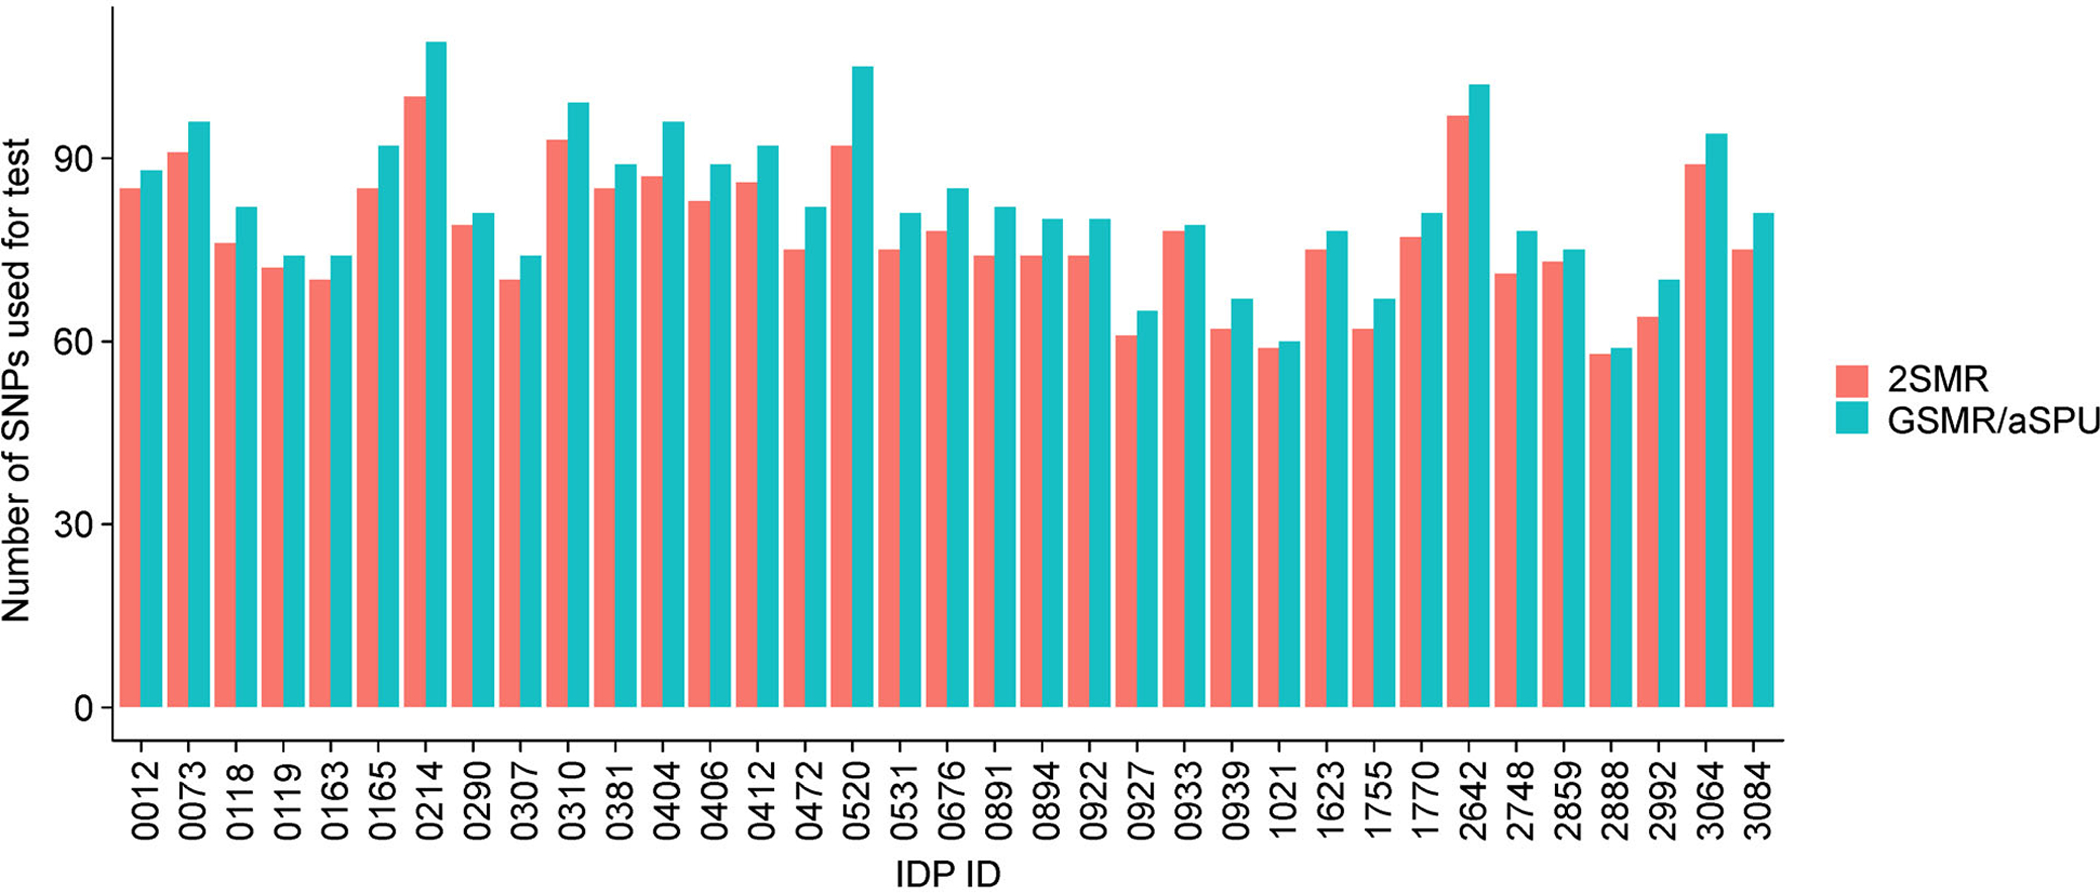
Number of SNPs used in 2SMR vs. aSPU/GSMR tests for each IDP that was significant for any test at the 5 × 10⁻⁵ SNP significance threshold.
Figure 7.
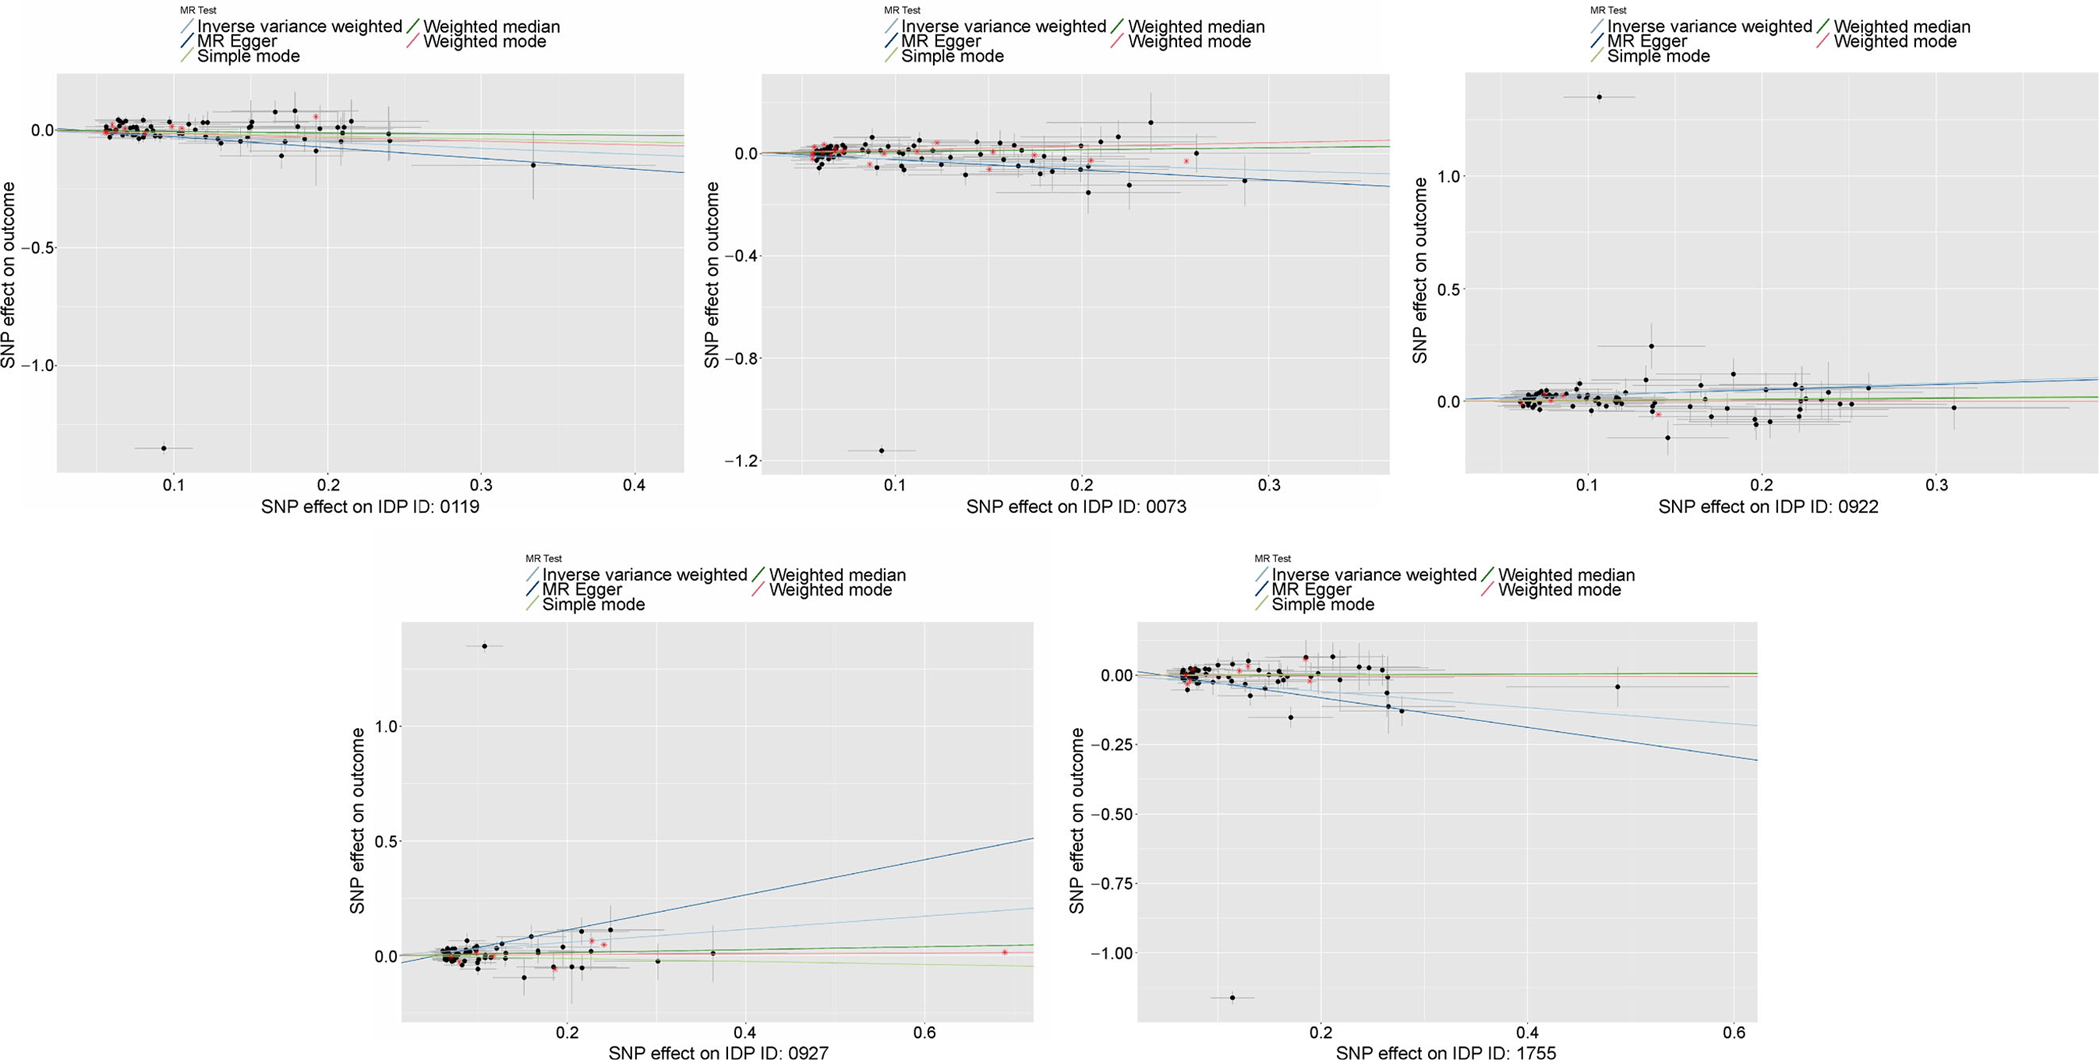
MR plots for 5 IDPs that were significant for all 3 SNP significance thresholds for at least 1 test, including effect estimates for SNPs excluded in 2SMR analysis but used in GSMR/aSPU analyses.
Figure 8. Forest plots for the 5 IDPs with significance for all 3 GWAS thresholds for at least 1 test.
All plotted SNPs have IDP GWAS marginal p < 5 × 10⁻⁶ and passed clumping at an LD cutoff of 0.1.
We have also considered the unweighted versions of the aSPU and Sum tests for the IDPs using the 5 × 10⁻⁵ p-value threshold, using the same sets of SNPs as used for the weighted versions for each IDP. There were 106 significant SNPs-AD associations from the unweighted aSPU test, more than the previously reported 35 significant aSPU test associations using IDP weights. 9 of these 35 associations were not significant for the unweighted aSPU test. The significant associations based on the weighted aSPU test, but not significant based on the unweighted test, might lend more support for the role of the corresponding IDPs for AD. In comparison, there were 21 significant SNPs-AD associations (using IDP selected sets of SNPs) from the unweighted Sum test, also more than the 10 significant associations using IDP weights. Two of these 10 associations were not significant for the unweighted Sum test (freesurfer right superior occipital thickness, freesurfer right superior temporal area); these two IDPs were included amongst the 9 significant associations by the weighted aSPU test (but not by the unweighted aSPU test), giving greater support for a direct IDP-AD association. We expect that the weighted Sum/aSPU test will improve statistical power over the unweighted version if and only if the IDP is truly an intermediate phenotype on the SNP-to-AD pathway and the effects of SNPs on the IDP are well estimated (leading to a suitably imputed endophenotype). Here we found a greater number of significant associations by the unweighted tests as compared to the weighted tests. This result is reasonable because we anticipate that many of the 1,578 IDPs are not true mediating endophenotypes.
DISCUSSION
In this study, we identified potential associations between image-derived phenotypes and Alzheimer’s disease using the following GWAS summary statistic based techniques: 2SMR, GSMR, TWAS/Sum test and aSPU test. Numerous IDPs remained significant, after FDR correction, across all tests (other than 2SMR) and various p-value thresholds for selecting IDP-associated SNPs. Many of these significant IDPs, such as the right intra- and supracalcarine cortices, have been previously implicated in AD pathogenesis.
We included variants in each model based on three marginal SNP-IDP association’s significance thresholds, following LD-clumping. The 2SMR methods picked up no significant IDP-AD associations. We found that higher significance thresholds (i.e., more variants in the model) yielded additional aSPU-significant associations, including all associations identified from the Sum test and GSMR. Results were less consistent across thresholds for the TWAS/Sum test, which can be explained by possible dilution of the signals in the Sum test statistic when more neutral SNPs are included or when SNP effects of opposite signs cancel out. The GSMR method identified the fewest associations at the lowest significance threshold, possibly explained by the presence of weak instruments and violation of some IV assumptions. Ultimately, these results illustrate the improved statistical power of multiple correlated SNPs-based methods, such as aSPU, GSMR and TWAS, over the 2SMR methods that utilize only independent SNPs.
METHODS
Data: IGAP and UKBB
The International Genomics of Alzheimer’s Project combined genetic data from four major studies (EADI, ADGC, CHARGE, GERAD) in AD, resulting in the combined genotypic data of 17,008 AD cases and 37,154 controls with 7,055,881 SNPs [5]. In the first stage of their two-stage meta analysis, they performed a GWAS on these data and publicly reported summary statistics. These data can be found at the website (web.pasteur-lille.fr/en/recherche/u744/igap/igap_download.php).
The UK Biobank, a large-scale prospective cohort study initiated in 2006, collected phenotypic and genotypic data of 500,000 UK residents. This comprehensive repository of data is a powerful resource for the study of gene-disease associations. In 2014, UKBB initiated collection of brain imaging data from a subset of participants, with a projected 100,000 participants with these data by 2022. These data include functional, diffusion, and three modalities of structural MRI, which were further processed to identify 3,144 image-derived phenotypes that characterize brain connectivity and structure. Elliott et al. [24] performed GWAS on each of these 3,144 IDPs using the imaging and genetic data from 8,428 UKBB participants. The GWAS summary statistics from these studies are publicly available at the website (big.stats.ox.ac.uk/download_page).
Two-sample Mendelian randomization
MR is a method that uses a genetic variant as an IV to infer a causal relationship between a risk phenotype and disease. The MR framework is illustrated in Fig. 9, where we define Y as the disease, X as the risk phenotype, Zj as the SNP instrument, and C as any confounding variables of the phenotype-disease association. We use the notation and to represent the estimated effect of SNP j on the disease and risk phenotypes, respectively. These can be obtained using the effect estimates of SNP phenotype and SNP-disease associations from GWAS summary statistics. Greater power can be achieved if these data come from independent cohorts of similar ancestry due to the effective increase in sample size, hence the terminology “two sample” MR [6]. The estimated causal effect of the risk phenotype on disease, as mediated through the genetic variant, is simply given as with approximate standard error .
Figure 9. Mendelian randomization framework.
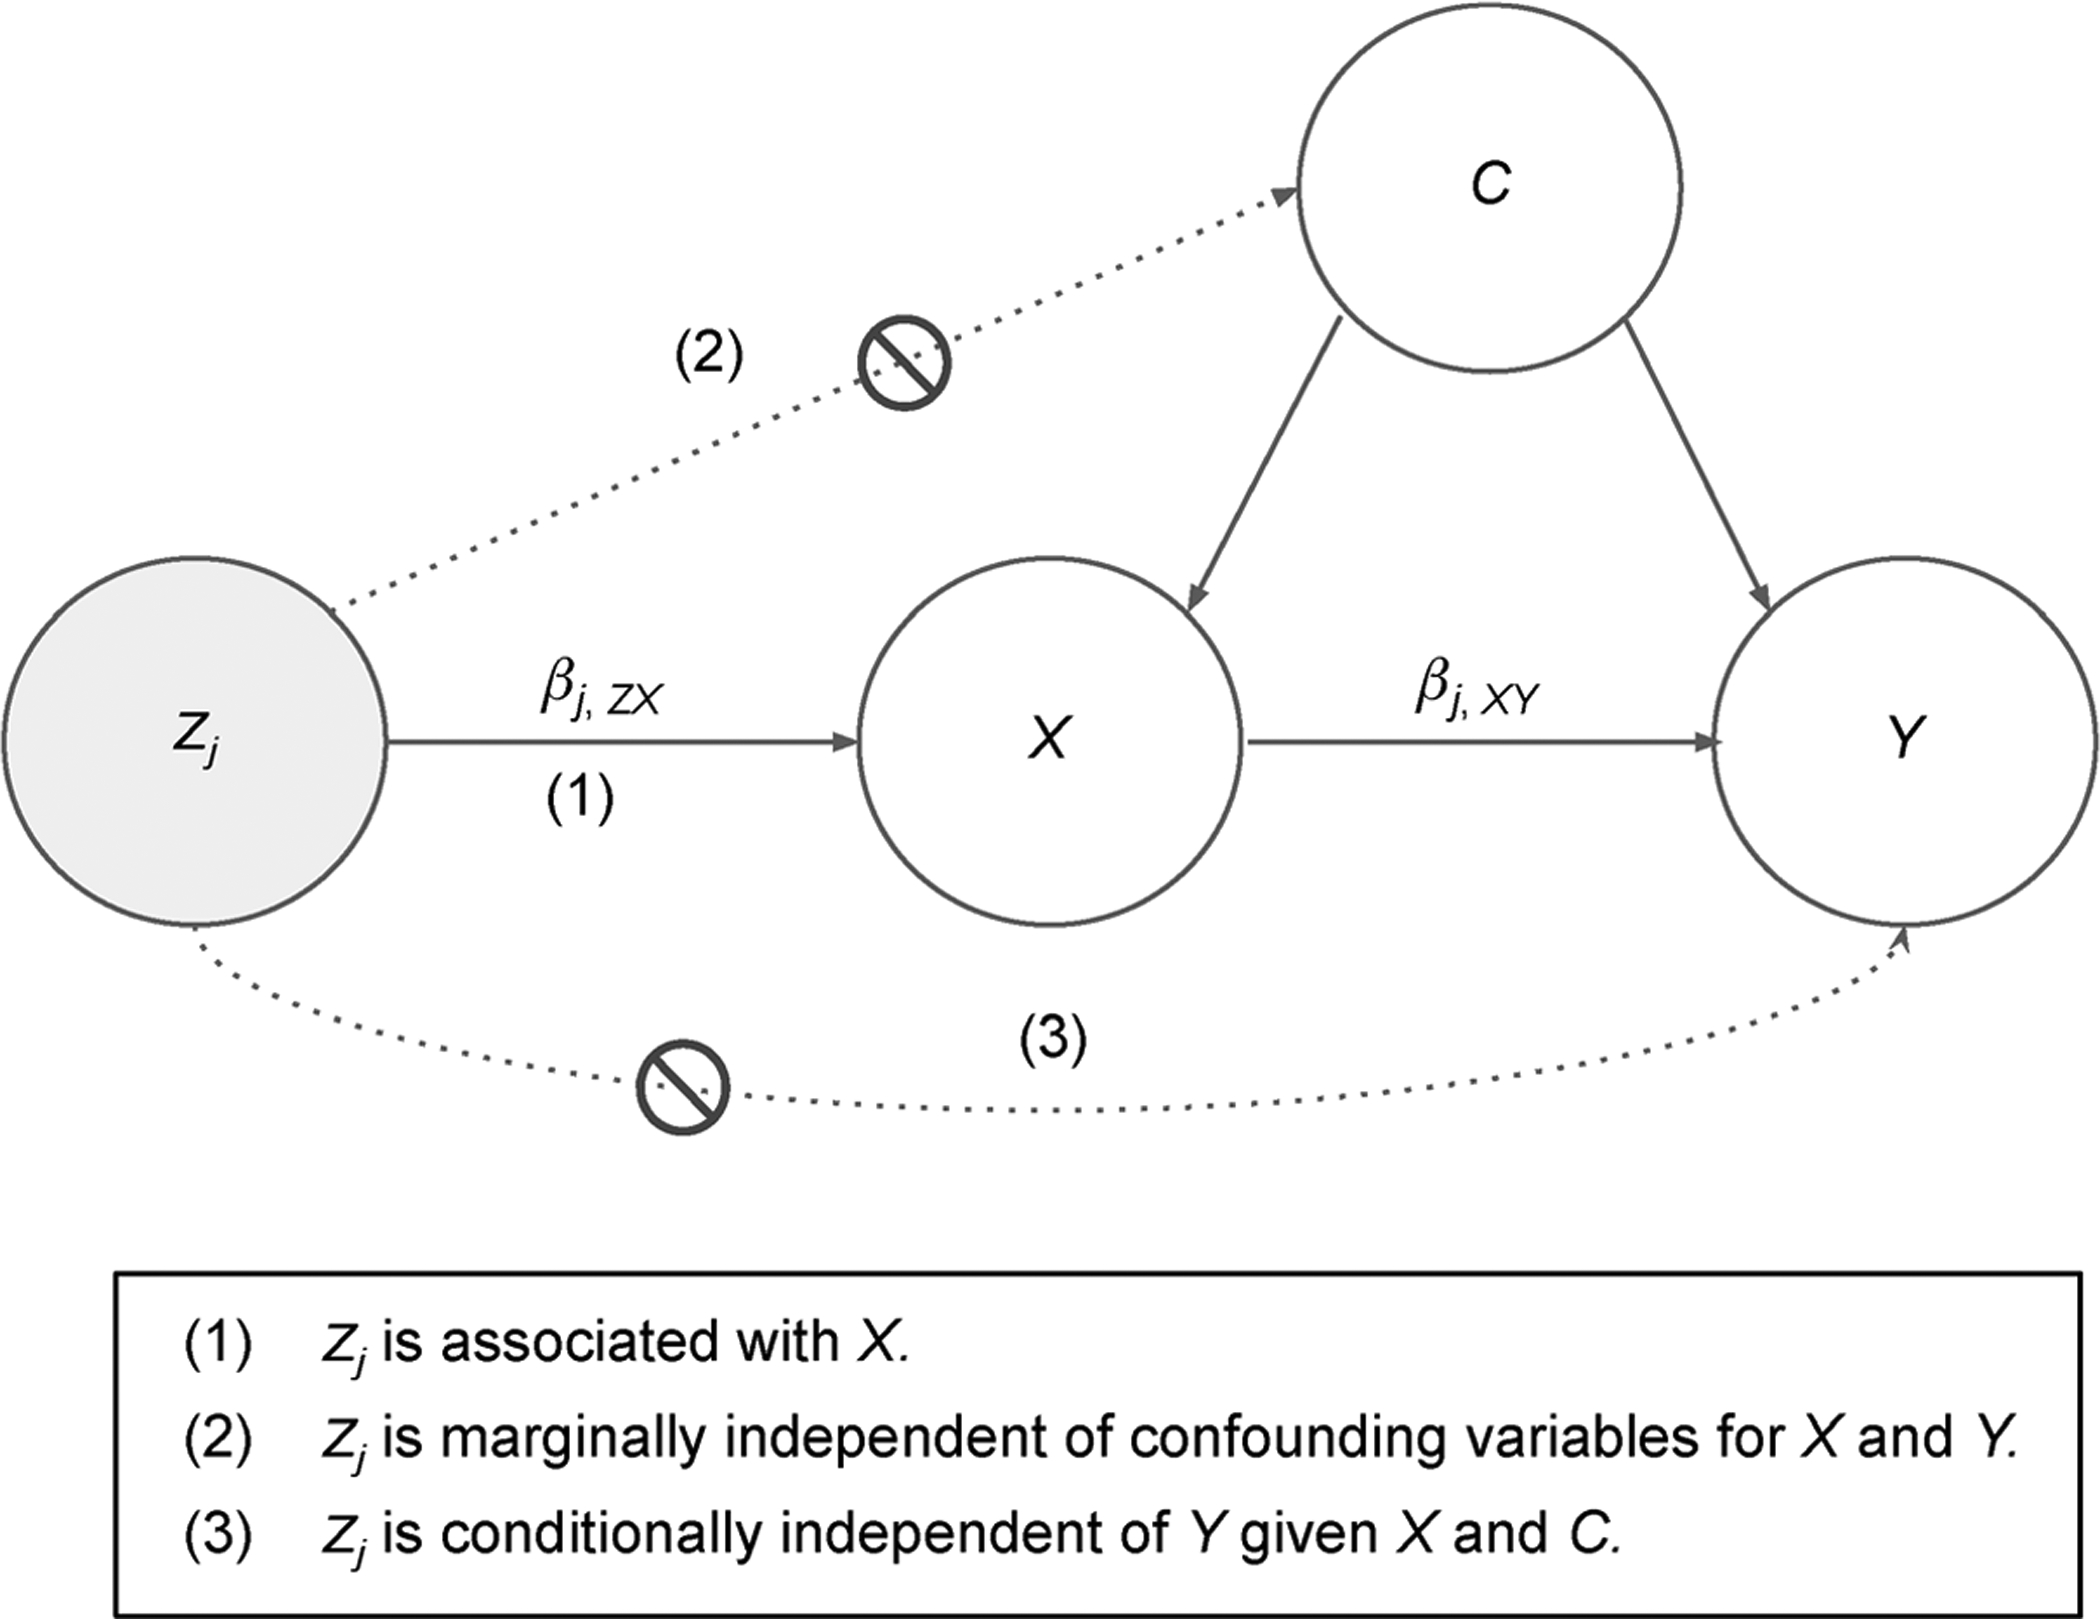
MR uses a genetic variant, Zj, as an instrumental variable to infer the relationship between a phenotype, X, and a disease, Y. There is a possible presence of some hidden/unknown confounders, C.
There are three key assumptions of the MR model that must be met for consistency of causal estimates: (i) the IV must be associated with the risk phenotype; (ii) the IV must be marginally independent of the unknown confounders of the risk phenotype-disease association; and (iii) the IV must be independent of the disease, conditional on the risk phenotype and confounders. The first of these assumptions, also known as the strong instruments assumption, can be met by restricting the set of instruments to those that were highly significant in the endophenotype GWAS. In our present study, we consider three different marginal p-value thresholds to select strong instruments from the IDP GWAS: 5 × 10⁻⁴, 5 × 10⁻⁵, and 5 × 10⁻⁶. The latter two assumptions are difficult to check, partly because the hidden confounding variables are unobserved.
The 2SMR model illustrated in Fig. 9 considers only a single IV, Zj, at a time. However, methods have been developed to boost power by combining the MR estimates across a set of multiple SNPs. These methods borrow from existing meta-analysis techniques and include methods such as Egger regression, inverse variance weighting (IVW), simple mode, weighted median, and weighted mode. In our present study, we implement these five MR techniques in R using MR-base v.0.4.22 [33]. Here, we will briefly introduce IVW meta-analysis.
Consider a set of p SNPs, each with 2SMR estimates and , j ∈ 1, …, p. The IVW estimate is an average of these p effect estimates, weighted by their corresponding variances:
| (1) |
| (2) |
Therefore, having combined information across all independent SNPs, we can simply test the null hypothesis of no causal effect of X on Y, H0:βIVW = 0, via a Wald or Z test.
One notable consideration for these meta-analysis techniques is the correlation structure of the instrumental variables. If the set GWAS-significant SNPs are correlated, i.e., in linkage disequilibrium, the number of truly causal variants is likely overestimated. Furthermore, the presence of these weak instruments threatens assumption 1 of the MR model. To avoid this potential for bias, we only consider a set of independent significant SNPs by performing LD clumping with an R2 cutoff of 0.001 before performing MR.
Generalized summary statistic-based Mendelian randomization
As previously discussed, the 2SMR meta-analysis techniques are naive to the instrument correlation structure and thereby necessitates independence amongst SNPs. Generalized Summary Statistic Based Mendelian Randomization, or GSMR, is a more powerful multivariate approach that accounts for LD in estimating a causal association between the phenotype and disease.
Consider a set of p GWAS significant SNPs in LD. The vector of p marginal MR estimates is given by
where Σ is the covariance matrix of with entries estimated by,
where r is the correlation (LD) between SNPs i and j. Using a standard ordinary (or generalized) least squares (OLS or GLS) transformation, we can estimate a generalized effect of X on Y:
| (3) |
| (4) |
The null hypothesis of no causal effect of X on Y can be tested using a wald test, (1). We use the 1000 Genomes reference panel to estimate all LD correlations and implement these analyses using the GSMR package v.1.0.8 in R.
The Sum test with individual-level data
To motivate understanding of the summary statistic based TWAS (Sum) and aSPU tests, we first introduce the Sum test using individual level phenotype and genotype data for n samples. Let Yi represent a binary disease (i.e., AD) and Zi be the vector of genotypes for p SNPs in LD for subject i. We consider the logistic regression model,
| (5) |
where each βj, j ∈ 1, …, p, represents the effect of SNP j on Y. We first consider a test for any genetic association with the disease, corresponding to the global null hypothesis H0 : β1 = … = βp. While there are three asymptotically equivalent tests for this hypothesis (Score, Wald, and LRT), we will only consider the score test to facilitate extensions to the Sum and aSPU tests.
Under the logistic regression model, the score vector U (i.e., the vector of first derivatives in βj of the log likelihood for j ∈ 1, …, p) and its covariance matrix V are given by:
The asymptotic distribution of U under H0 is N(0, V). If we make the assumption that all SNPs have equal effects on the disease and again consider H0 : β1 = … = βp, we may reduce model (5) to a simple logistic regression model, given by model (6), and instead simply test H0 : β = 0 [20] in
| (6) |
This formulation is equivalent to the Sum test, which achieves possibly improved power over the multivariate model (5) for testing for a gene-disease association under the assumption of homogeneous SNP effects (βj’s). The test statistic for the Sum test is given by .
The weighted Sum test with individual-level data
Let be the estimated effect of SNP j on an imaging phenotype from the IDP GWAS summary statistics. We can consider as an imputed trait, reflecting the genetic contribution toward the IDP for subject i. That is, is the weighted sum of risk alleles in subject i, where each SNP is weighted by the estimated effects from the IDP GWAS summary statistics. Replacing in model (6) with this imputed trait yields the following:
| (7) |
We again consider testing H0 : β = 0, which can now be interpreted as no “genetically-regulated” effect of the phenotype on disease. This null hypothesis corresponds to the Sum test with score vectors based on the weighted SNP effects,
| (8) |
where . This model is analogous to the transcriptome-wide association study, which derives weights based on eQTL data to test the effect of gene expression on disease.
The SPU and aSPU tests with individual-level data
One drawback of the Sum test is the loss of power that can occur when the weighted SNP effects are of opposite signs and each SNP’s effect contribution is canceled out, yielding a small TSum statistic and failure to reject H0. The sum of powered score (SPU) tests were motivated by this issue and are defined as
| (9) |
of which the Sum test is a special case when γ = 1. As with the Sum test, wj in Eq. (9) are obtained from the j-th SNP’s GWAS effect estimate from IDP summary statistics. By summing over , the SPU(2) test (aka sum of squared score (SSU) test) is invariant to the directions of Uj. Therefore, this test may be more powerful than the sum test in some situations. In general, as γ increases, SPU(γ) applies larger weights to larger Uj, thereby giving larger influence to those test statistics that support rejection of H0. Consequently, the choice of γ can critically impact the power of the SPU test. The adaptive SPU test, or aSPU, provides a data adaptive solution for the selection of γ that maintains high power across scenarios.
Consider a set of possible values of γ, such as Γ = [1, …, 8, ∞], which is the set of we will consider in our analysis. If PSPU(γ) is the p-value corresponding to the SPU(γ) test, the aSPU test statistic is given by:
The p-values for the SPU tests are estimated via Monte Carlo simulations, where B null test statistics are calculated based on resamples from the asymptotic normal null distribution of the U, notated as [21]:
| (10) |
| (11) |
The SPU and aSPU tests with summary statistics
In our present study, we use an adaptation of the the aforementioned SPU and aSPU tests that only require GWAS summary statistics and estimated LD correlations from a reference panel. Let Q = (Q1, Q2, …, Qp)T be the vector of Z statistics from the disease GWAS statistics, where . Note that the Wald (Z statistic) and Score tests are asymptotically equivalent, so . By these approximations, we can calculate the SPU test statistics by redefining Uj = Qj in Eq. (9);
| (12) |
| (13) |
Note that the asymptotic distribution of Z under H0 is N(0, R), where R = Cov(Qj, Qk). Further, note that
We can easily estimate and thereby Cov(Qj, Qk), using a reference panel of similar ancestry to that of the GWAS cohorts. Therefore, the asymptotic distribution for the TSPU(1) is N(0, WRWT), since E[TSPUs(1)] = E[WQ] = 0 and Var[TSPUs(1)] = Var[WQ] = WRWT for large n.
Testing procedure
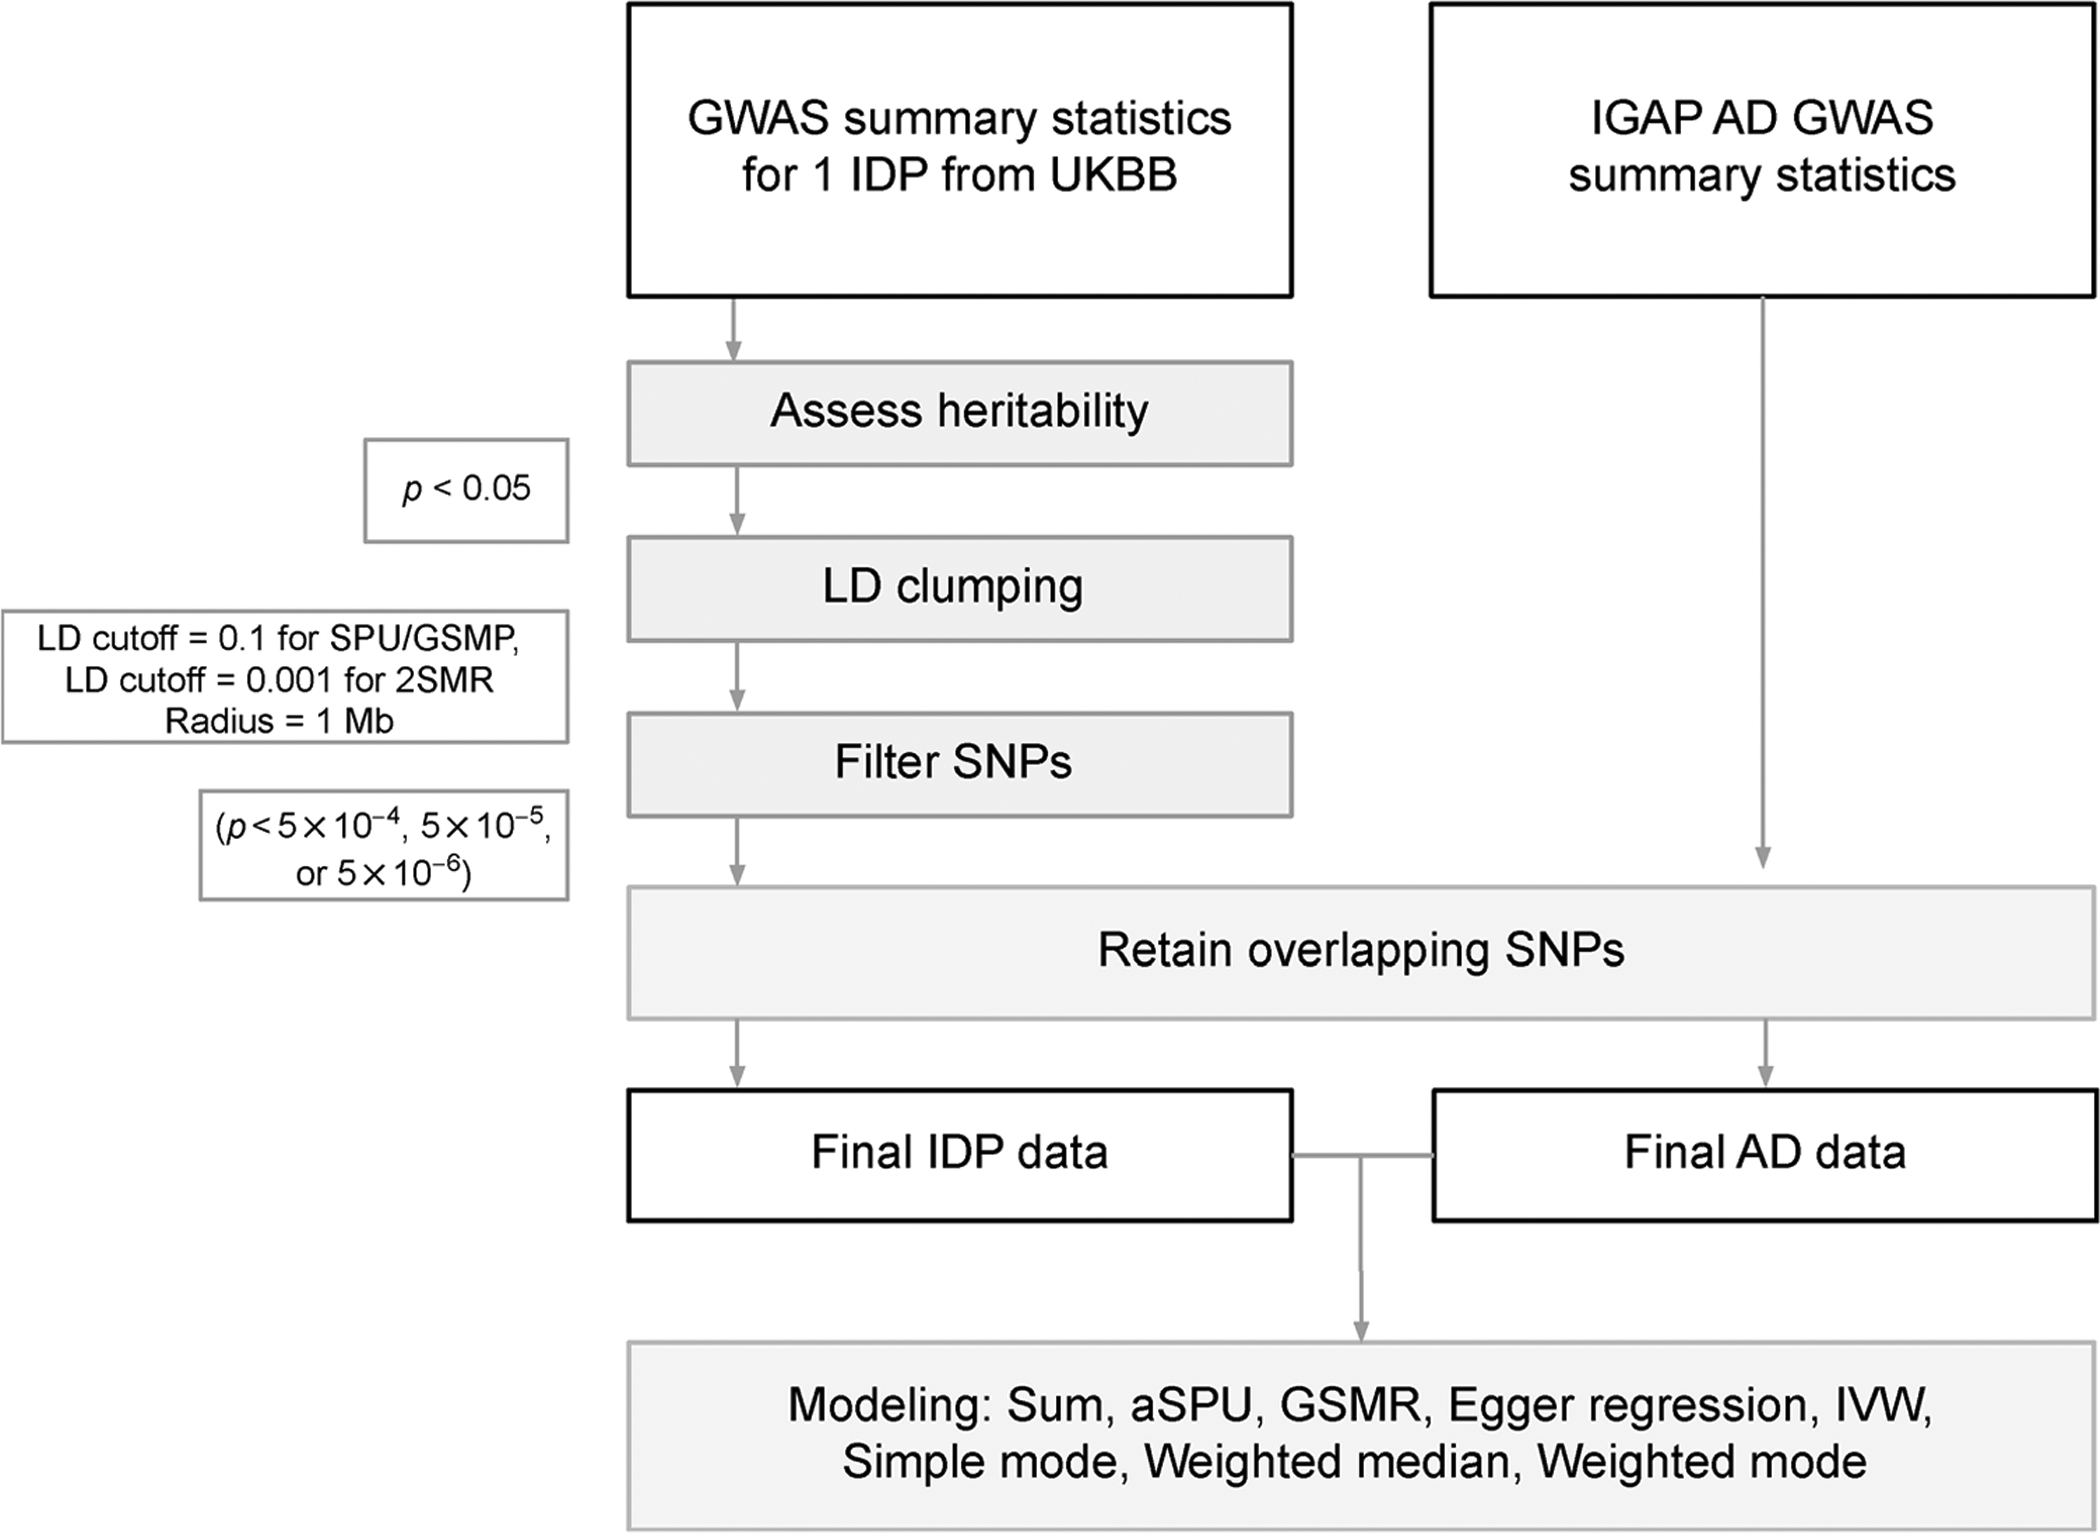
Figure 10 presents the workow for testing the association between a single IDP and AD. Elliott et al. published results from a heritability analysis of all 3,144 IDPs using LD score regression [8]. We only considered the 1,578 IDPs that were identified as heritable through their analysis. For each of these heritable IDPs, we performed LD Clumping using the 1000 Genomes reference panel with a clumping radius of 1 Mb. For the SPU and GSMR tests, we clumped with an r2 cutoff of 0.1. We further restricted the r2 cutoff to 0.0001 for the 2SMR tests. SNPs for the IDP datasets were further filtered based on three significance thresholds, 5 × 10⁻⁴, 5 × 10⁻⁵ and 5 × 10⁻⁶. For MR analyses, we aimed to filter out weak instruments (i.e., those SNPs with minimal association with the phenotype) while also retaining enough SNPs to support an informative model. Table 3 gives a summary of the number of overlapping SNPs after filtering at the three GWAS significance thresholds and further compares the number of variants used in the SPU and GSMR tests versus 2SMR, for which we used a restricted set of “independent” SNPs resulting from more stringent LD clumping (R2 < 0.001). Based on these numbers, we primarily focus on our conclusions based on the 5 × 10⁻⁵ p-value cut-off, but compare results across thresholds. p-values from all analyses were adjusted using FDR at α = 0.05 and will be reported as q-values. The LD correlation matrices used in the SPU and GSMR tests were estimated using the 1000 Genomes reference panel, assuming independence between chromosomes. Example code can be found at the website (github.com/kathalexknuts/ADIDP).
Figure 10.
Data processing workow for testing the association between AD and a single IDP using marginal SNP effect estimates.
Table 3.
Number of overlapping SNPs at each significance threshold for the GSMR/SPU tests vs. 2SMR tests
| Threshold | Min # of SNPs (GSMR/SPU tests) | Mean # of SNPs (GSMR/SPU tests) | Max # of SNPs (GSMR/SPU tests) | Min # of SNPs (2SMR tests) | Mean # of SNPs (2SMR tests) | Max # of SNPs (2SMR tests) |
|---|---|---|---|---|---|---|
| 5×10⁻⁴ | 522 | 624 | 748 | 440 | 532 | 651 |
| 5×10⁻⁵ | 43 | 81 | 132 | 35 | 70 | 112 |
| 5×10⁻⁶ | 3 | 12 | 35 | 3 | 10 | 31 |
ACKNOWLEDGEMENTS
We thank the reviewers for many helpful comments. This work was supported by NIH grants T32GM108557, R01AG065636, R01HL116720, R01GM113250 and R01GM126002, and by the Minnesota Supercomputing Institute at the University of Minnesota.
Footnotes
Availability: Example code is available at https://github.com/kathalexknuts/ADIDP.
COMPLIANCE WITH ETHICS GUIDELINES
The authors Katherine A. Knutson and Wei Pan declare that they have no conflict of interests.
All procedures performed in studies were in accordance with the ethical standards of the institution.
REFERENCES
- 1.Alzheimer’s Association (2016) 2016 Alzheimer’s disease facts and figures. Alzheimers Dement., 12, 459–509 [DOI] [PubMed] [Google Scholar]
- 2.Frisoni GB, Fox NC, Jack CR Jr, Scheltens P and Thompson PM (2010) The clinical use of structural MRI in Alzheimer disease. Nat. Rev. Neurol, 6, 67–77 [DOI] [PMC free article] [PubMed] [Google Scholar]
- 3.Greicius MD, Srivastava G, Reiss AL and Menon V (2004) Default-mode network activity distinguishes Alzheimer’s disease from healthy aging: evidence from functional MRI. Proc. Natl. Acad. Sci. USA, 101, 4637–4642 [DOI] [PMC free article] [PubMed] [Google Scholar]
- 4.Zhang Y, Schuff N, Du AT, Rosen HJ, Kramer JH, Gorno-Tempini ML, Miller BL and Weiner MW (2009) White matter damage in frontotemporal dementia and Alzheimer’s disease measured by diffusion MRI. Brain, 132, 2579–2592 [DOI] [PMC free article] [PubMed] [Google Scholar]
- 5.Lambert J-C, Ibrahim-Verbaas CA, Harold D, Naj AC, Sims R, Bellenguez C, Jun G, DeStefano AL, Bis JC, Beecham GW, et al. (2013) Meta-analysis of 74,046 individuals identifies 11 new susceptibility loci for Alzheimer’s disease. Nat. Genet, 45, 1452–1458 [DOI] [PMC free article] [PubMed] [Google Scholar]
- 6.Pierce BL and Burgess S (2013) Efficient design for Mendelian randomization studies: subsample and 2-sample instrumental variable estimators. Am. J. Epidemiol, 178, 1177–1184 [DOI] [PMC free article] [PubMed] [Google Scholar]
- 7.Zhu Z, Zheng Z, Zhang F, Wu Y, Trzaskowski M, Maier R, Robinson MR, McGrath JJ, Visscher PM, Wray NR, et al. (2018) Causal associations between risk factors and common diseases inferred from GWAS summary data. Nat. Commun, 9, 224. [DOI] [PMC free article] [PubMed] [Google Scholar]
- 8.Gamazon ER, Wheeler HE, Shah KP, Mozaffari SV, Aquino-Michaels K, Carroll RJ, Eyler AE, Denny JC, Nicolae DL, Cox NJ, et al. (2015) A gene-based association method for mapping traits using reference transcriptome data. Nat. Genet, 47, 1091–1098 [DOI] [PMC free article] [PubMed] [Google Scholar]
- 9.Gusev A, Ko A, Shi H, Bhatia G, Chung W, Penninx BW, Jansen R, de Geus EJ, Boomsma DI, Wright FA, et al. (2016) Integrative approaches for large-scale transcriptome-wide association studies. Nat. Genet, 48, 245–252 [DOI] [PMC free article] [PubMed] [Google Scholar]
- 10.Xu Z, Wu C, Wei P and Pan W (2017) A powerful framework for integrating eQTL and GWAS summary data. Genetics, 207, 893–902 [DOI] [PMC free article] [PubMed] [Google Scholar]
- 11.Yang C, Wan X, Lin X, Chen M, Zhou X and Liu J (2019) CoMM: a collaborative mixed model to dissecting genetic contributions to complex traits by leveraging regulatory information. Bioinformatics, 35, 1644–1652 [DOI] [PubMed] [Google Scholar]
- 12.Barbeira AN, Pividori M, Zheng J, Wheeler HE, Nicolae DL and Im HK (2019) Integrating predicted transcriptome from multiple tissues improves association detection. PLoS Genet, 15, e1007889. [DOI] [PMC free article] [PubMed] [Google Scholar]
- 13.Hu Y, Li M, Lu Q, Weng H, Wang J, Zekavat SM, Yu Z, Li B, Gu J, Muchnik S, et al. (2019) A statistical framework for cross-tissue transcriptome-wide association analysis. Nat. Genet, 51, 568–576 [DOI] [PMC free article] [PubMed] [Google Scholar]
- 14.Yang Y, Shi X, Jiao Y, Huang J, Chen M, Zhou X, Sun L, Lin X, Yang C and Liu J (2019) CoMM-S2: a collaborative mixed model using summary statistics in transcriptome-wide association studies. Bioinformatics, 36, 2009–2016 [DOI] [PubMed] [Google Scholar]
- 15.Xu Z, Wu C and Pan W, and the Alzheimer’s Disease Neuroimaging Initiative. (2017) Imaging-wide association study: integrating imaging endophenotypes in GWAS. Neuroimage, 159, 159–169 [DOI] [PMC free article] [PubMed] [Google Scholar]
- 16.Zhao B, Luo T, Li T, Li Y, Zhang J, Shan Y, Wang X, Yang L, Zhou F, Zhu Z, et al. (2019) Genome-wide association analysis of 19,629 individuals identifies variants influencing regional brain volumes and refines their genetic co-architecture with cognitive and mental health traits. Nat. Genet, 51, 1637–1644 [DOI] [PMC free article] [PubMed] [Google Scholar]
- 17.Zhao B, Shan Y, Yang Y, Li T, Luo T, Zhu Z, Li Y and Zhu H (2019b) Transcriptome-wide association analysis of 211 neuroimaging traits identifies new genes for brain structures and yields insights into the gene-level pleiotropy with other complex traits. bioRxiv, 842872 [Google Scholar]
- 18.Nicholas M, Freund MK, Johnson R, Shi H, Kichaev G, Gusev A and Pasaniuc B (2019) Probabilistic fine-mapping of transcriptomewide association studies. Nat. Genet, 51, 675–682 [DOI] [PMC free article] [PubMed] [Google Scholar]
- 19.Wainberg M, Sinnott-Armstrong N, Mancuso N, Barbeira AN, Knowles DA, Golan D, Ermel R, Ruusalepp A, Quertermous T, Hao K, et al. (2019) Opportunities and challenges for transcriptome-wide association studies. Nat. Genet, 51, 592–599 [DOI] [PMC free article] [PubMed] [Google Scholar]
- 20.Pan W (2009) Asymptotic tests of association with multiple SNPs in linkage disequilibrium. Genet. Epidemiol, 33, 497–507 [DOI] [PMC free article] [PubMed] [Google Scholar]
- 21.Pan W, Kim J, Zhang Y, Shen X and Wei P (2014) A powerful and adaptive association test for rare variants. Genetics, 197, 1081–1095 [DOI] [PMC free article] [PubMed] [Google Scholar]
- 22.Kwak IY and Pan W (2016) Adaptive gene- and pathway-trait association testing with GWAS summary statistics. Bioinformatics, 32, 1178–1184 [DOI] [PMC free article] [PubMed] [Google Scholar]
- 23.Yan D, Hu B, Darst B, Mukherjee S, Kunkle B, Deming Y, Dumitrescu L, Wang Y, Naj A, Kuzma A, et al. (2019) Biobank-wide association scan identifies risk factors for late-onset Alzheimer’s disease and endophenotypes. bioRxiv, 468306 [DOI] [PMC free article] [PubMed] [Google Scholar]
- 24.Elliott LT, Sharp K, Alfaro-Almagro F, Shi S, Miller KL, Douaud G, Marchini J and Smith SM (2018) Genome-wide association studies of brain imaging phenotypes in UK Biobank. Nature, 562, 210–216 [DOI] [PMC free article] [PubMed] [Google Scholar]
- 25.1000 Genomes Project Consortium, 2010. A map of human genome variation from population-scale sequencing. Nature, 467, 1061–1073 [DOI] [PMC free article] [PubMed] [Google Scholar]
- 26.Li X, Xia J, Ma C, Chen K, Xu K, Zhang J, Chen Y, Li H, Wei D, and Zhang Z (2020) Accelerating structural degeneration in temporal regions and their effects on cognition in aging of MCI patients. Cereb., Cortex, 30, 326–338 [DOI] [PubMed] [Google Scholar]
- 27.Silbert LC, Nelson C, Howieson DB, Moore MM and Kaye JA (2008) Impact of white matter hyperintensity volume progression on rate of cognitive and motor decline. Neurology, 71, 108–113 [DOI] [PMC free article] [PubMed] [Google Scholar]
- 28.Bozzali M, Giulietti G, Basile B, Serra L, Spanò B, Perri R, Giubilei F, Marra C, Caltagirone C and Cercignani M (2012) Damage to the cingulum contributes to Alzheimer’s disease pathophysiology by deafferentation mechanism. Hum. Brain Mapp, 33, 1295–1308 [DOI] [PMC free article] [PubMed] [Google Scholar]
- 29.Brickman AM, Meier IB, Korgaonkar MS, Provenzano FA, Grieve SM, Siedlecki KL, Wasserman BT, Williams LM and Zimmerman ME (2012) Testing the white matter retrogenesis hypothesis of cognitive aging. Neurobiol. Aging, 33, 1699–1715 [DOI] [PMC free article] [PubMed] [Google Scholar]
- 30.de Jong LW, van der Hiele K, Veer IM, Houwing JJ, Westendorp RG, Bollen EL, de Bruin PW, Middelkoop HA, van Buchem MA and van der Grond J (2008) Strongly reduced volumes of putamen and thalamus in Alzheimer’s disease: an MRI study. Brain, 131, 3277–3285 [DOI] [PMC free article] [PubMed] [Google Scholar]
- 31.Li X, Wang H, Tian Y, Zhou S, Li X, Wang K and Yu Y (2016) Impaired white matter connections of the limbic system networks associated with impaired emotional memory in Alzheimer’s disease. Front. Aging Neurosci, 8, 250. [DOI] [PMC free article] [PubMed] [Google Scholar]
- 32.Mayo CD, Garcia-Barrera MA, Mazerolle EL, Ritchie LJ, Fisk JD and Gawryluk JR, and the Alzheimer’s Disease Neuroimaging Initiative. (2019) Relationship between DTI metrics and cognitive function in Alzheimer’s disease. Front. Aging Neurosci, 10, 436. [DOI] [PMC free article] [PubMed] [Google Scholar]
- 33.Hemani G, Zheng J, Elsworth B, Wade KH, Haberland V, Baird D, Laurin C, Burgess S, Bowden J, Langdon R, et al. (2018) The MR-base platform supports systematic causal inference across the human phenome. eLife, 7, e34408. [DOI] [PMC free article] [PubMed] [Google Scholar]


