Abstract
Objectives
To monitor changes in seroprevalence of SARS-CoV-2 antibodies in populations over time and between different demographic groups.
Methods
A subset of practices in the Oxford-Royal College of General Practitioners (RCGP) Research and Surveillance Centre (RSC) sentinel network provided serum samples, collected when volunteer patients had routine blood tests. We tested these samples for SARS-CoV-2 antibodies using Abbott (Chicago, USA), Roche (Basel, Switzerland) and/or Euroimmun (Luebeck, Germany) assays, and linked the results to the patients’ primary care computerised medical records.
We report seropositivity by region and age group, and additionally examined the effects of gender, ethnicity, deprivation, rurality, shielding recommendation and smoking status.
Results
We estimated seropositivity from patients aged 18-100 years old, which ranged from 4.1% (95% CI 3.1–5.3%) to 8.9% (95% CI 7.8–10.2%) across the different assays and time periods. We found higher Euroimmun seropositivity in younger age groups, people of Black and Asian ethnicity (compared to white), major conurbations, and non-smokers. We did not observe any significant effect by region, gender, deprivation, or shielding recommendation.
Conclusions
Our results suggest that prior to the vaccination programme, most of the population remained unexposed to SARS-CoV-2.
Keywords: SARS-CoV-2, COVID-19, Serology, Survey, demographics, seroprevalence, primary care
Introduction
Antibodies to severe acute respiratory syndrome coronavirus 2 (SARS-CoV-2) can usually be detected following infection, whether symptomatic or asymptomatic. The seroprevalence of SARS-CoV-2 antibodies in the population serves as a measure of past exposure and population immunity.1 Community serological surveys allow monitoring of changes over time, and comparisons between sociodemographic groups.
Box 1 provides some background to the spread of SARS-CoV-2 and restrictions imposed in England during 2020. Several national community serological surveys for SARS-CoV-2 in adults were ongoing in England throughout this period. These include a survey on sera taken from blood donations,2 the Real-time Assessment of Community Transmission (REACT-2) survey, with recruitment by postal invitation and use of self-administered lateral flow immunoassays coupled with a questionnaire,3 and the Office for National Statistics’ (ONS) Coronavirus Infection Survey, with recruitment by household, and samples and questionnaire responses collected during a doorstep visit.4 Evidence from multiple surveys help to build a fuller picture of seroprevalence by geography, age group and other sociodemographic factors.
Box 1. Overview of the COVID-19 spread in England, prior to vaccination.
The first cases of COVID-19 were confirmed in England on 31st Jan 2020. Case numbers rose, leading to a national lockdown commencing 23rd March 2020, with lockdown measures subsequently eased from 10th May. From July, concern over outbreaks in cities and towns in the midlands and north of England began to rise, and local lockdowns were put in place as necessary; then from 14th October 2020 a geographic tier system was implemented. From 2nd November to 1st December 2020 England was in back national lockdown; though schools remained open.
The B.1.1.7 (UK) variant began to spread rapidly in London and the South East leading to stricter local restrictions in these areas from 19th December. The first COVID-19 vaccine was licenced in the United Kingdom from 7th December 2020.
We present interim results of a serological survey in England, where additional blood samples for surveillance have been collected opportunistically from individuals attending their general practice for routine blood tests. Participating practices were members of the Oxford-Royal College of General Practitioners (RCGP) Research and Surveillance Centre (RSC).
Alt-text: Unlabelled box
Like the blood donor survey, the RCGP RSC serosurveillance comprised convenience samples, but the populations captured tend to be older and more likely to have chronic diseases. Samples have been linked to GP records to give clinical history and demographic information and allow more detailed exploration of seroprevalence within risk groups. For example, the RSC is able to flag extremely clinically vulnerable patients who have been advised to ‘shield’ during the pandemic;5 shielded patients were instructed to stay at home except to attend medical appointments, exercise or for other essential reasons.
We present nationwide estimates of SARS-CoV-2 seropositivity during 2020 by region and age group, to provide insight into the levels of possible population immunity prior to the commencement of vaccination. Further, we explored seropositivity by gender, ethnicity, rurality, socioeconomic status, shielding recommendation and smoking status.
Methods
Data collection
The study population comprises individuals registered at practices throughout England, where 212 practices provided blood sera samples as part of the Oxford-RCGP RSC sentinel network. Prior to the emergence of SARS-CoV-2, there had been limited serology collections in the network.7 To aid SARS-CoV-2 surveillance, the network of participating GPs was rapidly expanded,6 and from May 2020 onwards provided more than 1000 sera samples per week. Practices were recruited to provide good geographical coverage across England.
Patients attending their GP and undergoing routine blood tests are invited to provide an additional sample for surveillance purposes, thus collection of sera within a practice is opportunistic. Patients can usually be linked back to their primary care electronic health record to provide additional health and demographic information. Patients who have explicitly opted out of data sharing are excluded from the analysis.
The UK has registration-based primary care where each patient registers with a single general practice, and data are entered into computerised medical records (CMRs) either as coded data or as free text.7 The Oxford-RCGP RSC uses systematised nomenclature of medicine (SNOMED) clinical terms (CT) for key variables.8 Variables used in this study have been carefully curated and are part of the Oxford-RCGP RSC's Surveillance themed dataset,9 hosted in the Oxford RCGP Digital Hub (ORCHID), a trusted secure environment digital platform. Patient characteristics extracted for this study include:
-
•
Patient sociodemographics: Sex is coded female/male. Ethnicity is coded Asian/Black/Mixed/Other/White. Deprivation is coded using the Office for National Statistics’ (ONS’) 2019 Index of Multiple Deprivation (IMD)10 quintile, where 1 and 5 represent the most and least deprived populations respectively. Rurality is coded major conurbation/urban city & town/rural based on ONS urban/rural classifications.
-
•
Shielding recommendation: Patients at ‘high risk’ of developing complications from SARS-CoV-2 infection were identified and put on the Shielded Patients List.
-
•
Smoking status: smoking status is coded into three categories (active smoker, ex-smoker, non-smoker).
Serological assays and test validation
Samples were tested using one to three assays, with the majority tested using two of them. First, samples were tested using the Anti-SARS-CoV-2 ELISA IgG assay from Euroimmun (Luebeck, Germany) targeting the S1 domain. Second, testing to October 2020 for SARS-CoV-2 IgG was carried out using the nucleoprotein-targeting assay produced by Abbott (Chicago, USA) for use on the Architect platform. From November 2020 onwards, samples were tested using the Elecsys Anti-SARS-CoV-2 nucleoprotein assay from Roche Diagnostics (Basel, Switzerland) (plus limited back-testing of samples taken July-Aug, for comparison).
Details of test validation have been published.11 , 12 The Abbott assay was found to decline in sensitivity with time since infection, hence the switch to the use of the Roche assay, which was found to have sustained sensitivity.13 Euroimmun results of >=1.1 were assigned as positive and >=0.8 to 1.1 as equivocal, as advised by the manufacturer, and analyses focus on the percentage positive. Similarly, Roche results of >=1.0 were assigned as positive and <1.0 negative, according to manufacturer guidelines,14 and we present the percentage positive. According to Abbott manufacturer guidelines, results of >=1.4 are assigned as positive. No equivocal range was given by Abbott but based on in-house testing of convalescent and baseline sera, PHE assigned the range >=0.8 to 1.4 as equivocal. For the Abbott assay our analyses focused on percentage positive or equivocal, with an assay cut-off of 0.8; this helped to capture low or waning positives whilst retaining a high specificity of 99%.
Data management
Samples were receipted by PHE Manchester along with NHS number and basic demographic information: age, postcode district and sex. Samples were then sent to PHE labs for testing, and results were entered into a database. Pseudonymised NHS numbers were sent to RCGP RSC weekly to enable linkage to clinical record data.
Statistical analysis of seropositivity
We calculated the proportion of the population testing positive (or Abbott positive/equivocal) by age group and region using Bayesian multilevel regression and poststratification (MRP) models,15 over two-month time periods. MRP models are a two-step approach: Bayesian Markov chain Monte Carlo (MCMC) multilevel regression was used to estimate the odds of seropositivity by demographic units, and then model predictions for each demographic unit were population weighted and summed to give estimates of population seropositivity. Estimates were weighted by age group and NHS region, based on mid-2019 population estimates for health geographies provided by the ONS.16 Use of multilevel regression helps to produce more stable estimates where data are sparse; estimates for demographic units where little data is available are influenced by data across the same age range (in other regions) and in the same region (in other age ranges). Posterior medians and 95% credible intervals were generated through MCMC simulations, with four chains each of 25,000 iterations after a burn-in of 1000 iterations using the R interface to Stan.17, 18, 19
Statistical analysis of sociodemographic factors
Multivariable logistic regression was used to explore the effects of gender, ethnicity, deprivation, rurality, shielding recommendation and smoking status on seropositivity. Broad age group, NHS region and month sample taken were also included as explanatory variables. For ethnicity, IMD quintile and rurality, multiple imputation was used to account for missing data, based on 100 imputations. ‘Cold deck’ imputation was used; the probability of belonging to each category was based on external data available for geographic locations, as well as broad age group for ethnicity. IMD quintile and rurality were defined at lower super output area (LSOA) level; postcode districts were known, hence probability could be assigned according to LSOAs within or partly within postcode districts where LSOA was missing. Ethnicity and rurality imputations were based on 2011 census information. A multiple imputation approach was not sought for smoking status, as this was only available when collected by GPs within the past year and was missing for just over half of the samples; smoking status is not likely to be missing at random. Analyses were carried out using Stata version 14.20
Results
Study sample
We excluded samples that were collected in March and April, from unknown locations, or from patients aged <18 years. This left a total of 26,203 samples for the seropositivity analysis. For the multivariable logistic regression, we further excluded results without GP record linkage, repeat samples from the same patient and patients vaccinated ≥7 days before sampling, leaving 15,165 samples with a Euroimmun result available (Fig. 1 ).
Fig. 1.
Flow chart for inclusion in study.
Seropositivity
Seropositivity was estimated from 26,203 samples from patients aged 18–100 years old, who had a routine blood test with their GP during the period 1 May-31 December.
Population weighted (by NHS region and age group) modelled seropositivity estimates for adults from the Oxford RCGP RSC collection as measured by the Euroimmun assay were 4.1% (95% CrI 3.1–5.3%) in May-June increasing to 5.2% (95% CrI 4.5–6.1%) in July-August, 5.5% (95% CrI 4.8–6.4%) in September-October, and then 6.6% (95% CrI 5.7–7.6%) in November-December (Table 1 ). Estimates were initially higher using the Abbott assay at 6.2% (95% CrI 5.4–7%) in May-June and 5.9% (95% CrI 5.1–6.7%) in July-August but were lower at 5.0% (95% CrI 4.3–5.9%) in September-October. There was good agreement between the Euroimmun and Abbott outcomes where paired results were available (κ = 0.67). However, there were considerably more samples tested using the Abbott assay than the Euroimmun assay during May-June, which make results for this particular period less comparable between assays. Seropositivity as measured by the Roche nucleocapsid assay during July-August was 6.3% (95% CrI 5.4–7.4%), similar to the Abbott result (though again, fewer samples were tested). This increased to 8.9% (95% CrI 7.8–10.2%) over the November-December period, higher than the Euroimmun for the same period.
Table 1.
RCGP RSC population weighted (by age group, NHS region) modelled seropositivity estimates, as measured by the Euroimmun (S) assay, the Abbott (N) assay and the Roche (N) assay. 1 May – 31 Dec 2020.
| Euroimmun (S) |
Abbott (N) |
Roche (N) |
|||||||
|---|---|---|---|---|---|---|---|---|---|
| Period | Pos | Total | Pop Weig % | Pos/ equiv | Total | Pop Weig % | Pos | Total | Pop Weig % |
| May -June | 165 | 5455 | 4.1% (3.1-5.3%) | 476 | 9870 | 6.2% (5.4-7%) | - | - | |
| July -Aug | 248 | 5781 | 5.2% (4.5-6.1%) | 291 | 5767 | 5.9% (5.1-6.7%) | 212 | 3572 | 6.3% (5.4-7.4%) |
| Sept - Oct | 261 | 5478 | 5.5% (4.8-6.4%) | 216 | 4781 | 5% (4.3-5.9%) | - | - | |
| Nov - Dec | 274 | 4934 | 6.6% (5.7-7.6%) | - | - | 307 | 4236 | 8.9% (7.8-10.2%) | |
Differences in trends between the assays can be explained by assay sensitivities.11 , 13 The Abbott assay is highly sensitive within 2-6 weeks following infection, but this sensitivity declines rapidly with time since infection, hence seropositivity declines with time since the first epidemic wave. The Euroimmun assay is less sensitive within 2–6 weeks since infection onset, which partly explains the lower Euroimmun result for May-Jun, along with the smaller set of samples tested. The sensitivity of the Euroimmun assay, too, declines with time since infection, but less rapidly than the Abbott, hence we see Euroimmun seropositivity rise above Abbott seropositivity by September-October. The Roche assay achieves 90% sensitivity about a month post infection onset, and sensitivity is more sustained, hence the significantly higher Roche over Euroimmun seropositivity for November-December.
A later second sample was taken from some individuals, but this was only known where a result was linked to clinical record. Since there was usually at least a two-month gap between those known second samples, all assay results were retained in seropositivity analyses. We acknowledge that occasionally one individual may contribute more than one sample to an estimate.
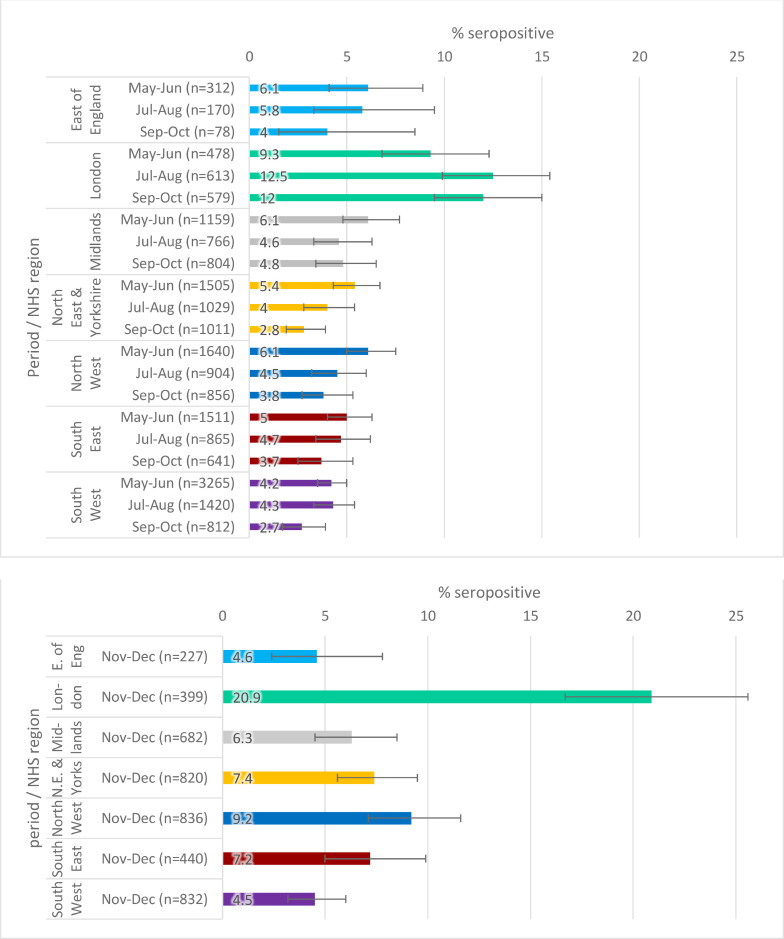
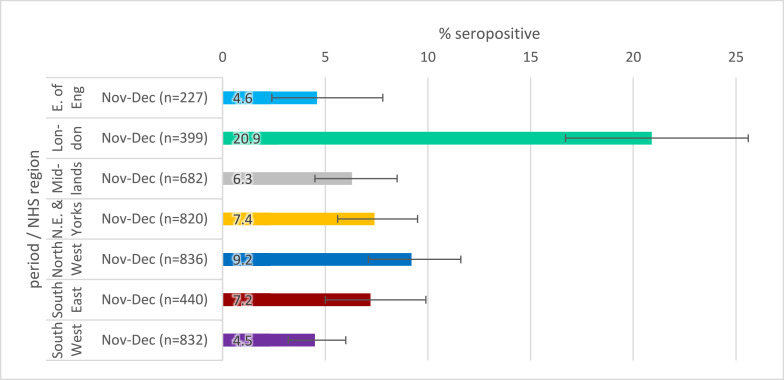
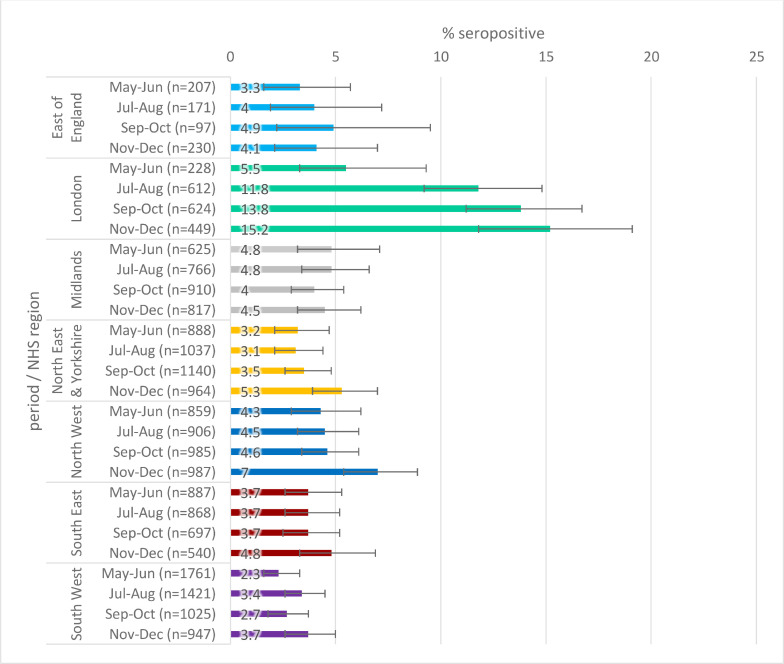
Regional estimates, using the RCGP RSC collection, over 2-month periods are shown in Figs. 2a–c . Seropositivity estimates were, in general, highest in London and lowest in the South West. There were fewer samples and greater uncertainty in estimates for the East of England, reflected in wide error bars. There is little clear evidence of change in seropositivity in any region by time period; the exception was increases in London using the Euroimmun assay, but the same is not true using the Abbott assay; London Abbott seropositivity was higher than Euroimmun at 9.3% May-June and similar to Euroimmun at 12.4% July-August.
Fig. 2b.
SARS-CoV-2 antibody seropositivity by region in the adults aged 18–100 in the RCGP collection, May-October 2020 using the Abbott assay.
Fig. 2c.
SARS-CoV-2 antibody seropositivity by region in the adults aged 18–100 in the RCGP collection, November-December 2020 using the Roche N assay.
Fig. 2a.
SARS-CoV-2 antibody seropositivity by region in the RCGP collection in adults aged 18-100 years, May-December 2020, using the Euroimmun assay.
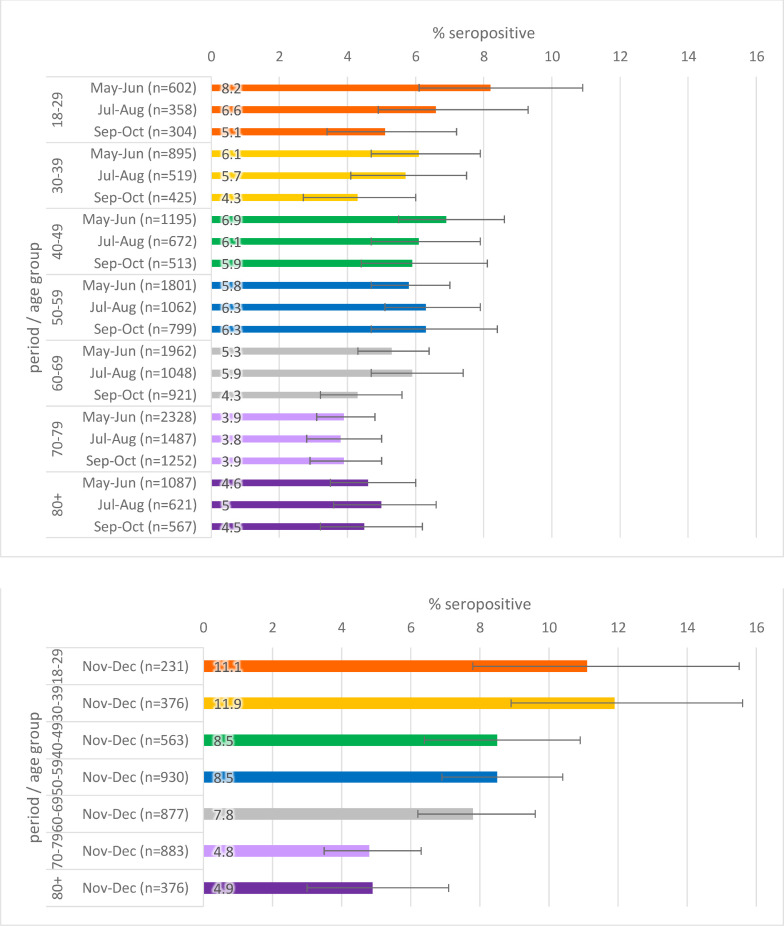
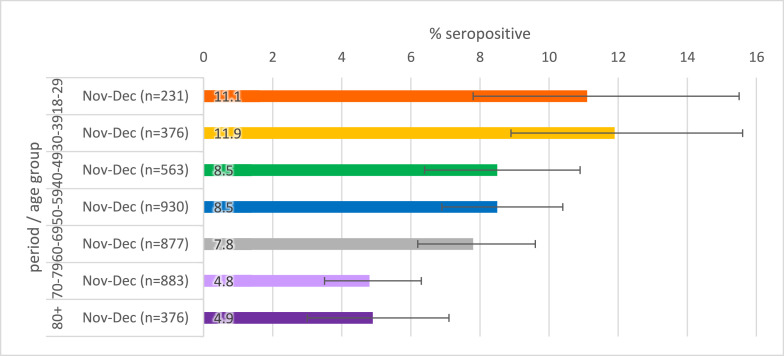
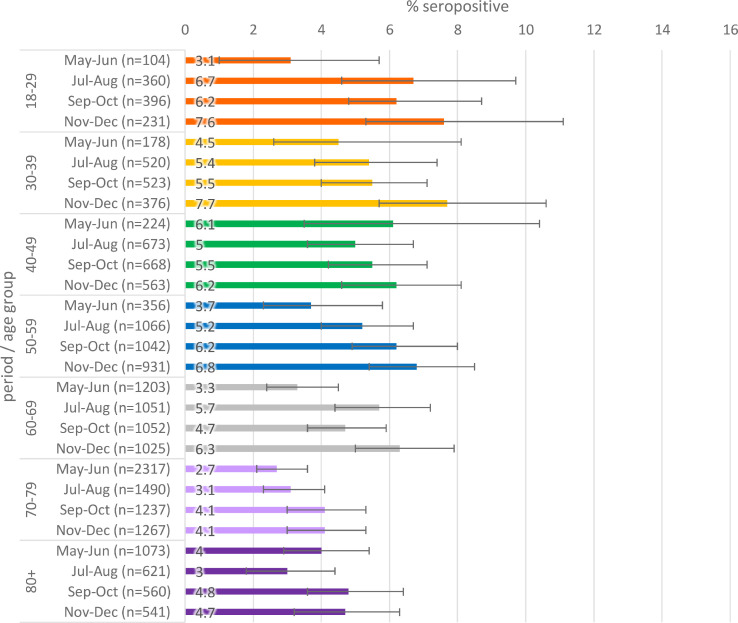
Seropositivity by age is given in Figs. 3 a–c. When stratified by age, there was slightly higher seropositivity in younger age groups compared to older age groups in general, though there is greater variation in younger age groups where there were fewer samples.
Fig. 3b.
Population weighted SARS-CoV-2 antibody seropositivity by age group in the RCGP collection, May-October 2020 using the Abbott assay.
Fig. 3c.
Population weighted SARS-CoV-2 antibody seropositivity by age group in the RCGP collection, November-December 2020 using the Roche assay
Fig. 3a.
Population weighted SARS-CoV-2 antibody seropositivity by age group in the RCGP collection, May-November 2020 using the Euroimmun assay.
Multivariable regression analysis of sociodemographic factors
Linked database information was available for 18,313 individual patients whose samples were collected at their GPs during consultations which involved routine blood tests via the RCGP RSC network during the period May-December 2020 for adults ≥18 years. The age distribution of linked and unlinked samples was similar, but there were proportionally fewer London samples linked than other regions. Repeat samples from the same individual were excluded (with the last sample retained), as were individuals with a record of vaccination more than 10 days prior. We present only the Euroimmun regression results here given the greater number of samples available (n = 15,165), but findings were similar using the Abbott assay. Results for complete cases only, i.e. not using multiple imputation methods, and for the Abbott assay are available within the supplementary material.
The main focus of this analysis was to explore the effects of ethnicity, rural/urban classification, IMD quintile, shielding recommendation, sex and smoking status on seropositivity. We report the raw percentage seropositive and multivariable regression odds ratios (OR) for Euroimmun seropositivity (Fig. 4 ).
Fig. 4.
Forest plot showing the odds of seropositivity using the Euroimmun assay; all estimates were adjusted for NHS region, age group, month of sample, gender, ethnicity, IMD quintile, urban/rural classification and shielding recommendation status. Smoking was fitted in a separate multivariable model due to the volume of missing data.
Despite higher seropositivity in London (Fig. 2a), there was little difference between London and most other regions in the multivariable regression after accounting for other factors (Fig. 4); only the OR for the South West was significantly lower than that for London. However, the rurality variable also partly explains differences between regions. Odds of seropositivity were higher for younger age groups compared with 70–79 year olds, in line with higher seropositivity in younger age groups (Fig. 3a). There was evidence of higher odds of seropositivity during December, which corresponds with the B.1.1.7-variant dominated epidemic wave in the UK that peaked around the turn of the new year 2021.
There was little difference in seropositivity between sexes, and no significant difference in the regression (p = 0.087) (Fig. 4). There was a strikingly higher seropositivity in black ethnicities, the odds of seropositivity compared to white ethnicities was 3.7 (95% CI 2.4–5.9, p < 0.001) (Fig. 4), and increased odds of seropositivity in Asian ethnicities compared to white ethnicity (OR 1.6 [95% CI 1.2–2.3, p = 0.005]), but there were few data available on mixed and other ethnicities. There was little difference between IMD (deprivation) quintile odds ratios (Fig. 4). The highest seropositivity was in major conurbations (including London, Manchester, Birmingham, Leeds-Bradford, Liverpool-Birkenhead, Newcastle-Sunderland) and the odds of seropositivity were approximately 40% lower in rural areas compared to major conurbations (p = 0.013) (Fig. 4). Seropositivity was slightly lower in those recommended to shield, though the multivariable regression odds ratio was 0.8 (95% CI 0.6–1.2) indicating no significant difference between shielding and non-shielding groups. There was much lower seropositivity and regression odds of seropositivity amongst smokers compared to non-smokers (OR: 0.3 95% CI 0.2–0.6) (Fig. 4), and 20% lower odds in ex-smokers, compared to non-smokers.
Discussion
Principal findings
Population weighted estimates of seropositivity were 4.1-6.2% May-October, periods of relatively low transmission nationally, increasing to 6.6–8.9% November-December, amid steeply rising COVID-19 rates during the UKs second wave. There was no clear evidence of change in seropositivity between May and October in any of the regions when Euroimmun and Abbott results were considered; but November-December Roche results were higher.
We observed higher odds of seropositivity in younger age groups, in people of Black and Asian ethnicity, in major conurbations and in non-smokers; however, we did not find effects of gender, deprivation, or shielding.
Comparison with the literature
Our seroprevalence estimates appear to be in line with population-based estimates reported for the UK21 and Europe.22 May-June Abbott seropositivity is in line with that from the REACT-223 and ONS infection4 studies in England, while blood donor seropositivity was higher, reflecting the lower age of blood donors at the time. All surveys subsequently showed evidence of antibody waning. The RCGP-RSC September-October estimates of 5–5.5% were a little lower than the ONS infection survey and blood donor surveys in the range of 5.9–6.9%, and higher than REACT-2 September seropositivity of 4.4%. Our November-December estimates were again a little lower than the national seropositivity estimates from blood donors and the ONS infection survey around this period. The increased seropositivity observed among younger age groups is similar to results from other English surveys.
Implications of the findings
None of the estimates of seropositivity suggest that more than 12% of the population has exposure to SARS-CoV-2 infection. However, whilst the presence of antibodies does not necessarily imply protection, we consider that the population remained vulnerable to COVID-19 until the start of the UK vaccination rollout. In the absence of immunisation or continued social distancing, there would be a high chance of further waves of COVID-19. This highlights the importance of the national vaccination programme in achieving herd immunity for SARS-CoV-2.
It appears that people of Black and Asian ethnicity are at higher risk of being infected as well as have poorer outcomes, particularly those of Black ethnicity,24 and our findings in this study support this notion. These disparities are likely multifactorial in nature, involving an interplay of biological factors, socioeconomic factors, and health behaviours. For instance, Black, Asian and minority ethnic (BAME) groups often have higher rates of cardiometabolic comorbidity, which has been shown to be an important risk factor for poor outcomes in COVID-19. These groups may also be overrepresented in occupations for which homeworking is not possible or be resident in larger households, increasing the risk of SARS-CoV-2 exposure. Further research on mechanisms underlying the higher risk in BAME groups is necessary to reduce these disparities.
Higher seropositivity in major conurbations was anticipated and is likely due to higher population density, and as a result, higher likelihood of mixing of households or limited physical distancing (e.g. in shops or on public transport). The latter may also apply to younger age groups, who will be less likely to shield, continue working in jobs outside the home and may mix more readily given evidence of lower risk of severe outcomes.
The finding that smokers and ex-smokers showed lower seropositivity is in line with other studies, and theories have been put forward as to mechanisms.25 We found a similar difference in PCR test results for smokers, but no protection from mortality.26, 27, 28 We note the limitation that the smoking variable is not likely to be missing at random; only those with smoking status collected in the past year were included in this analysis, hence healthy individuals with no GP contact in the past year were not included.
Strengths and limitations
The RCGP collection, which captures patients presenting for routine GP blood tests, is a unique source of sera for national monitoring of COVID-19 antibodies, though there are examples of sera collections from surgery patients in Australia,29 patients undergoing reproductive treatment in Spain,30 dialysis patients in the USA31 and patients visiting medical centres in French Guiana.32 An advantage of such surveys is the minimal inconvenience to patients.
Since samples are taken when other blood tests are ordered, patients are more likely to have conditions needing monitoring and requiring shielding than the general population, and are on average older. This may represent a population that are typically more careful to avoid COVID. Practices were selected from the wider set of RCGP-RSC, which may not be fully representative of the English population, however they were selected to give good geographical coverage of all of England.
As it takes two to three weeks to develop an antibody response, the most recent samples probably reflect transmission events that occurred up to early December, so our analysis will not capture the increased transmission at the very end of 2020. Our December results are not likely to be affected by vaccine-induced antibodies; 10 individuals with linked information were found to be vaccinated, all less than 2 weeks prior.
It is also important to acknowledge that serological surveys may underestimate the true seroprevalence, as assays may not be sensitive enough to detect low level antibody responses.33 , 34 Possible rapid waning of antibodies has also been documented, depending on the type of assay used, the assay target, and disease severity.12 , 35 , 36 Furthermore, the relationship between the presence of antibodies and protective immunity remains unclear. Future studies should examine the longer-term trajectory of antibody prevalence and examine association with protection.
Conclusion
This study adds to a growing body of literature examining SARS-CoV-2 exposure at the population level, and highlights health disparities between ethnic groups and rurality. Our results are largely consistent with other population-based seroprevalence surveys and suggest that a large majority of the English population remained unexposed to SARS-CoV-2 to early December 2020. We found that younger age groups, Black and Asian ethnicity and population density were all associated with greater seropositivity. Despite the high burden of COVID-19 in England, the low seroprevalence estimates indicate that the national vaccination programme is essential to achieving herd immunity in the population.
Ethics
This seroprevalence study was approved by the PHE Caldicott Guardian under Regulation 3 (Health Protection) of The Health Service (Control of Patient Information) Regulations 2002. Specific ethical approval was not required for this surveillance work. The University of Oxford additionally has a Data Sharing Agreement with PHE which individually specifies studies undertaken to support Health Protection.
Funding
Public Health England.
Data sharing
The Oxford-RCGP RSC dataset can be accessed by researchers; approval is on a project-by-project basis (https://orchid.phc.ox.ac.uk/index.php/orchid-data/). Ethical approval by an NHS Research Ethics Committee is required before any data release/other appropriate approval. Researchers wishing to directly analyse patient-level pseudonymised data will be required to complete information governance training and work on the data on the ORCHID secure server. Patient-level data cannot be taken out of the secure network.
CRediT authorship contribution statement
Heather Whitaker: Writing – original draft, Formal analysis, Conceptualization, Writing – review & editing. Ruby S.M. Tsang: Writing – original draft, Writing – review & editing. Elizabeth Button: Data curation, Investigation, Writing – review & editing. Nick Andrews: Data curation, Writing – review & editing. Rachel Byford: Data curation, Writing – review & editing. Ray Borrow: Investigation, Writing – review & editing. F.D. Richard Hobbs: Writing – review & editing. Tim Brooks: Methodology, Writing – review & editing. Gary Howsam: Writing – review & editing. Kevin Brown: Data curation, Methodology, Writing – review & editing. Jack Macartney: Data curation, Investigation, Writing – review & editing. Charlotte Gower: Data curation, Writing – review & editing. Cecilia Okusi: Data curation, Investigation, Writing – review & editing. Jacqueline Hewson: Investigation, Writing – review & editing. Julian Sherlock: Writing – review & editing. Ezra Linley: Investigation, Writing – review & editing. Manasa Tripathy: Data curation, Investigation, Writing – review & editing. Ashley D. Otter: Methodology, Writing – review & editing. John Williams: Data curation, Writing – review & editing. Simon Tonge: Investigation, Writing – review & editing. Simon de Lusignan: Writing – original draft, Project administration, Writing – review & editing. Gayatri Amirthalingam: Data curation, Project administration, Writing – review & editing.
Declaration of Competing Interest
EL, ST, RB report the Public Health England Vaccine Evaluation Unit performs contract research on behalf of GSK, Sanofi and Pfizer which is outside the submitted work.
Prof Lusignan reports and through his University he has had grants not directly relating to this work from AstraZeneca, GSK, Pfizer, Sanofi, Seqirus and Takeda for vaccine related research and membership of advisory boards for AstraZeneca, Sanofi and Seqirus.
Acknowledgements
Patients and General Practices who are members of the Oxford-RCGP RSC and agree to share data. EMIS, TPP, InPractice Systems and Wellbeing for collaboration and support in pseudonymised data extraction. Many colleagues in PHE, RCGP, and University of Oxford who have supported sentinel surveillance, including at Oxford Filipa Ferreira, Sneha Anand, Jolanta Parkinson and Dylan McGagh.
We acknowledge members of the PHE vaccine evaluation unit in handling of samples and data management. Funding was provided through Public Health England. FDRH acknowledges part support from the NIHR School for Primary Care Research (SPCR), the NIHR Applied Research Collaboration (ARC) Oxford Thames Valley, and the NIHR Oxford OUH BRC.
References
- 1.Eckerle I., Meyer B. SARS-CoV-2 seroprevalence in COVID-19 hotspots. Lancet. 2020;396(10250):514–515. doi: 10.1016/S0140-6736(20)31482-3. [DOI] [PMC free article] [PubMed] [Google Scholar]
- 2.NHS Blood and Transplant. Blood samples for COVID-19 research. www.nhsbt.nhs.uk/covid-19-research/research-and-trials/blood-samples-for-covid-19-research/ (accessed 23 April, 2021).
- 3.H. Ward, G. Cooke, C. Atchison, et al. Declining prevalence of antibody positivity to SARS-CoV-2: a community study of 365,000 adults. medRxiv 2020: 2020.10.26.20219725.
- 4.Office for National Statistics. Coronavirus (COVID-19) Infection Survey, antibody and vaccination data for the UK: 14 April 2021. 2021. www.ons.gov.uk/peoplepopulationandcommunity/healthandsocialcare/conditionsanddiseases/articles/coronaviruscovid19infectionsurveyantibodydatafortheuk/14april2021 (accessed 23 April, 2021).
- 5.Zarif A, Joy M, Sherlock J, et al. The impact of primary care supported shielding on the risk of mortality in people vulnerable to COVID-19: English sentinel network matched cohort study. J Infect. 2021;83(2):228–236. doi: 10.1016/j.jinf.2021.04.033. [DOI] [PMC free article] [PubMed] [Google Scholar]
- 6.de Lusignan S., Lopez Bernal J., Zambon M., et al. Emergence of a novel coronavirus (COVID-19): protocol for extending surveillance used by the royal college of general practitioners research and surveillance centre and public health England. JMIR Public Health Surveill. 2020;6(2):e18606. doi: 10.2196/18606. [DOI] [PMC free article] [PubMed] [Google Scholar]
- 7.de Lusignan S., van Weel C. The use of routinely collected computer data for research in primary care: opportunities and challenges. Fam Pract. 2006;23(2):253–263. doi: 10.1093/fampra/cmi106. [DOI] [PubMed] [Google Scholar]
- 8.de Lusignan S. Codes, classifications, terminologies and nomenclatures: definition, development and application in practice. Inform Prim Care. 2005;13(1):65–70. doi: 10.14236/jhi.v13i1.580. [DOI] [PubMed] [Google Scholar]
- 9.de Lusignan S., Lopez Bernal J., Byford R., et al. Influenza and respiratory virus surveillance, vaccine uptake and effectiveness at a time of cocirculating COVID-19: protocol for the English primary care sentinel system for 2020-2021. JMIR Public Health and Surveill. 2021;7(2):e24341. doi: 10.2196/24341. [DOI] [PMC free article] [PubMed] [Google Scholar]
- 10.Office for National Statistics. English indices of deprivation 2019. 2019. www.gov.uk/government/statistics/english-indices-of-deprivation-2019 (accessed 23 April, 2021).
- 11.Public Health England. COVID-19: laboratory evaluations of serological assays. 2020. www.gov.uk/government/publications/covid-19-laboratory-evaluations-of-serological-assays (accessed 23 April, 2021).
- 12.Ainsworth M., Andersson M., Auckland K., et al. Performance characteristics of five immunoassays for SARS-CoV-2: a head-to-head benchmark comparison. Lancet Infect Dis. 2020;20(12):1390–1400. doi: 10.1016/S1473-3099(20)30634-4. [DOI] [PMC free article] [PubMed] [Google Scholar]
- 13.Harris R.J., Whitaker H.J., Andrews N.J., et al. Serological surveillance of SARS-CoV-2: six-month trends and antibody response in a cohort of public health workers. J Infect. 2021;82(5):162–169. doi: 10.1016/j.jinf.2021.03.015. [DOI] [PMC free article] [PubMed] [Google Scholar]
- 14.Manisty C., Treibel T.A., Jensen M., et al. Time series analysis and mechanistic modelling of heterogeneity and sero-reversion in antibody responses to mild SARS‑CoV-2 infection. EBioMedicine. 2021;65:103259. doi: 10.1016/j.ebiom.2021.103259. [DOI] [PMC free article] [PubMed] [Google Scholar]
- 15.Park D.K., Gelman A., Bafumi J. Bayesian multilevel estimation with poststratification: state-level estimates from national polls. Polit Anal. 2017;12(4):375–385. [Google Scholar]
- 16.Office for National Statistics. Dataset: clinical commissioning group population estimates (National Statistics). 2020. www.ons.gov.uk/peoplepopulationandcommunity/populationandmigration/populationestimates/datasets/clinicalcommissioninggroupmidyearpopulationestimates (accessed 23 April, 2021).
- 17.de Valpine P., Turek D., Paciorek C.J., Anderson-Bergman C., Lang D.T., Bodik R. Programming with models: writing statistical algorithms for general model structures with NIMBLE. J Comput Graph Stat. 2017;26(2):403–413. [Google Scholar]
- 18.NIMBLE Development Team. NIMBLE MCMC, particle filtering, and programmable hierarchical modeling (version 0.9.1). 2019. https://cran.r-project.org/web/packages/nimble/
- 19.Stan Development Team. Stan modeling language users guide and reference manual (version 2.25). 2019, https://mc-stan.org/docs/2_25/stan-users-guide/.
- 20.StataCorp . StataCorp LP; College Station, TX: 2015. Stata Statistical Software: Release 14. [Google Scholar]
- 21.UK Biobank. UK Biobank SARS-CoV-2 serology study. www.ukbiobank.ac.uk/media/x0nd5sul/ukb_serologystudy_report_revised_6months_jan21.pdf (accessed 23 April, 2021).
- 22.Chen X., Chen Z., Azman A.S., et al. Serological evidence of human infection with SARS-CoV-2: a systematic review and meta-analysis. Lancet Glob Health. 2021;9(5):e598–e609. doi: 10.1016/S2214-109X(21)00026-7. [DOI] [PMC free article] [PubMed] [Google Scholar]
- 23.H. Ward, G. Cooke, M. Whitaker, et al. REACT-2 round 5: increasing prevalence of SARS-CoV-2 antibodies demonstrate impact of the second wave and of vaccine roll-out in England. medRxiv 2021: 2021.02.26.21252512. doi: 10.1101/2021.02.26.21252512. [DOI]
- 24.Bentley GR. Don't blame the BAME: ethnic and structural inequalities in susceptibilities to COVID-19. Am J Hum Biol. 2020;32(5):e23478. doi: 10.1002/ajhb.23478. [DOI] [PMC free article] [PubMed] [Google Scholar]
- 25.Grundy E.J., Suddek T., Filippidis F.T., Majeed A., Smoking C.C.S. SARS-CoV-2 and COVID-19: a review of reviews considering implications for public health policy and practice. Tob Induc Dis. 2020;18(July):58. doi: 10.18332/tid/124788. [DOI] [PMC free article] [PubMed] [Google Scholar]
- 26.de Lusignan S., Dorward J., Correa A., et al. Risk factors for SARS-CoV-2 among patients in the Oxford royal college of general practitioners research and surveillance centre primary care network: a cross-sectional study. Lancet Infect Dis. 2020;20(9):1034–1042. doi: 10.1016/S1473-3099(20)30371-6. [DOI] [PMC free article] [PubMed] [Google Scholar]
- 27.Joy M., Hobbs F.D.R., McGagh D., Akinyemi O., de Lusignan S. Excess mortality from COVID-19 in an English sentinel network population. Lancet Infect Dis. 2021;21(4):e74. doi: 10.1016/S1473-3099(20)30632-0. [DOI] [PMC free article] [PubMed] [Google Scholar]
- 28.Joy M., Hobbs F.D.R., Bernal J.L., et al. Excess mortality in the first COVID pandemic peak: cross-sectional analyses of the impact of age, sex, ethnicity, household size, and long-term conditions in people of known SARS-CoV-2 status in England. Br J Gen Pract. 2020;70(701):e890. doi: 10.3399/bjgp20X713393. [DOI] [PMC free article] [PubMed] [Google Scholar]
- 29.Hicks S.M., Pohl K., Neeman T., et al. A dual-antigen enzyme-linked immunosorbent assay allows the assessment of severe acute respiratory syndrome coronavirus 2 antibody seroprevalence in a low-transmission setting. J Infect Dis. 2021;223(1):10–14. doi: 10.1093/infdis/jiaa623. [DOI] [PMC free article] [PubMed] [Google Scholar]
- 30.Prados N., González-Ravina C., Vergara V., Herrero J., Cruz M., Requena A. Risk factor analysis for SARS-CoV-2 seropositivity within assisted reproductive. Fertil Steril. 2020;114(3):e547. [Google Scholar]
- 31.Anand S., Montez-Rath M., Han J., et al. Prevalence of SARS-CoV-2 antibodies in a large nationwide sample of patients on dialysis in the USA: a cross-sectional study. Lancet. 2020;396(10259):1335–1344. doi: 10.1016/S0140-6736(20)32009-2. [DOI] [PMC free article] [PubMed] [Google Scholar]
- 32.Flamand C., Enfissi A., Bailly S., et al. Seroprevalence of anti-SARS-CoV-2 IgG at the epidemic peak in French Guiana. PLoS Negl Trop Dis. 2021;15(11):e0009945. doi: 10.1371/journal.pntd.0009945. [DOI] [PMC free article] [PubMed] [Google Scholar]
- 33.Burgess S., Ponsford M.J., Gill D. Are we underestimating seroprevalence of SARS-CoV-2? BMJ. 2020;370:m3364. doi: 10.1136/bmj.m3364. [DOI] [PMC free article] [PubMed] [Google Scholar]
- 34.Takahashi S., Greenhouse B. Rodríguez-barraquer I. Are seroprevalence estimates for severe acute respiratory syndrome coronavirus 2 biased? J Infect Dis. 2020;222(11):1772–1775. doi: 10.1093/infdis/jiaa523. [DOI] [PMC free article] [PubMed] [Google Scholar]
- 35.Long Q.X., Tang X.J., Shi Q.L., et al. Clinical and immunological assessment of asymptomatic SARS-CoV-2 infections. Nat Med. 2020;26(8):1200–1204. doi: 10.1038/s41591-020-0965-6. [DOI] [PubMed] [Google Scholar]
- 36.Anna F., Goyard S., Lalanne A.I., et al. High seroprevalence but short-lived immune response to SARS-CoV-2 infection in Paris. Eur J Immunol. 2021;51(1):180–190. doi: 10.1002/eji.202049058. [DOI] [PMC free article] [PubMed] [Google Scholar]


