Abstract
In order to diagnose TMJ pathologies, we developed and tested a novel algorithm, MandSeg, that combines image processing and machine learning approaches for automatically segmenting the mandibular condyles and ramus. A deep neural network based on the U-Net architecture was trained for this task, using 109 cone-beam computed tomography (CBCT) scans. The ground truth label maps were manually segmented by clinicians. The U-Net takes 2D slices extracted from the 3D volumetric images. All the 3D scans were cropped depending on their size in order to keep only the mandibular region of interest The same anatomic cropping region was used for every scan in the dataset. The scans were acquired at different centers with different resolutions. Therefore, we resized all scans to 512×512 in the pre-processing step where we also performed contrast adjustment as the original scans had low contrast. After the pre-processing, around 350 slices were extracted from each scan, and used to train the U-Net model. For the cross-validation, the dataset was divided into 10 folds. The training was performed with 60 epochs, a batch size of 8 and a learning rate of 2×10⁻⁵. The average performance of the models on the test set presented 0.95 ± 0.05 AUC, 0.93 ± 0.06 sensitivity, 0.9998 ± 0.0001 specificity, 0.9996 ± 0.0003 accuracy, and 0.91 ± 0.03 F1 score. This study findings suggest that fast and efficient CBCT image segmentation of the mandibular condyles and ramus from different clinical data sets and centers can be analyzed effectively. Future studies can now extract radiomic and imaging features as potentially relevant objective diagnostic criteria for TMJ pathologies, such as osteoarthritis (OA). The proposed segmentation will allow large datasets to be analyzed more efficiently for disease classification.
I. INTRODUCTION
Osteoarthritis (OA) is a top cause of chronic disability, and with aging, the disease progresses to considerable structural and functional alterations in the joint. If the condition is detected earlier, treatment can prevent the large joint destruction; however, there is a lack of studies focusing on the early diagnosis [1–3]. There is no cure for OA, and current treatments attempt to reduce pain and improve function by slowing disease progression. The Temporomandibular joints (TMJ) are small joints that connect the lower jaw (mandible) to the skull. After chronic low back pain, TMJ disorders (TMD) are the second most commonly occurring musculoskeletal conditions, resulting in pain and disability, with an annual cost estimated at $4 billion [4].
The recommended Diagnostic Criteria for TMD protocol [5] include clinical and imaging diagnostic criteria for differentiating health and disease status, and recent studies have indicated the biological markers may also improve the diagnostic sensitivity and specificity [6]. However, feature extraction from Cone-Beam Computed Tomography (CBCT) images remains time consuming before this integrative model can be applied in larger scale studies.
There are some commercial or open-source tools such as ITK-SNAP [7] and 3D-Slicer [8] that clinicians use to interactively segment condyles in each individual image at a time and calculate some parameters of images. However, this process is time-consuming and challenging for clinicians due to low signal/noise ratio of the large field of view CBCT images commonly used in dentistry [9]. Therefore, our goal is to develop a method to automatically segment the mandibular ramus. More efficient and reproducible mandibular segmentation will help clinicians extract features from the mandibular condyles and ramus, analyze changes in the shape and anatomy of the condyles over time to properly diagnose the disease, as well as plan the anatomy for surgical interventions. This would facilitate the study of the TMJ OA and could help prevent the disease progression and predict the disease at early stages.
Manual, user interactive or semi-automatic methods use different imaging modalities such as magnetic resonance (MR) imaging, computed tomography (CT), cone-beam computed tomography (CBCT), ultrasonography, and conventional radiography [10–17] to segment the mandibular condyle and ramus with applications for TMJ and dentofacial treatment planning and assessment of outcomes. Up to date, automatic segmentation tools for condylar and thin bone cortical areas of the mandibular ramus have been limited to high resolution CBCT images [18] or small sample size acquired with the same scanning protocol [19]. The algorithm presented in this paper aimed to create a fully automated method to segment the ramus and condyle out of large field CBCT scans of the head from 4 different clinical centers and scanning acquisition protocols. The dataset is presented in Section II and the different steps of the proposed method are explained in Section III. We then show the experimental results of the proposed method and compare them with condyles manually segmented by clinician experts. Finally, conclusion remarks are presented in Section IV.
II. DATASET
We used de-identified datasets from the University of Michigan, State University of Sao Paulo, Federal University of Goias and Federal University of Ceara, that consisted of 3D large field of view scans CBCT scans of the head of 109 patients. At the different clinical centers, the images were acquired with different scanners, spatial resolutions varying from 0.2 to 0.4mm3 voxels, and image acquisition protocols.
The dataset used in this study contains both patients with radiographic diagnosis of osteoarthritis and healthy condyles. The inclusion of both OA and non-OA patients in the dataset helps develop a more generalizable segmentation model across healthy and diseased patients. The images were first interactively segmented by clinicians using ITK-SNAP (3.8.0) or 3D Sheer (4.11). These segmentations were used as ground-truth to train and evaluate the performance of the proposed method.
III. Proposed method and Experimental results
The proposed method developed to segment the mandibular condyles and ramus out of CBCT scans is based on image processing and machine learning approaches that are summarized in the flowchart shown in Figure 1.
Figure 1 -.
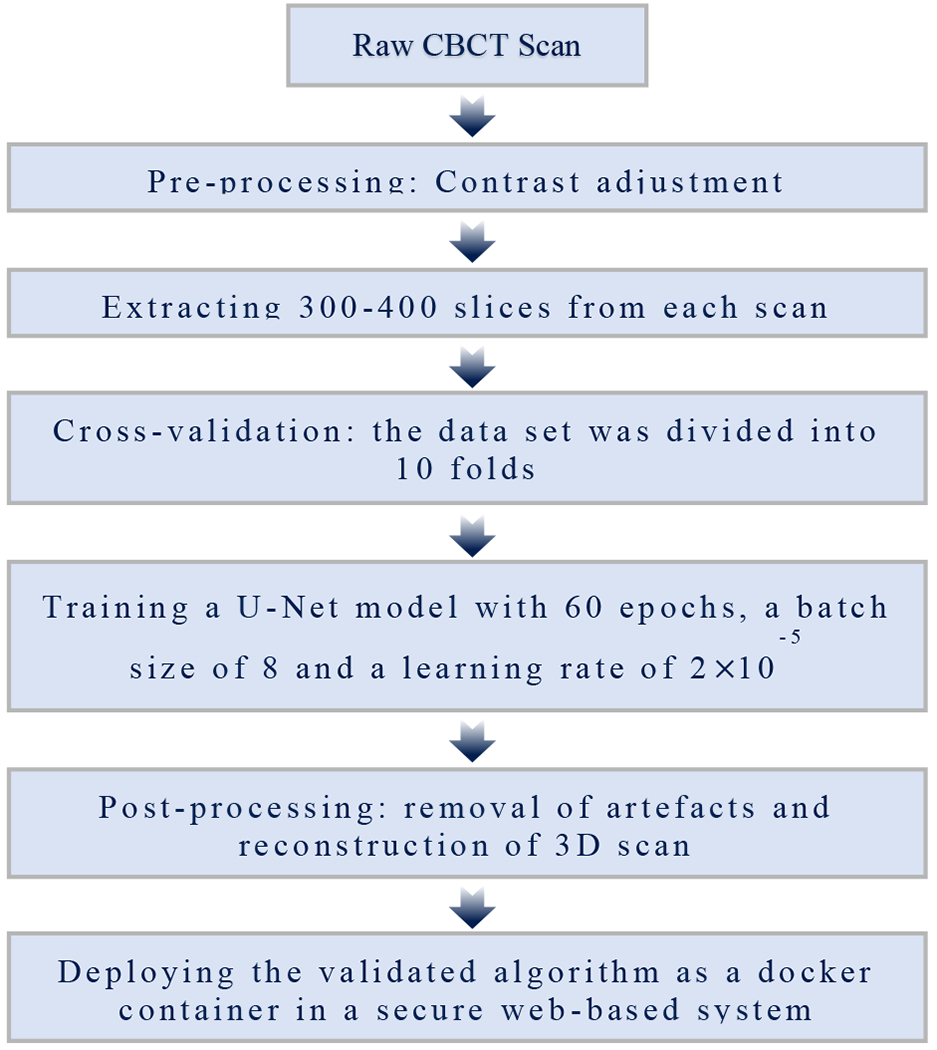
Schematic diagram of the proposed method
We first describe image pre-processing to deal with the quality of the images and region of interest. After that, we explain the machine learning techniques used to segment the mandibular condyles and ramus and to detect its contours out of the craniofacial structures. After identification of the mandibular condyles and ramus contours, we perform post-processing for artifact removal and improvement the segmentations quality.
A. Pre-processing
Figure 2 shows an example of a cross-sectional image from a raw large field of view CBCT scan with the mandibular ramus and condyles on each side of the image. The head large field CBCT scans were low contrast images, therefore we adjusted the contrast to improve the training of our deep learning model and help it to make a better prediction. We performed slice cropping according to the number of slices in each scan to keep only the region of interest where the condyles are in the large field of view scans. The algorithm selected the same anatomic cropping region for every 3D scan in the dataset, then split it into 2D cross-sections, and every cross-section was resized to 512 × 512 pixels to standardize the dataset. Each CBCT scan resulted in 300-400 cross-sectional images after the pre-processing, depending on the number of slices composing the scan, which variates with the acquisition protocol used.
Figure 2 -.
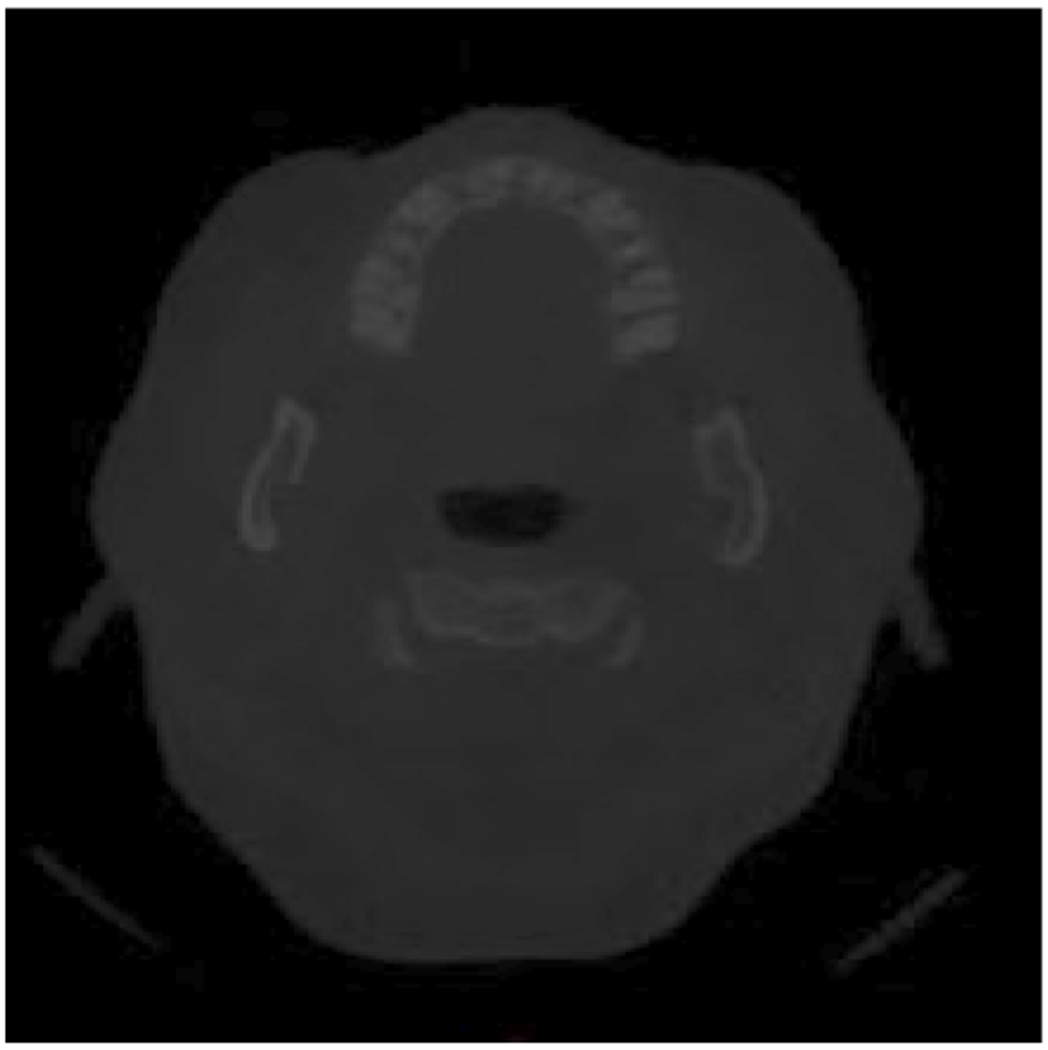
An example of one raw CBCT image
Figure 3 shows an example of a CBCT image after pre-processing. The output of the pre-processing is used in the next step where we train our deep learning model.
Figure 3 -.
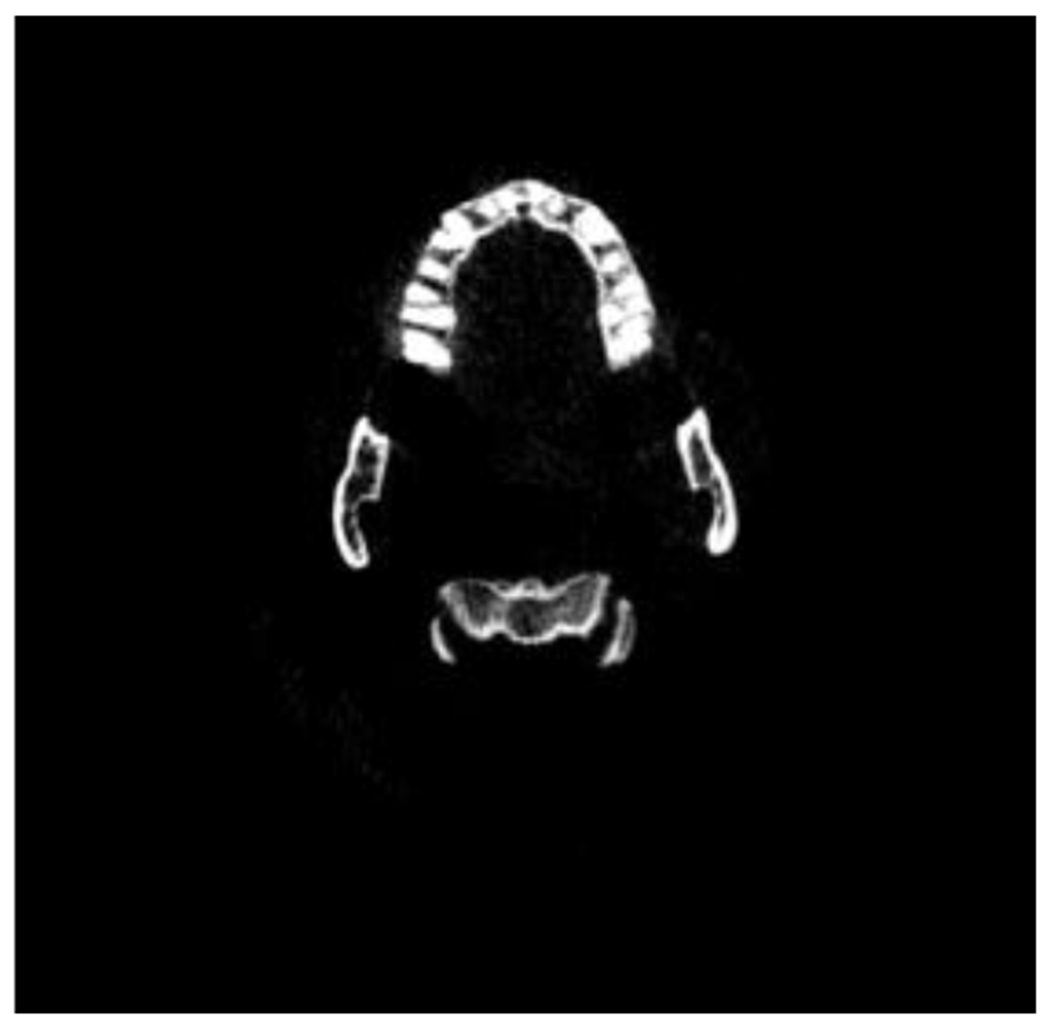
Scan after pre-processing
B. U-Net training
We used the images obtained from the pre-processing to train a U-Net model. This network was first developed for biomedical image segmentation and later utilized in other applications, such as field boundary extraction from satellite images [20].
We split the dataset into 2 parts: 90 patients CBCT scans for training (approximately 80% of the total dataset) and 19 patients CBCT scans for testing (approximately 20% of the total dataset). We performed a 10 folds cross-validation on the training set and used the testing set to evaluate the model performances. Each fold of the cross-validation contained the cross-sectional images from 9 scans. We equally distributed the scans into the different folds according to the acquisition center, to avoid the overfitting of the model.
The models were trained during 60 epochs to ensure that the model would converge, with a batch size of 8, due to computer performance limitations, and a learning rate of 2×10⁻⁵, to be able to determine with precision the most appropriate epoch. We used Tensorboard to measure and visualize the loss and accuracy of the model and selected the epoch of the model before it overfitted.
We gave the high-contrast cross-sectional images from the testing dataset to every trained model for them to predict a segmentation of the condyles for every image.
C. Post-processing
The post-processing consisted in binarizing the output images coming from the U-Net model using a threshold based on Otsu’s method, resize them to their original size, and adding them to reconstitute the original 3D scan. We then calculated the volume of each component on the 3D image, and used a volumetric threshold depending on the size of the image to remove small objects (artefacts) that are not part of the condyle.
The performance of the proposed segmentation method was evaluated by comparing the output of the method to the ground truth, scans manually segmented by clinicians.
Figure 4 shows both the manual segmentation by the clinicians and the automatic segmentations output by our algorithm.
Figure 4 -.
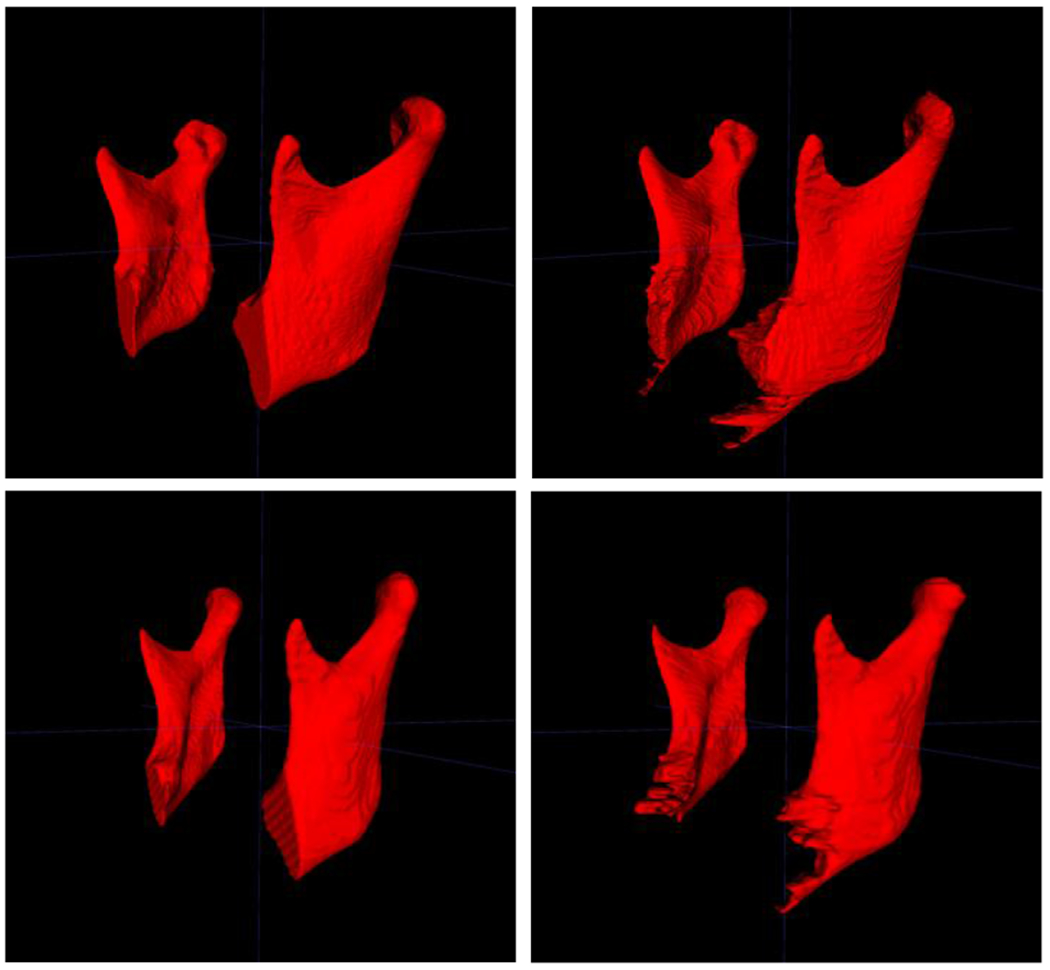
Comparison of manual segmentations (left) and automatic segmentations (right), for two different cases
We used Area Under the Receiver Operating Characteristic Curve (AUC), F1 score, accuracy, sensitivity and specificity to quantify the precision of the models. These measurements vary from zero to one, where zero means no superposition between the two volumes, and one shows a perfect superposition between both. They were performed on the binarized 3D images resulting from the post-processing.
The results we obtained for the validation dataset and the testing dataset are summarized in the following tables.
The average measurements of the AUC, F1 Score, accuracy, sensitivity and specificity of the testing dataset for the 10 folds of the cross-validation were each above 0.9 as shown in Tables 1 and 2, which demonstrates the precision of the automatic segmentations compared to the ground truth interactive segmentations. Additionally, the standard deviations were quite low, indicating that the automatic segmentations were very consistent and generalizable to unseen patients.
Table 1 -.
AUC, F1 Score, accuracy, sensitivity and specificity of the validation dataset
| Validation dataset | AUC | F1 score | Sensitivity | Specificity | Accuracy |
|---|---|---|---|---|---|
| Average | 0.955 | 0.907 | 0.923 | 0.9998 | 0.9996 |
| Standard deviation | 0.040 | 0.045 | 0.065 | 0.0002 | 0.0003 |
Table 2 -.
AUC, F1 Score, accuracy, sensitivity and specificity of the test dataset
| Test dataset | AUC | F1 score | Sensitivity | Specificity | Accuracy |
|---|---|---|---|---|---|
| Average | 0.954 | 0.915 | 0.926 | 0.9998 | 0.9996 |
| Standard deviation | 0.051 | 0.031 | 0.057 | 0.0001 | 0.0003 |
We selected the trained model presenting the highest F1 score when evaluating the model on the test dataset and used it to deploy the validated algorithm as a docker container, called MandSeg, in an open-source data management system, the Data Storage for Computation and Integration (DSCI) [21], that allows clinicians and researchers to access a secure user interface to compute automated segmentations for their patients or study datasets.
IV. CONCLUSION AND FUTURE WORK
The MandSeg algorithm produces accurate automated mandibular ramus and condyles segmentation compared to the ground truth interactive segmentation. Such an efficient automatic mandibular segmentation of CBCT scans will help clinicians early diagnose and predict TMJ disease progression by extracting imaging features of the condyle scans. We expect that the fully automated mandibular ramus and condyles segmentation algorithm presented in this study will improve accuracy in the classification of degeneration in the TMJs even when using the low-resolution large field of view CBCT images that are conventionally taken for jaw surgery planning.
The current dataset is only composed of 109 scans, coming from 4 different clinical centers and the trained models utilized segmentations of only the condyles and ramus, which are the most challenging mandibular areas to segment due to the thinness of the cortical bone in those anatomic regions. Our future objectives include the addition of scans from other clinical centers, training new deep learning models with segmentations of the full mandibles, and integration of the resulting automatic segmentations with other imaging modalities such as digital dental models for clinical applications in dentistry (Figures 5 and 6).
Figure 5 -.
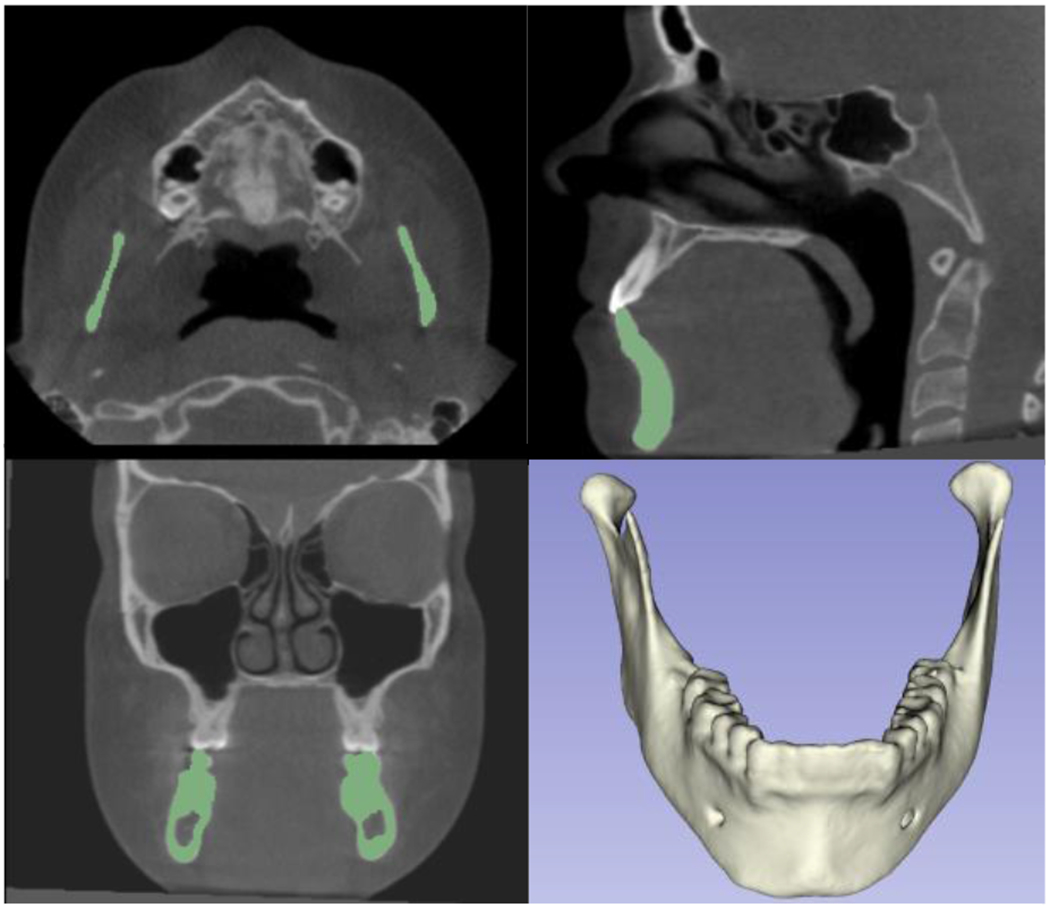
Additional training with datasets from other clinical centers for automatic segmentation of the lower jaw (full mandible)
Figure 6 -.
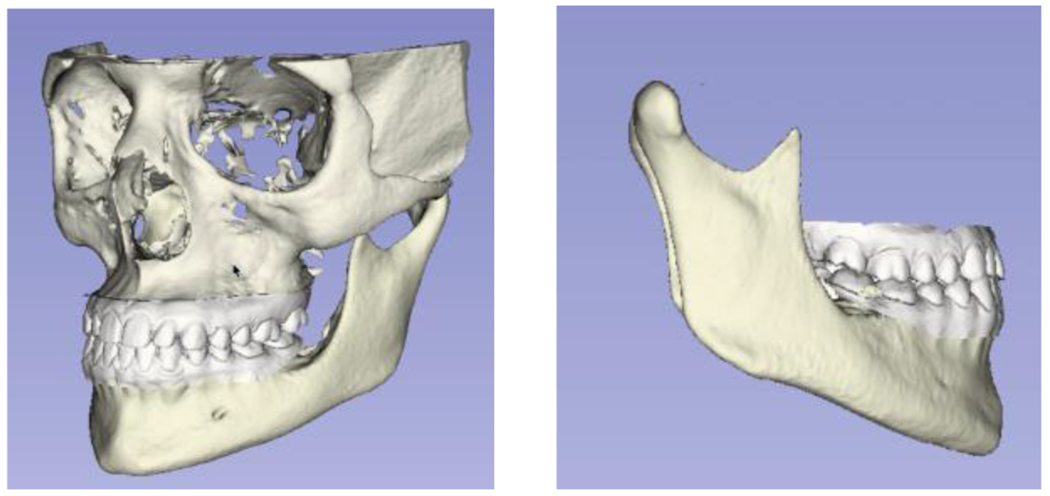
Integration of lower jaw automatic segmentation with digital dental models for decision support systems in dentistry
Acknowledgments
Grant supported by NIDCR DEO24450 and 2020 AAOF BRA award
REFERENCES
- [1].“CDC - arthritis - data and statistics.” [Online]. Available: https://www.cdc.gov/arthritis/data_statistics/index.htm
- [2].Kalladka M, Qnek S, Heir G, Eliav E, Mupparapu M, and Viswanath A, “Temporomandibular joint osteoarthritis: diagnosis and long-term conservative management: a topic review,” The Journal of Indian Prosthodontic Society, vol. 14, no. 1, pp. 6–15, 2014. [DOI] [PMC free article] [PubMed] [Google Scholar]
- [3].Bianchi J, et al. “Quantitative bone imaging biomarkers to diagnose temporomandibular joint osteoarthritis.” International Journal of Oral and Maxillofacial Surgery 50.2 (2021): 227–235. [DOI] [PMC free article] [PubMed] [Google Scholar]
- [4].National institute of dental and craniofacial research - facial pain statistics. Available: https://www.nidcr.nih.gov/research/data-statistics/facial-pain
- [5].Schiffman E et al. Diagnostic Criteria for Temporomandibular Disorders (DC/TMD)for Clinical and Research Applications: recommendations of the International RDC/TMD Consortium Network and Orofacial Pain Special Interest Group. J. oral facial pain headache. 2014. Vol.1, 6–27. [DOI] [PMC free article] [PubMed] [Google Scholar]
- [6].Bianchi J et al. Osteoarthritis of the Temporomandibular Joint can be diagnosed earlier using biomarkers and machine learning. Sci. Rep 2020, no.1, 8012. [DOI] [PMC free article] [PubMed] [Google Scholar]
- [7].Yushkevich PA, Gao Y, and Gerig G, “ITK SNAP: An interactive tool for semi-automatic segmentation of multi-modality biomedical images,” in 2016 38th Annual Int. Conference of the IEEE Engineering in Medicine and Biology Society (EMBC). IEEE, 2016, pp. 3342–3345. [DOI] [PMC free article] [PubMed] [Google Scholar]
- [8].Pieper M Halle, and Kikinis R, “3D sheer,” in 2004 2nd IEEE International Symposium on Biomedical Imaging: Nano to Macro (IEEE Cat No. 04EX821). IEEE. 2004. pp. 632–635. [Google Scholar]
- [9].Cevidanes LHS, Styner MA, Proffit Image analysis WR and superimposition of 3-dimensional cone-beam computed tomography models. American journal of orthodontics and dentofacial orthopedics. 2006. 129(5). 611–618S. [DOI] [PMC free article] [PubMed] [Google Scholar]
- [10].Talmaceanu D, Lenghel LM, Bolog N, Hedesiu M, Buduru S, Rotar H, Baciut M, and Baciut G, “Imaging modalities for temporomandibular joint disorders: an update,” Clujul Medical, vol. 91, no. 3, p. 280. 2018. [DOI] [PMC free article] [PubMed] [Google Scholar]
- [11].Verhelst P, Verstraete L, Shaheen E, Shujaat S, Darche V, Jacobs R, Swennen G, and Politis C, “Three-dimensional cone beam computed tomography analysis protocols for condylar remodelling following orthognathic surgery: a systematic review,” International Journal of Oral and Maxillofacial Surgery. 2020; 49(2):207–217. [DOI] [PubMed] [Google Scholar]
- [12].Smirg O, Liberia O, and Smekal Z, “Segmentation and creating 3D model of temporomandibular condyle,” in 2015 38th International Conference on Telecommunications and Signal Processing (TSP). IEEE, 2015. pp. 729–734. [Google Scholar]
- [13].Méndez-Manión I, Haas OL Jr, Guijarro-Martínez R, de Oliveira RB, Valls-Ontañón A, and Hernández-Alfaro F, Semi-automated three-dimensional condylar reconstruction,” Journal of Craniofacial Surgery. 30(8): 2555–2559. 2019. [DOI] [PubMed] [Google Scholar]
- [14].Xi T, Schreurs R, Heerink WJ, Berge SJ, and Maal TJ, “A novel region-growing based semi-automatic segmentation protocol for three-dimensional condylar reconstruction using cone beam computed tomography (CBCT),” PloS one. vol. 9, no. 11, p. e111126, 2014. [DOI] [PMC free article] [PubMed] [Google Scholar]
- [15].Ma R.-h. et al. Quantitative assessment of condyle positional changes before and after orthognathic surgery based on fused 3d images from cone beam computed tomography,” Clinical Oral Investigations, pp. 1–10, 2020. Aug; 24(8):2663–2672. [DOI] [PubMed] [Google Scholar]
- [16].Koç A, Sezgin ÖS and Kayipmaz S, “Comparing different planimetric methods on volumetric estimations by using cone beam computed tomography,”La Radiologia Medica. pp. 1–8, 2020. [DOI] [PubMed] [Google Scholar]
- [17].Rasband WS ImageJ. (U. S. National Institutes of Health, 1997–2011)Æhttp://imagej.nih.gov/ij/ [Google Scholar]
- [18].Brosset S et al. 3D Auto-Segmentation of Mandibular Condyles. Annu Int Conf IEEE Eng Med Biol Soc. 2020:1270–12 [DOI] [PMC free article] [PubMed] [Google Scholar]
- [19].Fan Y et al. Marker-based watershed transform method for hilly automatic mandibular segmentation from CBCT images.Dentomaxillofac Radiol. 2019. Feb;48(2):20180261. [DOI] [PMC free article] [PubMed] [Google Scholar]
- [20].Waldner F and Diakogiannis FI, 2020. Deep learning on edge: extracting field boundaries from satellite images with a convolutional neural network. Remote Sensing of Environment, 245, p. 11174 [Google Scholar]
- [21].DSCI. Available: https://dsci.dent.umich.edu


