

Abstract
Ocean acidification (OA) from seawater uptake of rising carbon dioxide emissions impairs development in marine invertebrates, particularly in calcifying species. Plasticity in gene expression is thought to mediate many of these physiological effects, but how these responses change across life history stages remains unclear. The abbreviated lecithotrophic development of the sea urchin Heliocidaris erythrogramma provides a valuable opportunity to analyse gene expression responses across a wide range of life history stages, including the benthic, post-metamorphic juvenile. We measured the transcriptional response to OA in H. erythrogramma at three stages of the life cycle (embryo, larva, and juvenile) in a controlled breeding design. The results reveal a broad range of strikingly stage-specific impacts of OA on transcription, including changes in the number and identity of affected genes; the magnitude, sign, and variance of their expression response; and the developmental trajectory of expression. The impact of OA on transcription was notably modest in relation to gene expression changes during unperturbed development and much smaller than genetic contributions from parentage. The latter result suggests that natural populations may provide an extensive genetic reservoir of resilience to OA. Taken together, these results highlight the complexity of the molecular response to OA, its substantial life history stage specificity, and the importance of contextualizing the transcriptional response to pH stress in light of normal development and standing genetic variation to better understand the capacity for marine invertebrates to adapt to OA.
Keywords: climate change, direct development, echinoid, ocean acidification, RNA-seq, transcriptomics
1 |. INTRODUCTION
Increased ocean uptake of carbon dioxide (CO2) due to rising anthropogenic emissions is causing rapid alterations to the biological, chemical, and physical composition of the marine environment (Gattuso et al., 2015; IPCC, 2014). These changes have resulted in a multidimensional set of stressors for marine life as the ocean becomes more hypercapnic (increasing pCO2), more acidic, and less saturated in calcium carbonate minerals (Albright et al., 2016; Gattuso et al., 2015; IPCC, 2014). Calcifying marine invertebrates such as corals, mollusks, and echinoderms are particularly vulnerable to the reduced availability of carbonate ions (Byrne & Hernandez, 2020; Kroeker et al., 2013; Smith et al., 2016). Several studies have shown the negative effect of decreasing carbonate mineral saturation on skeletogenesis in these animals (Byrne & Fitzer, 2019; Byrne et al., 2013; Collard et al., 2013; Stumpp et al., 2011). Hypercapnic seawater conditions and reduced pH can also disrupt metabolism, resulting in the prioritization of energy reserves toward the maintenance of essential physiological processes (e.g., acid-base homeostasis) rather than growth and calcification (Byrne et al., 2013; Carey et al., 2016; Collard et al., 2013; Liu et al., 2020; Stumpp et al., 2011; Todgham & Hofmann, 2009).
The impact of OA on the reproduction, development, and physiology of marine invertebrates differs between species (Kroeker et al., 2013; Przeslawski et al., 2015), and gene expression studies indicate that the affected physiological and molecular pathways also differ (Strader et al., 2020). The ability to measure the expression of all genes simultaneously through transcriptomic analyses provides a powerful approach to understanding organism responses and differences among taxa, as this approach affords a comprehensive and unbiased view of stress response at the molecular level. Several studies have used this approach to examine the effects of OA in diverse marine invertebrates, with a major focus on calcifiers, as they are the most vulnerable (Davies et al., 2016; De Wit et al., 2018; Evans et al., 2013; Griffiths et al., 2019; Maas et al., 2018; Pan et al., 2015; Strader et al., 2020). To date, no study has examined the transcriptomic response to OA spanning the planktonic to benthic transition in any marine invertebrate (for a recent review, see Strader et al., 2020). To address this gap in knowledge, we carried out transcriptomic analyses of the response to OA at three life history stages (embryos, larvae, and metamorphosing juveniles) under control and OA conditions in the sea urchin Heliocidaris erythrogramma.
H. erythrogramma is abundant in shallow benthic habitats around temperate Australia where, like many sea urchin species, it is ecologically important in structuring subtidal habitats as a major grazer of macroalgae (Keesing, 2020). Prior studies of the impact of OA on survivorship and morphogenesis of H. erythrogramma demonstrate that fertilization, embryos, and early larvae are robust to projected OA conditions (pH 7.6–7.8) (Byrne et al., 2010; Hardy & Byrne, 2014), while later metamorphic stages are more sensitive to these pH levels (Byrne et al., 2011). H. erythrogramma develops rapidly through a lecithotrophic (nonfeeding) larva (Williams & Anderson, 1975), providing an opportunity to examine the effects of OA on gene expression across the life cycle from embryo to early juvenile for the first time in a marine invertebrate.
Because the evolution of lecithotrophy in H. erythrogramma involved substantial changes in maternal provisioning, developmental physiology, and larval anatomy (Byrne & Sewell, 2019; Davidson et al., 2019; Henry et al., 1990; Smith et al., 2009; Williams & Anderson, 1975), the response of development in this species to OA would be expected to differ with respect to the larval stage (i.e., feeding versus nonfeeding sea urchin larvae). In particular, the larval skeleton is reduced to vestigial spicules in H. erythrogramma compared with the well-developed skeleton of echinoplutei (Emlet, 1995; Williams & Anderson, 1975) and so may be less susceptible to the effects of OA during premetamorphic stages of the life cycle. For the Echinodermata, species with nonfeeding and noncalcifying larvae have exhibited differential survival through past extinction events, including those linked to altered climate (Uthicke et al., 2009). Furthermore, genomic resources are available for H. erythrogramma, including developmental transcriptomes (Israel et al., 2016; Wygoda et al., 2014), as well as metabolic and proteomic mass spectrometry data sets (Davidson et al., 2019), making this a particularly valuable species for studying transcriptomic responses to OA.
In addition to carrying out conventional analyses to identify differences in transcript abundance, we examined two other informative features of the gene expression response to OA. First, we measured variance in gene expression, both for individual genes based on variance partitioning and for the transcriptome as a whole based on the variance-to-mean ratio (VMR). Because increased variance can reflect misregulation (Felix & Barkoulas, 2015; Lopez-Maury et al., 2008), these measures provide a way to gauge whether OA disrupts the regulation of gene expression as distinct from the reaction norm. Second, we measured changes in the shape of gene expression profiles across developmental stages, based on soft clustering (Kumar & Futschik, 2007) and changes in cluster membership (Israel et al., 2016). Such “cluster jumps” provide an objective method for identifying large changes in the temporal trajectory of gene expression independent of expression level (e.g., progressive increase versus central peak). Finally, we took advantage of the controlled breeding design to measure genetic contributions to the transcriptomic response to OA using male parent as a factor in a mixed linear model (Runcie et al., 2016). Taken together, the results of these analyses illustrate the value of examining diverse facets of the molecular response to a stressor, sampling multiple life history stages, and measuring the relative magnitude of genetic and environmental influences on gene expression.
2 |. MATERIALS AND METHODS
2.1 |. Experimental design and set-up
Heliocidaris erythrogramma adults were collected near Sydney, Australia and maintained in flow-through filtered natural seawater (FSW, 20 μm) at the Sydney Institute of Marine Sciences. A controlled breeding design consisting of three crosses was used, with each cross derived from eggs pooled from the same five females and sperm from a different male. Pooling eggs from five females provided sufficient biological material for sampling multiple time points, while fertilizing with sperm from different males provided biological replication as well as the ability to estimate male genetic contributions to variation in gene expression among samples (Runcie et al., 2016). An asymmetric breeding design was used because female genetic contributions are difficult to measure during development due to differences in egg quality that often overwhelm genetic differences, while male contributions are considered nearly equivalent to genetic contributions as sperm bring few nutrients and mRNAs to the zygote (Lynch & Walsh, 1998).
Spawning was induced by injecting 0.5 ml of 0.5 M KCl into the coelom. Eggs and sperm were microscopically checked for quality and motility and the sperm of three males was stored dry until use. Equal portions of eggs from five females were combined in a 5 L beaker of FSW and aliquots were counted to determine egg concentration. Eggs were then divided equally across three 5 L beakers of FSW at experimental pHT levels (8.0 and 7.6; see below for details). To generate three biological replicates, eggs were fertilized in each beaker with sperm from a different male at a concentration of 104 sperm/ml (determined by haemocytometer counts), resulting in three distinct crosses for each pH condition with fertilization rate > 90%. Embryos were reared at a concentration of 1/ml in a flow-through seawater system (1.0 μm FSW) with water at experimental pHT levels and temperature at 20°C. Embryos were reared at a concentration of 1/ml in a flow-through seawater system (1.0 μm FSW) with water at experimental pHT levels and temperature at 20°C (see below).
The two pHT conditions in our experiment, pHT 8.0 and pHT 7.6, represent current and projected future ocean pHT (2100) (IPCC, 2014). The shallow subtidal environments in eastern Australian coastal areas, where H. erythrogramma are typically found, fluctuate between pHT 7.87–8.30 (Wolfe et al., 2020); thus, a pHT of 7.6 is likely to be outside their natural pH range. The pHT of seawater was maintained using a mixed CO2 system, in which a thermally compensated, low-flow controller valve (Parker Hannifin, OH, USA) and a proportional-integral-derivative controller, updated every 10 s, were used to inject food-grade CO2 into ambient air that had been scrubbed of CO2. CO2 was vigorously and continuously bubbled into the header tank, using ceramic diffusers to supply pHT 7.6 water. Ambient seawater in the controls was not manipulated. A thermocouple-solenoid feedback system that automatically mixed warm and cold water in a mixing chamber was used to supply water at stable temperature (20°C) at the desired pHT. Seawater pH was measured spectrophotometrically on the total scale (pHT) with a custom-built sampling system connected to an Ocean Optics USB4000 + fibre optic spectrometer using m-Cresol dye indicator (Acros Argonics lot #A0321770) and pHT was calculated according to Liu, Patsavas and Byrne (2011).
Measurements were calibrated to certified reference material (CRM) for CO2 in seawater (Batch 139, see (Dickson et al., 2007). In parallel with pH monitoring (see below), samples (330 ml) of source water were collected daily over the five days of rearing to determine total alkalinity (TA) by potentiometric titration (Titrando, Metrohm) (see Table S1) calibrated using seawater CRMs (Batch 139 (Dickson et al., 2007); carbonate system parameters, pCO2, calcite and aragonite saturation states were calculated using CO2SYS (Pierrot et al., 2006) (Table S1). Dissociation constants for these calculations were calculated following Mehrbach et al. (1973) as refit by Dickson and Millero (1987) for K1/K2 and Dickson (1990) for KHSO4, and Uppström (1974) for total boron. Temperature and pH were monitored daily in all treatments in numerous randomly selected rearing containers at the level of the developing H. erythrogramma using a WTW multimeter (Wissenschaftilich-TechnischeWerkstatten GmbG P4) and SenTix 41 pH electrode (precision:0.01 pH units) to ensure conditions remained on target. The probes were calibrated using NIST high precision buffers pH 4.0, 7.0 and 10.0 (ProSciTech, Australia) with pH on the total scale determined through calibration with TRIS sea water buffer using the millivolt scale (Dickson et al., 2007). The pHT levels were the same across all rearing containers per treatment and so the daily pHT measure was used to determine the carbonate chemistry parameters (Table S1). FSW was supplied at the appropriate pHT by a dripper tap system to individual containers fitted with 150 μm mesh-covered windows that maintained 40–50 ml of water in the containers at all times, with a flow rate of ~ 3–4 ml/min.
Following fertilization, each of the three crosses was divided into two equal portions and reared at the different pHT levels, using 6–8 separate vessels for each cross × treatment in order to achieve low culture densities. Samples were collected at three time points: embryo (gastrula stage, 26 hr post fertilization [hpf]), early larva (48 hpf), and newly settled juvenile (108 hpf) (see Figure 1). Metamorphosis is not synchronous in H. erythrogramma cultures, so settled, post-metamorphic individuals were hand-picked to sample the juvenile stage to ensure that they were at a similar stage of development. Previous studies have shown that early embryos of H. erythrogramma are resilient to OA with increased sensitivity to the juvenile stage and differential survival of resilient progeny (Byrne et al., 2009, 2011; Hardy & Byrne, 2014). In total, 18 samples were collected for RNA-sequencing (3 developmental stages × 2 pH conditions × 3 biological replicates). It was not possible to measure mortality, as dead embryos and larvae disintegrate quickly and were washed out of the flow-through culture system used here. We monitored the developing stages closely and did not note developmental delay in response to OA.
FIGURE 1.

Experimental design (left) and analytical pipeline of RNA-seq data (right) [Colour figure can be viewed at wileyonlinelibrary.com]
2.2 |. RNA extraction and sequencing
Approximately 50 individuals were collected for each RNA sample and placed in TRIzol (Invitrogen) for RNA extraction according to the manufacturer’s instructions. Samples were diluted in 40 ml RNase-free water and stored at −80°C. RNA concentration was measured by Qubit (Thermo Fisher Scientific) and RNA quality was determined with a Fragment Analyser and PROSize 2.0 (Agilent). In total, 17 samples were sequenced. One sample (8_1M1L: pHT 8.0, Male 1, Larva) was not processed due to poor RNA quality. Library synthesis and sequencing of the RNA samples were carried out at the Sequencing and Genomic Technology shared resource at the Duke University Center for Genomic and Computational Biology. Sequencing libraries were synthesized with KAPA Stranded mRNA-Seq kits (Roche). Paired-end sequencing greatly aids in the construction of a de-novo transcriptome, but is cost-prohibitive to conduct on all samples; therefore, samples were randomly subjected to either 150 bp paired-end or 50 bp single-end sequencing (see Table S2 for sequencing scheme) on an Illumina HiSeq 4000 platform to maximize transcriptome quality while optimizing cost.
2.3 |. Read quality control
Read quality and summary statistics were generated with FastQC (Andrews, 2010) and read trimming and adapter removal performed using Trimmomatic v. 0.38 (Bolger et al., 2014) with the following parameters: LEADING:10, TRAILING:10, SLIDINGWINDOW:4:15, MINLEN:30. Putative ribosomal RNA (rRNA) reads were identified and removed from paired-end reads (because these reads ultimately were used for de novo transcriptome assembly) by aligning reads with Bowtie2 v. 2.2.4 (Langmead & Salzberg, 2012) to reference metazoan rRNA sequences retrieved from the Agalma transcriptome assembly pipeline (Dunn et al., 2013). In addition to the RNA-seq reads generated in this study, 50 bp paired-end reads from Wygoda et al. (2014) and Israel et al. (2016), which encompass egg through 10-day post-metamorphosis in H. erythrogramma, were incorporated into our de novo transcriptome assembly workflow to generate a more comprehensive developmental transcriptomic reference. Raw reads from these two studies were subjected to the same quality control measures as the sequencing reads generated in this study prior to assembly.
2.4 |. Transcriptome assembly and transcript abundance estimation
Trimmed forward and reverse paired-end reads were concatenated along with paired-end reads from two previous studies (Israel et al., 2016; Wygoda et al., 2014) into “master” forward- and reverse-oriented FASTQ files. To reduce the large computational demands of de novo transcriptome assembly from ~ 1.3 billion reads, forward and reverse reads were subjected to in silico normalization within Trinity v. 2.0.6 (Grabherr et al., 2011) (parameters: k-mer length = 25, maximum read coverage = 50). These normalized reads were used as input for de novo transcriptome assembly in Trinity v. 2.0.6 under default parameters. Following assembly, contigs from putative nonmetazoan contaminant reads were identified and removed from the transcriptome with alien _ index (Ryan, 2015). Highly similar contigs were clustered with the cd-hit-est program of CD-HIT (Li & Godzik, 2006) to remove highly redundant reference sequences within the transcriptome (parameters: c = 0.90, n = 9, l = 10). Transcriptome summary statistics were generated by Transrate (Smith-Unna et al., 2016) and are available in Table S3. Lastly, contigs were annotated with protein models from the well-studied sea urchin species Strongylocentrotus purpuratus (Sea Urchin Genome Sequencing et al., 2006) using BLAST-X (Altschul et al., 1990) at an e-value threshold of 1e-10. To minimize quantification bias between single-end and paired-end samples, only forward reads from paired-end samples that were trimmed to 50 bp were used for mRNA abundance estimation within these samples. Trimmed reads were aligned to the transcriptome and transcript abundance estimates were made with Salmon (Patro et al., 2017). Transcript abundance estimates were imported into R via the tximport library (Soneson et al., 2015) for statistical analysis.
2.5 |. Count filtering and differential expression analyses
Isoform-level contigs at the gene level were combined via tximport and counts from contigs mapping to the same S. purpuratus gene model were summed together. The resulting data set contained 19,728 genes. Genes with fewer than two counts-per-million (CPM) were removed from this list, leaving 15,322 genes for use in downstream analyses; these counts are available in Data S1. Principal component analysis (PCA) was conducted using the prcomp function within R on transposed rlog-transformed counts plus one pseudocount (rlog[count + 1]) to identify the contribution of each factor in the experiment to variation among samples. Differential expression analyses were performed using DESeq2 v1.20.0 (Love et al., 2014). Specifically, a DESeqDataSet was constructed on the 15,322 genes to test for differential transcript abundance between pH conditions (model: ~group where “group” is pH and stage combinations; i.e., CL = control at larval stage). Individual differential expression results at each stage were then extracted using the “contrast” argument of the “results” function in DESeq2. The use of groups and contrasts allowed us to ensure that the loss of one sample (at the larval stage at control pH) did not bias our stage-to-stage results. In testing the effects of the loss of one sample, we found that artificially removing another sample from the same male at a different stage did affect the number of DE genes at each stage, but that this effect was proportional and did not change our overall conclusions about the relative number of DE genes among stages.
Because we anticipated that the effect of pH would be subtle relative to other factors of the experiment based on our earlier study (Runcie et al., 2016), genes with FDR (false discovery rate)-corrected p-values ≤.10 were considered significantly differentially expressed between sample groups (Data S2). Current RNA-seq best practices do not include recommendations for fold change (FC) thresholds for differential expression so long as there is an appropriate number of biological replicates (Conesa et al., 2016; Zhang et al., 2014). However, in order to provide a direct comparison with previous OA studies, a log2(FC) threshold> = 1.5 in conjunction with our significance cutoff was separately applied and examined independently in downstream analyses. Considering differentially expressed genes both with and without FC thresholding guards against the tendency of biological interpretations to change based on the threshold selected (Dalman et al., 2012; Schurch et al., 2016). Lists of differentially expressed genes at each stage are presented in Data S2 and overlaps between stages plotted as area-proportional diagrams using eulerAPE 3.0 (Micallef & Rodgers, 2014). Differentially-expressed genes were compared with 890 genes found to be OA-responsive in previous studies (Evans et al., 2017; Evans & Watson-Wynn, 2014) to determine how many of the genes found in our study had not previously been reported to be OA-sensitive.
2.6 |. Variance partitioning and VMR analyses
Variance partitioning of transcript abundances was carried out using the R package “variancePartition” (v1.12.1) (Hoffman & Schadt, 2016), which fits a linear mixed model to each gene in the data set and estimates the fraction of total variance attributable to each factor in the experimental design. All variables (paternal effect; pH; the interaction of pH and paternal effects (pH:Male)) were modelled as random effects in accordance with the recommendations of the variancePartition manual, which suggests modelling categorical variables as random effects. Genes for which at least 10% of expression variance could be attributed to pH were considered to have significant variance changes due to pH (59 genes) (Data S3).
Variance-to-mean ratio analysis was carried out by first calculating the variance of each gene at a given sample group (stage, pH), and then dividing this value by the mean expression of that gene for that sample group. Density plots were created (using the geom_density function within the R package ggplot2) for the VMR of all genes at each stage and pH condition. Statistically significant differences between VMR density distributions were determined using the built-in R function ks.test to perform Kolmogorov-Smirnov (K-S) tests for equality. To determine whether the average VMR at each stage was significantly different between pH treatments, a two-sided paired t-test was used.
2.7 |. Soft clustering time course analyses
For comparative developmental time course analysis, raw counts of the 15,322 genes included in the differential expression analyses (see above) were normalized with the DESeq2 regularized log (rlog) transformation (Data S4). Soft clustering of temporal gene expression profiles was carried out with the R package Mfuzz v. 2.40.0 (Kumar & Futschik, 2007). Prior to clustering, mean expression values were calculated for each gene at each developmental stage and genes with the lowest 5% standard deviation “across” development were filtered out so as to remove genes whose expression changed minimally over time. This procedure yielded 14,595 genes to be included in expression cluster profiling. Initially, samples from both pH treatment groups were included to create a reference set of cluster profiles. The fuzzification coefficient (m) was determined to be 3.601 via the mestimate function of the Mfuzz package. The Dmin function, which calculates the minimum centroid distance between varying numbers of clusters, was used to estimate the optimal number of clusters as five (Figure S1).
Because the fuzzy clustering method employed here is not a deterministic process, the clustering procedure was repeated 1,000 times and the cluster iteration with the lowest objective function value was selected to maximize accuracy and representation of gene expression profiles among the five clusters. Next, pHT 8.0 and pHT 7.6 samples were separately mapped to this reference set of clusters to calculate membership values of every gene to one of five clusters. To increase confidence of cluster assignments, genes in both pHT 8.0 and pHT 7.6 samples were required to have a minimum membership score of at least 0.3 to be assigned a cluster. Genes whose cluster membership differed between control and acidic treatments (termed “cluster jumpers”; Israel et al., 2016) were identified, resulting in a set of 2,831 genes whose temporal expression profile changed between pH conditions (Data S5: cluster memberships; Data S6: plots of gene expression profiles).
2.8 |. Enrichment analyses of biological function
Gene ontology (GO) enrichment analyses were performed on gene sets of interest via the runGSAhyper function of the R package “piano” v. 1.22.0 (Varemo et al., 2013), including Benjamini-Hochberg FDR correction for multiple comparisons (Benjamini et al., 2001). Along with GO terms associated with S. purpuratus gene models (retrieved from Echinobase: www.echinobase.org/Echinobase), we included additional sea urchin specific gene sets in the enrichment analyses, including primary mesenchyme effector genes (Rafiq et al., 2014) and genes categorized as putatively involved in “biomineralization” (also retrieved from Echinobase). The latter two categories were included to capture gene expression responses associated with the skeleton, which is an autapomorphy of the phylum and thus not represented in GO and other general functional ontologies. See Data S7 for enrichment analysis results. Because GO annotations do not always correlate with biological function in sea urchins (Evans et al., 2017), categorical enrichment tests were also performed using functional categories from EchinoBase. These were run as two-sample tests for equality of proportions with continuity correction against the list of genes expressed in our entire data set.
2.9 |. Density plots of mean gene expression by parentage
At a given stage, the mean normalized count was calculated for each gene across the three genetic crosses. Then, the percent difference from this mean for each genotype was calculated as a relative change, according to the equation.
where Siren is the normalized count from one of the three genotypes and is mean the normalized count across the three genotypes. The percent differences for all genes and genotypes were then plotted in a density distribution for each stage and pH condition. To determine if the density plots of each genotype within a stage were different from one another, we used two-way K-S tests of equality (as described above) for each possible pair of male genotypes.
3 |. RESULTS
3.1 |. Scope and magnitude of transcriptional responses to OA
Reduced pH induced changes in the expression of 50, 61, and 797 genes in embryos, larvae, and juveniles, respectively (Figure 2; Data S2) using the standard dispersion-based approach to identifying differential expression in RNA-seq data (Anders et al., 2013; Conesa et al., 2016; Love et al., 2014, 2015; Mark et al., 2019; Walker et al., 2019; Zhang et al., 2014). Only eight of these genes (<1%) were differentially expressed at more than one developmental stage, and just one was differentially expressed at all three stages (Figure 3a). Interestingly, the gene that was differentially expressed at all three stages, Taf5L (SPU_020698), encodes a transcription cofactor. Of the eight genes that were differentially expressed at more than one stage, the sign of the response differed (up- and downregulated) among stages in three cases (Table S6). These results indicate that OA induces changes in transcription among largely distinct sets of genes at different stages of the life cycle.
FIGURE 2.
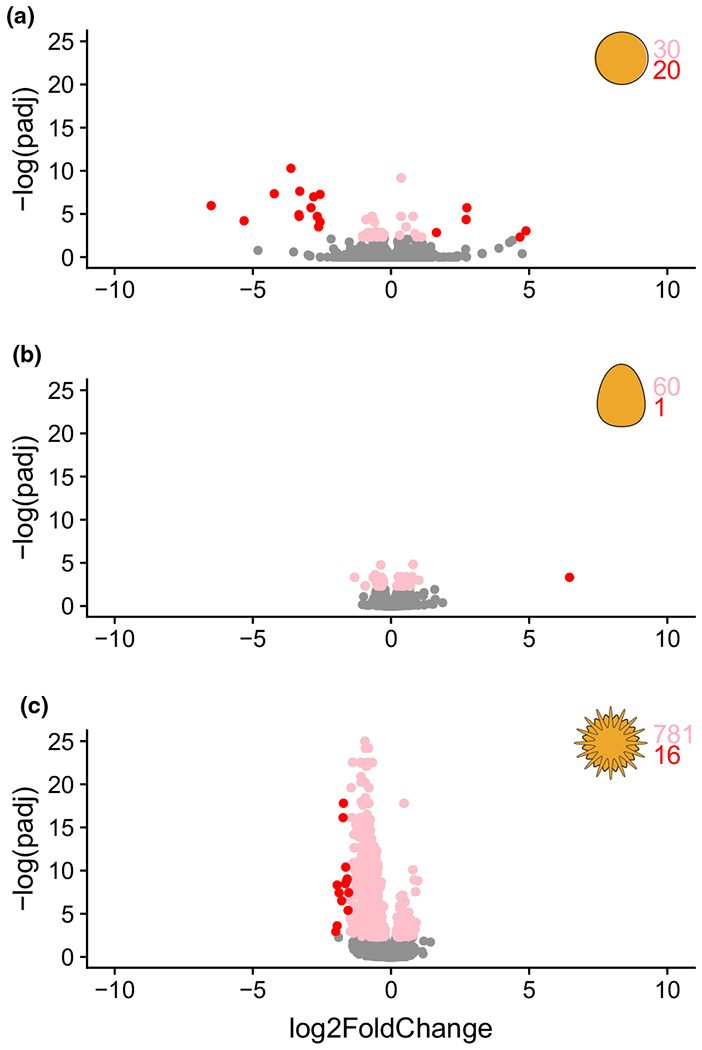
Stage-by-stage differential gene expression at (a) embryo; (b) larvae; and (c) juvenile. Pink represents differentially expressed genes supported by an adjusted p-value < 10% and log2(FC) < 1.5. Red represents differentially expressed genes supported by an adjusted p-value < 10% and log2(FC)>= 1.5. Grey represents genes that were not differentially expressed. Positive FC values are genes more highly expressed at pHT 8.0; negative FC values are genes more highly expressed at pHT 7.6 [Colour figure can be viewed at wileyonlinelibrary.com]
FIGURE 3.

(a) Overlap between stage- and criterion-specific sets of transcriptional responses to OA. Exact area-proportional Euler diagrams (scaled Venn diagrams) are shown representing the total number of genes identified and their overlaps. (a) Differentially expressed (DE) genes at three life history stages. (b) Gene expression responses to reduced pHT according to three distinct criteria: change in transcript abundance (DE), increased proportion of variance explained by pHT (variance) and altered developmental trajectory (cluster jump). See text for an explanation of inclusion criteria
Most changes in transcript abundance were modest, and rarely exceeded 1.5-fold (which we consider to be a “large” fold change in this study). Each time point showed a markedly different response to OA in terms of effect size: most of the large fold-changes in gene expression were found in embryos, while larvae had only one gene with a large fold-change, and juveniles showed a marked bias towards downregulation among genes with the largest (for this stage, but not overall) fold-changes (Figure 2, red dots). These results indicate that OA induces quantitatively distinct responses in gene expression at different stages of the life cycle. Of note, the largest transcriptional responses to reduced pH are orders of magnitude smaller than the largest changes in gene expression that take place during unperturbed development: in control cultures, the number of genes showing ≥ 100-fold change between stages was 50 (embryo to larva), 115 (larva to juvenile), and 383 (embryo to juvenile) using an adjusted p-value of ≤ .10. In contrast, no gene showed such a large expression change in response to pH treatment at any of the three stages examined.
Principal component analysis of normalized gene expression counts reinforced these findings, indicating that most of the variance among the transcriptomes of H. erythrogramma was attributable to developmental stage. Principal components 1 and 2 both discriminated samples by stage, and together accounted for more than 91% of expression variance (Figure 4a; Table S4). A linear mixed model also found that developmental stage accounts for the majority of differences in gene expression: an average of 48.9% of variation in expression per gene was explained by stage, while male parent (a proxy for genetic effects; see Lynch & Walsh, 1998) and pH treatment explained just 6.5% and 0.2% of variation, respectively (Data S3). These results indicate that the response to OA involves far fewer genes, and much smaller changes in transcript abundance, than the changes that take place during the course of normal development.
FIGURE 4.

(a) Principal component analysis (PCA) of transcript abundances across all samples. (b) Variance partitioning of gene expression attributed to each factor of the experimental design. PC: principal component [Colour figure can be viewed at wileyonlinelibrary.com]
3.2 |. Effects of OA on stage-specific transcript abundance
In embryos, 50 genes were differentially expressed in response to OA in H. erythrogramma (Figure 2a; Data S2). According to Echinobase functional categorizations, these included three genes with biomineralization function (Msp130 / SPU_002088, Msp120or4 / SPU_014496, Msp130or5 / SPU_015763), two calcium toolkit genes (Hsp701B / SPU_005808, Hsp701C / SPU_009477), five encoding chaperone proteins (DnaJB1/HSP40 / SPU_002148, SPU_005807, SPU_008985, SPU_009479, Sap30L / SPU_027083), and four genes putatively involved in the defensome (HSP70_L2 / SPU_009476, HSP70_L / SPU_009478, Cyp2L26 / SPU_013039, HSP701D / SPU_016500). Among the most differentially expressed genes at pHT 7.6 (log2 fold change > 1.5) were five genes coding for proteins in the heat shock protein family, including two encoding paralogues of HSP70 (SPU_009476, SPU_009478). These HSP70 genes were down-regulated at pHT 7.6, similar to the response of HSP70 reported for the planktotrophic larvae of S. purpuratus (Todgham & Hofmann, 2009).
In larvae, 61 genes showed differential expression in response to OA (Figure 2b; Data S2). Only three of these overlapped with differentially expressed genes in embryos: Msp130 (SPU_002088) was upregulated at both stages, while Wipf1L (SPU_013094) and Taf5L (SPU_020698) showed discordant responses. Nonetheless, several genes involved in similar biological processes were differentially expressed under OA conditions at both embryonic and larval stages (Data S2). Of particular interest are genes in the Msp130 family, which encode proteins essential for biomineralization (Anstrom et al., 1987; Karakostis et al., 2016; Killian & Wilt, 2017; Leaf et al., 1987). Msp130 (SPU_002088) expression was upregulated in embryos and larvae of H. erythrogramma in response to OA, while four paralogues, Msp130_1 (SPU_013821), Msp130r3 (SPU_013823), Msp130r4 (SPU_014496), and Msp130r5 (SPU_015763), were also upregulated in either or both embryos and larvae. Several prior studies have reported changes in Msp130 expression in response to OA in sea urchin larvae, in one case increasing (Martin et al., 2011) and in others decreasing (Di Giglio et al., 2020; Kurihara et al., 2012; Stumpp et al., 2011).
In metamorphosing juveniles, the transcriptomic response to OA was notably distinct from the two earlier stages: more than 10 times as many genes (797) were differentially expressed, and there was a strong bias towards downregulation (Figure 2c; Data S2). Genes with altered expression included several involved in transcriptional regulation, the calcium toolkit, biomineralization, and immune response (Echinobase functional categorization; Data S2), with statistically significant enrichments in the “cytoskeleton” and “calcium toolkit” functional categories relative to the transcriptome as a whole (p < 3.5e-12 and p < 3.98e-2, respectively). Many pH-responsive genes in H. erythrogramma juveniles were similar to those reported for sea urchins with planktotrophic larvae, with 38 differentially expressed genes in H. erythrogramma juveniles previously reported to be responsive to OA stress during premetamorphic development in planktotrophic species (Evans & Watson-Wynn, 2014) (Table S5). (Direct comparison to OA transcriptomic response in juveniles of a planktotrophic sea urchin is not possible as none have been published.) The previously-reported genes that were also differentially regulated here include two encoding beta-tubulin (Btub3 / SPU_000062 and Btub2_1 / SPU_001045) that showed decreased expression at low pH in H. erythrogramma (this study) and S. purpuratus (Padilla-Gamino et al., 2013), as well as three metabolic genes (Ak9L2 /SPU_020625, Ak7 / SPU_010764, Ckb/ SPU_015323) and two calcium toolkit genes (Slc8a1 / SPU_006810, CacTta1Hs / SPU_014334) (Evans & Watson-Wynn, 2014). Although many genes and biological processes previously reported to be OA-sensitive were also differentially expressed in our study (Table S5), the majority of the individual genes we report as differentially expressed have not been previously reported to be OA-sensitive.
3.3 |. Effects of OA on stage-specific variance in gene expression
Increased variance in gene expression in response to a stressor may point to compromised transcriptional regulation (Felix & Barkoulas, 2015; Lopez-Maury et al., 2008) and can be measured for the transcriptome as a whole as the variance-to-mean ratio (VMR). We found that the overall VMR among biological replicates was higher at pHT 7.6 than pHT 8.0 at embryo and larval stages, but not in juveniles (Figure 5; Figure S3; two-sided paired t-test p-value < 0.05). This increase was most pronounced in larvae (p-value < 1 × 10⁻⁶, 31.4% overall increase in VMR). An increase in VMR at lower pH was evident across several categories of gene function in larvae (Figure S4), indicating that this effect was not driven by a single biological pathway or process but instead affected genes associated with a broad range of biological functions.
FIGURE 5.

Average variance-to-mean (VMR) ratio for pHT 8.0 (blue) and 7.6 (red) at (a) embryo; (b) larva; and (c) juvenile. VMR is significantly higher at for embryo and larval stages (two-sided paired t-test; *p-value < 5e-2; **p-value < 5e–7). Mean versus variance plots at (d) embryo; (e) larva; and (f) juvenile showing that difference in VMR between pHT conditions at the larval stage is attributable to lower variance (y-axis) at pHT 8.0, not changes in mean expression (x-axis). (g–h) Examples of genes with higher expression variance among replicates at pHT 7.6 relative to pHT 8.0, highlighted in panels d–f. (g) sushi; (h) ankyrin2,3; (i) NADH – ubiquinone oxidoreductase B16.6 subunit; (j) fibropellin 1. Blue, pHT 8.0; Red, pHT 7.6 [Colour figure can be viewed at wileyonlinelibrary.com]
A stressor’s impact on variance in expression of individual genes can be captured through the linear mixed model mentioned earlier. This approach revealed that, while average contribution of pH to variance was low relative to other factors, pH explained at least 10% of expression variation for 59 genes (Data S3). Considering that the average pH contribution to variance for all genes was just 0.2% (see above, Scope and magnitude of transcriptional responses to OA), this result suggests that transcriptional regulation of these 59 genes is particularly sensitive to acidification. Of these genes, four are associated with defensome functions (Cyp4L1 / SPU_005931, Cyp4L_2 / SPU_007335, Hsp701F / SPU_013289, Osta / SPU_019774), seven with metabolism (Sds / SPU_013298, Slc25a36 / SPU_017892, Slsp_5 / SPU_018147, Sgpl1_1 / SPU_020002, SPU_023931, Scly / SPU_024173, Ctso / SPU_027818) and two with immune function (Ndufa13 / SPU_024115, Irf / SPU_010404). Of note, many of these genes (32 of 59) for which OA contributed substantially to expression variation were not identified as differentially expressed at any stage (Figure 3b).
3.4 |. Effects of OA on multistage gene expression trajectories
While measures of differential expression and expression variance at a single stage are useful for identifying stress responses, they provide just one “snapshot” of the molecular response to low pH exposure. Soft clustering (Kumar & Futschik, 2007) provides a tool for determining how temporal patterns, rather than relative levels, of gene expression change under OA relative to control conditions. Using this method, 14,595 genes expressed in both control and OA conditions were assigned to one of five clusters representing temporal expression profiles (Figure 6; Data S5). Comparison of the assigned cluster for each gene under control and OA conditions provides an unsupervised method for distinguishing temporal patterns of gene expression that are unaffected from those that are impacted by exposure to the stressor.
FIGURE 6.

Comparative soft clustering analyses of 10,404 genes between pHT 8.0 and 7.6. Time course plots on each axis describe five temporal expression patterns at pHT 8.0 (blue) and pHT 7.6 (red), respectively. Each grid entry represents the number of genes with a change (or lack thereof) in developmental expression pattern between pHT 8.0 and 7.6. For example, 2,270 genes (top left) had no change in developmental expression pattern at pHT 8.0 and pHT 7.6. In contrast, two genes (top right) that decreased in expression through development at pHT 8.0 instead increased in expression at pHT 7.6. Purple shading describes the proportion of genes with each expression trajectory change between pHT conditions [Colour figure can be viewed at wileyonlinelibrary.com]
Most genes (80.6%) remained in the same cluster, indicating that their temporal expression profiles were similar under both pH treatments (Figure 6, boxes on the diagonal). The remaining 2,831 genes were assigned to a different cluster at reduced pH, indicating a change in the shape of their gene expression trajectory during development (“cluster jump”; see Israel et al., 2016). As expected, moderate changes in expression trajectory were the most common; for 240 genes, however, the change was more substantial (Figure 6; boxes directly adjacent to the diagonal versus those further away). Relative to the transcriptome as a whole, cluster-jumping genes were significantly enriched for the zinc finger and DNA functional categories, as well as for GO terms such as RNA-dependent DNA replication, DNA repair, DNA-templated transcription, and ribosome biogenesis (Data S7). Only 38.0%, 31.1%, and 18.7% of genes identified as differentially expressed between pH conditions at the embryo, larva, and juvenile stages, respectively, were also classified as cluster-jumping genes (Figure 3b; Data S8).
3.5 |. Impact of genetic variation on transcription
The linear mixed model mentioned earlier estimated that the impact of variation in male genotype (a proxy for genetic influences) on variation in gene expression throughout the transcriptome was approximately 325 times greater than the impact of reduced pH (Figure 4b), even though our experimental design is weakly powered to detect parent-of-origin effects. The interaction of male genotype and pH was relatively modest, explaining only 0.3% of gene expression variation throughout the transcriptome as a whole. However, this interaction term explained at least 10% of the variation in expression for 131 individual genes (Data S3). Of these genes, 11 encode hydrolases, eight are metabolic genes, eight are associated with immune function, and eight encode transferases.
Plotting the density distribution for the deviation of each genetic cross from the mean expression of each gene provides a way to understand how genotype influences transcriptomic response to OA (see Methods). Applying this approach to our data suggests that the different genotypes have varying sensitivities to low pH (Figure 7). For example, the distribution of deviations from mean gene expression at embryo for each genotype was approximately the same at control pH but became clearly stratified by genotype at low pH. Specifically, expression in the offspring of male 2 was shifted above the average expression of all three genotypes at lower pH, while expression of the offspring of male 3 tended to be below the average expression of all three genotypes. Expression deviations from the mean in larvae also became more stratified at low pH compared to control pH, with some males also showing wider deviation from the mean than others (i.e., offspring of male 1 tended to show expression above the mean expression of all three genotypes, but also showed more spread in expression compared to the other two genotypes at low pH). Loss of the culture from Male 1 at control pH makes it difficult to compare expression between pH levels rigorously; however, the pattern of increased stratification by genotype at low pH was maintained even when we removed the Male 1 culture at low pH from our analyses (data not shown). Curiously, at the juvenile stage there was more stratification in expression between genotypes at the control pH than at low pH (i.e., the opposite of the result from the early embryonic stages). Thus, these results indicate that both genotype and genotype-by-environment interactions influence transcription broadly under OA conditions, but this pattern may be restricted to early embryos.
FIGURE 7.

Density distribution of the deviation for each male parental genotype from the mean expression across all genotypes, for all genes. Deviation was calculated as relative change. K-S tests were performed for each combination of genotypes at each stage; the distribution of each genotype (in both pH conditions and at all stages) was found to be statistically different from that of all other genotypes within the stage and pH condition (p < .05) [Colour figure can be viewed at wileyonlinelibrary.com]
4 |. DISCUSSION
4.1 |. OA elicits a complex transcriptional response in H. erythrogramma
Several previous studies have examined the gene expression response to OA in sea urchins with planktotrophic larval development (Evans & Watson-Wynn, 2014; Strader et al., 2020) and these differ in the life history stages and methodologies used (Table 1), making comparison of transcriptomic results among studies challenging. Nonetheless, similarities as well as striking differences are evident in our findings with H. erythrogramma. Some genes whose expression change in development of sea urchins with feeding larvae under reduced pH conditions were also affected in H. erythrogramma, including HSP70 and Msp130 (which encode a chaperone and a biomineralization protein, respectively). Biological process categories enriched in differentially expressed genes in H. erythrogramma also partially overlapped findings from prior studies, including stress response, calcium toolkit, and biomineralization (Table S5). These results point to the sensitivity to OA of key genes and cellular processes in sea urchin development. Despite these similarities, most individual genes and a few biological process categories differentially expressed in response to OA in H. erythrogramma have not been previously reported. These unique features of the response to reduced pH in H. erythrogramma may reflect the range of life history stages sampled here. This is particularly true for the metamorphosing juvenile stage, which has not previously been examined in any sea urchin and which showed by far the greatest number of OA responsive genes (Figure 3a). Additional differences may reflect the highly derived physiology and developmental mechanisms associated with the lecithotrophic life history of this species (Byrne & Sewell, 2019; Davidson et al., 2019; Henry & Raff, 1990; Wray & Raff, 1990). Differentially expressed genes related to lipid metabolism (Sgpl1_1 / SPU_020002) and mitochondrial function (Slc25a36 / SPU_017892) are especially interesting in light of the lipid-rich eggs of H. erythrogramma and are prime candidates for future functional analysis.
TABLE 1.
Previous gene expression studies on various sea urchin species in response to experimental ocean acidification
| Species | Life history | Stage | Experimental pH used | Sequencing method | Reference |
|---|---|---|---|---|---|
| Hemicentrotus pulcherrimus | Planktotroph | Gastrula, Prism, Pluteus | 7.75 7.45 |
rtPCR | Kurihara et al. (2012) |
| Lytechinus pictus | Planktotroph | Pluteus | 7.87 7.78 |
Microarray | O’Donnell et al. (2010) |
| Paracentrotus lividus | Planktotroph | Gastrula, Pluteus | 7.9 7.7 7.5 7.25 7.0 |
rtPCR | Martin et al. (2011) |
| Strongylocentrotus deoebachiensis | Planktotroph | Pluteus | 7.6 | RNAseq | Runcie et al. (2016) |
| Strongylocentrotus purpuratus | Planktotroph | Pluteus | 7.7 | Microarray | Stumpp et al. (2011) |
| Strongylocentrotus purpuratus | Planktotroph | Adult (tube feet) | 7.65–7.95 (field experiment) | RNAseq | Pespeni et al. (2013) |
| Strongylocentrotus purpuratus | Planktotroph | Gastrula, Pluteus | 400 μatm CO2 900 μatm CO2 |
RNAseq | Evans et al., 2017 |
| Strongylocentrotus purpuratus | Planktotroph | Pluteus | 7.77 7.59 |
Microarray | Evans et al. (2013) |
| Strongylocentrotus purpuratus | Planktotroph | Gastrula | 7.76 7.68 |
RNAseq | Wong et al. (2018) |
| Strongylocentrotus purpuratus | Planktotroph | Pluteus | 7.96 7.88 |
Microarray | Todgham and Hofmann (2009) |
| Strongylocentrotus purpuratus | Planktotroph | Pluteus | 1,100 μatm pCO2 |
Microarray | Padilla-Gamino et al. (2013) |
| Strongylocentrotus purpuratus | Planktotroph | Gastrula (3 stages) | 7.69 7.62 |
rtPCR | Hammond and Hofmann (2012) |
Gene expression responses to stressors can manifest in ways other than changes in transcript abundance. Increased variance in gene expression is an informative indicator of stress, and indeed may be a more direct indicator of dysregulation than differential expression (Felix & Barkoulas, 2015; Lopez-Maury et al., 2008). The VMR is a useful measure of variance that can be applied to the transcriptome as a whole. The VMR in transcript abundance increased under OA conditions in embryos and even more so in larvae of H. erythrogramma. A general increase in variability of gene expression at low pH could result from compromised mechanisms of transcriptional regulation specifically or homeostatic mechanisms more generally; alternatively, it may reflect a genotype-by-environment interaction, as has been shown in other invertebrates (Chen et al., 2015; Webster et al., 2018). Genes with elevated variance can therefore shed new light on the pH stress response by revealing additional molecular processes that may be affected but did not result in differential expression (Figures 3b and 7).
A third informative manifestation of the gene expression response to stress is a change in the shape of a developmental trajectory. We used soft clustering to assign each gene to one of five temporal expression profiles that are independent of magnitude, then identified genes whose expression “jumped” to a different cluster under conditions of low pH. Because the expression trajectory of most genes fits into just a few clusters, cluster reassignment reflects a large change in the overall shape of the expression profile across development. Genes that cluster-jumped were enriched in several biological processes, including DNA replication, transcription, and translation. Of note, many genes whose expression profile changed in response to OA were not identified as differentially expressed at any single stage (Figure 3b). This result illustrates how examining developmental trajectories can enrich understanding of the biological processes that may be impacted by a stressor.
Both variance and clustering analyses of our results demonstrate that differential expression analyses can miss informative aspects of the molecular response to OA (Figures 3b and 7). This is probably because each metric (mean, variance, and trajectory) captures somewhat distinct underlying properties of the transcriptional response to the stressor. These results also indicate that OA can affect genes involved in similar biological processes in different ways. For example, OA altered the developmental trajectory of some DNA repair genes, while other DNA repair genes showed a change in variance or transcript abundance in response to OA. Despite these effects, this functional category was not flagged by differential expression analysis as showing differences in expression level in response to OA. Although not widely applied in studies of stress response, analyses of variance, effect size, and trajectory clustering can enrich understanding of stress response at the molecular level, going beyond the insights gained from the traditional examination of differential expression in response to a stressor.
4.2 |. OA impacts expression of echinoderm-specific biomineralization genes
Biomineralization is a critical process for numerous marine organisms that use skeletons for defense, feeding, motility, and other important functions. The trend seen in many marine calcifiers in response to OA is production of less biomineral, resulting in smaller body size (Byrne & Fitzer, 2019; Kroeker et al., 2013). Skeletons probably evolved independently in several metazoan phyla, given their distinct biochemical, developmental, and genetic bases. This is almost certainly true of echinoderms (Bottjer et al., 2006; Shashikant et al., 2018a; Smith et al., 2016). Phylum-specific traits create a challenge when interpreting transcriptomic results, because gene ontologies are based on annotations produced in model organisms that lack the biological process or trait of interest.
Fortunately, echinoderm-specific biomineralization gene sets have been compiled based on a wealth of molecular, biochemical, and developmental information (Ameye et al., 2001; Karakostis et al., 2016; Killian & Wilt, 2008, 2017; Shashikant et al., 2018a). Two independently derived gene sets are available (see Methods) and both showed enrichments in gene expression responses to OA in H. erythrogramma. These encompassed embryo and larva, but not metamorphosing juvenile (Table 2). The absence of enrichment of biomineralization in metamorphosing juveniles is surprising, given that this stage appears more vulnerable to the effects of OA (pHNIST 7.7) than earlier stages based on survivorship and skeletal morphology (Byrne et al., 2011; Wolfe et al., 2013) and shows by far the largest number of differentially expressed genes (Figure 3a). The observation that both embryos and larvae show an OA-sensitive enrichment in biomineralization genes is expected, as the developmental processes that produce the larval skeleton begin in the early embryo (Shashikant et al., 2018b). Several prior studies identified individual genes involved in biomineralization that are OA-responsive in sea urchins (Di Giglio et al., 2020; Martin et al., 2011; O’Donnell et al., 2010; Stumpp et al., 2011) but we are not aware of any prior study in echinoderms that found an enriched transcriptional response to OA among biomineralization genes as a functional class using an unbiased approach.
TABLE 2.
Enrichment of gene ontology (GO) and echinoderm-specific gene sets and pathways (see Methods) in the set of differentially-expressed genes between the two pH levels used in this study
| Embryo | Larva | Juvenile | |
|---|---|---|---|
| Genes | *SPU_007451 | SPU_018406 | SPU_010805 |
|
| |||
| *SPU_009476 | SPU_002088 | SPU_021344 | |
|
| |||
| *SPU_008985 | SPU_013821 | SPU_000353 | |
|
| |||
| *SPU_002148 | SPU_013823 | SPU_025378 | |
|
| |||
| *SPU_016500 | SPU_026146 | ||
|
| |||
| SPU_014496 | SPU_013237 | ||
|
| |||
| SPU_002088 | SPU_008175 | ||
|
| |||
| SPU_015763 | |||
|
| |||
| Categorical enrichment | Nucleotide catabolic process (<0.003) | Nucleotide catabolic process (<0.006) | Microtubule-based movement (<2.5e–6) |
|
| |||
| Regulation of transcription, DNA-templated (<0.006) | Regulation of transcription, DNA-templated (<0.022) | Microtubule cytoskeleton organization (<0.002) | |
| *PMC effector genes (<0.034) | Biomineralization genes (<0.081) | Cilium movement (<0.006) | |
| Biomineralization genes (<0.034) | Regulation of transcription, DNA-templated (<0.009) | ||
| Wnt signaling pathway (<0.009) | |||
Note: PMC effector genes (Rafiq et al., 2014) are marked with an asterisk.
Interestingly, while the details of the response in gene expression differ between studies, the overall results point to biomineralization as a clear indicator of OA stress in H. erythrogramma, as is generally the case for the life stages of sea urchins and other calcifiers, as expressed in responses from molecular to morphological levels (Byrne & Fitzer, 2019; Byrne et al., 2013; Kroeker et al., 2013; Maas et al., 2018; Strader et al., 2020).
4.3 |. Molecular responses to OA change substantially across the life cycle
An important finding of this study is the substantial degree to which the molecular response to OA changes across the life cycle. These differences among developmental stages were manifest in every facet of the molecular response examined here: (a) transcript abundance changed markedly in both overall magnitude and sign among stages (Figure 2), as did the identity of the genes themselves (Figure 7); (b) the VMR changed for the transcriptome as a whole during development, as did the specific transcripts whose VMR increased at low pH; iii) the portion of expression variance attributable to pH across samples was elevated in dozens of genes; and (iv) many transcripts showed an altered developmental trajectory independent of abundance. While there was some overlap among the specific transcripts that responded to OA between stages, most were flagged as OA-responsive at only one stage (Figures 3a and 8); this was true of all three criteria examined (differential abundance, variance, trajectory). The three bulk metrics of OA response reported here (average VMR, magnitude, and sign of response) also changed appreciably between stages, indicating broad impacts on the transcriptome that differ across the life cycle (Figure 8). Taken together, these results indicate that examining any one developmental stage provides a strictly limited view of the response to OA and that results from a single stage cannot be assumed to apply to other phases of the life cycle.
FIGURE 8.

Subset of pHT sensitive genes identified by three independent types of analyses carried out in this study: stage-by-stage differential expression, variance partitioning of factor contribution to expression, and comparative time course “cluster jumping” genes [Colour figure can be viewed at wileyonlinelibrary.com]
This is not an unexpected result. Developmental and physiological processes change substantially across the life cycle, and this is clearly reflected in developmental transcriptomes of sea urchins under normal conditions (Israel et al., 2016; Tu et al., 2014; Wong et al., 2019; Wygoda et al., 2014). Importantly, these changing developmental processes may render some life history stages particularly susceptible to stressors (Hammond & Hofmann, 2012). This matters for OA because it is a chronic rather than an acute stressor; examining one developmental stage may therefore miss important vulnerabilities. Indeed, prior work demonstrates that developmental stages of H. erythrogramma differ in sensitivity to OA (Byrne et al., 2009, 2011; Hardy & Byrne, 2014). The distinct molecular responses to pH stress at different developmental stages identified in this study provide an important first step toward understanding why some stages of the life cycle are more vulnerable to OA than others.
Metamorphosis is particularly interesting as it is an exceptionally complex life stage in marine invertebrates, involving intricate coordination of developmental processes, extensive anatomical reorganization, and a major ecological transition from plankton to benthos. This life stage is particularly sensitive to stressors and is considered to be a mortality bottleneck for benthic species (Gosselin & Qian, 1997). Indeed, while early development of H. erythrogramma is resilient to OA, survivorship declines during the larva to juvenile metamorphic transition (Byrne et al., 2011; Wolfe et al., 2013), and spine development in the juveniles can be impaired at low pH (Wolfe et al., 2013). Here we observed both a larger number of differentially expressed genes and a marked bias towards downregulation at pHT 7.6 in metamorphosing juveniles (but not at earlier stages), which may indicate especially adverse effects of OA on metamorphosis. Due to the way we sampled (see Methods), individuals that developed through the larval stage to the early juvenile probably represent a subset of stress tolerant survivors with potentially biased loss of siblings according to genotype. Interestingly, however, juveniles also demonstrated deviations from average gene expression that were less stratified by pH at low pH than at control pH. It is possible that, while surviving juveniles are more susceptible to OA conditions than earlier stages, they represent a more genetically homogeneous cohort due to the cumulative effect of OA stress over developmental time, as well as the mortality bottleneck across the larva-to-juvenile metamorphic transition.
4.4 |. Stress-induced decanalization can confound measurements of transcriptional responses
The standard approach used to identify differential expression in RNA-seq data sets takes into account variance among biological samples (Anders et al., 2013; Conesa et al., 2016; Love et al., 2015; Zhang et al., 2014). While entirely appropriate in many situations, it is important to recognize that in a study of stress response, this approach can directly confound an informative biological response variable (i.e., loss of regulation) with the assessment of statistical significance. Stressors can cause dysregulation or loss of canalization, which can be reflected in increased variance in transcript abundance (Felix & Barkoulas, 2015; Lopez-Maury et al., 2008). To the extent that a stressor increases variance in gene expression, the standard approach to identifying differential expression introduces an ascertainment bias because it penalizes increased variance when determining whether a gene is differentially expressed. This artefact is probably absent from most transcriptomic analyses because the VMR does not change appreciably among samples (e.g., comparing successive developmental stages under normal conditions), but it is a clear concern when measuring a stress response that may be decanalizing.
Many genes with an elevated VMR at pHT 7.6 in our results were not identified as differentially expressed by DESeq2 (despite showing a large change in mean), because variance increased substantially. Genes with a substantially elevated VMR at low pH included Unc44_175 (SPU_025667), which encodes an ankyrin (proteins that connect integral membrane proteins to the cytoskeleton); Ndufa13 (SPU_024115), which encodes an oxidoreductase (specifically, part of a protein complex that regulates cell death); and Sushi (SPU_002010) and Egfi3 (SPU_011308), both of which encode fibropellins (proteins that regulate cell proliferation) (Figure 5). These genes are all involved in regulatory processes, and two of the proteins bind calcium ions, making them interesting candidates for functional analysis. These examples illustrate how applying variance-based metrics can identify candidate genes that would be missed by standard tests for differential expression when studying stress response.
4.5 |. Molecular responses to OA are modest relative to developmental changes
A noteworthy feature of the transcriptomic response of H. erythrogramma development to OA is its modest scale and scope. While thousands of genes rapidly change expression during normal development in sea urchins (Israel et al., 2016; Tu et al., 2014; Wong et al., 2019; Wygoda et al., 2014), fewer than 100 changed in response to OA in embryos and larvae, and fewer than 1,000 were altered in metamorphosing juveniles. Furthermore, the magnitude of expression changes under conditions of reduced pH was modest, with only a small fraction exceeding 1.5-fold (Figure 2). In comparison, expression changes > 100-fold are common during development (Israel et al., 2016; Tu et al., 2014; Wong et al., 2019; Wygoda et al., 2014).
The expression of Msp130 (SPU_002088) provides an instructive example. This gene encodes glycoprotein that plays a key role in transport of Ca2+ ions from the cell surface to the growing biomineral matrix (Anstrom et al., 1987; Karakostis et al., 2016; Killian & Wilt, 2017; Leaf et al., 1987; Mann et al., 2008). Msp130 expression increased 1.82-fold and 1.54-fold at pHT 7.6 in H. erythrogramma embryos and larvae, respectively. Prior studies have reported changes in Msp130 expression of a comparable magnitude under OA conditions (Di Giglio et al., 2020; Kurihara et al., 2012; Martin et al., 2011; Stumpp et al., 2011). However, these stress responses are small compared to changes in Msp130 expression levels during normal development (Israel et al., 2016; Tu et al., 2014; Wong et al., 2019; Wygoda et al., 2014). In H. erythrogramma, Msp130 expression increased ~ 30-fold between embryo and larva and ~ 1,000-fold between embryo and juvenile under control conditions (Figure S2; note log2 scale). These large changes in Msp130 transcription during normal development suggest that caution is warranted when considering the biological implications of the much smaller expression responses to OA.
4.6 |. Molecular responses to OA are eclipsed by the impact of natural genetic variation
Two independent analytical approaches, principal components analysis and linear mixed models, both indicated that natural genetic variation had a much larger overall impact on gene expression than pH stress. In the linear mixed model, developmental stage explained on average 48.9% of expression variation per gene, male parent 6.5%, and pH just 0.2% (Data S3). Since male genotype can be considered a proxy for genetic effects (Lynch & Walsh, 1998), our results suggest that natural populations of H. erythrogramma contain extensive genetic variation that alters gene expression to a greater degree than does exposure to OA. This finding is consistent with studies of development of sea urchins with planktotrophic larvae (Pespeni et al., 2013; Runcie et al., 2016) and similar findings for a coral (Jury et al., 2019) and a bivalve (Bitter et al., 2019). Collectively, these studies suggest that it is not uncommon for standing genetic variation to contribute more to interindividual phenotypic variation in gene expression across the transcriptome than does OA.
Genetic variation that influences gene expression during development could, in principle, provide genotypes that facilitate adaptation to OA in natural populations (Glazier et al., 2020; Goncalves et al., 2016; Pespeni et al., 2013; Runcie et al., 2016). A previous study found that development and settlement success of H. erythrogramma under OA conditions were both strongly influenced by male parent (Foo et al., 2016). Further, the ability of individual male H. erythrogramma sperm to fertilize eggs differs between OA and control conditions (Smith et al., 2019), suggesting genotype-by-phenotype interactions based in segregating variation. If health and survivorship under OA conditions are mediated in part by changes in gene expression, resilience to OA may differ among individuals in a population based in part on genetic variation. However, it should be noted that the interaction term (pH:-Sire) in the linear mixed model also explained only a very small amount of variation in gene expression (0.3%). Furthermore, our experiment was not designed to detect such effects, as evidenced by the lack of replication within each cross. Further experiments will therefore be necessary to determine whether there exists sufficient genetic variation to provide the raw materials for natural selection to overcome the impacts of OA.
Supplementary Material
ACKNOWLEDGEMENTS
We thank the Sydney Institute of Marine Science (SIMS) for facilities, as well as the SIMS staff for their assistance. We also thank the staff of Duke’s Sequencing and Genomic Technologies Shared Resource for help with RNA-seq. Members of the Byrne and Wray laboratory groups provided valuable input and advice throughout. This study was supported by a Graduate Research Fellowship from the NSF to HD, IOS1457305 and IOS1929934 from the NSF to GW, DP150102771 from the ARC to MB, and 2016/RD/0159 from the New South Wales Environmental Trust to MB. This is SIMS contribution number 262.
Funding information
NSF Graduate Research Fellowship, Grant/Award Number: 1644868; Division of Integrative Organismal Systems, Grant/Award Number: IOS1929934; Australian Research Council, Grant/Award Number: DP150102771; New South Wales Environmental Trust, Grant/Award Number: 2016/RD/0159
Footnotes
SUPPORTING INFORMATION
Additional supporting information may be found online in the Supporting Information section.
DATA AVAILABILITY STATEMENT
Sequencing reads and the transcriptome generated in this study are publicly available on Dryad Digital Repository (https://doi.org/10.5061/dryad.3xsj3txdm) (Devens et al., 2020). Transcript abundances and gene sets are available in the Supporting Information Data online.
REFERENCES
- Albright R, Caldeira L, Hosfelt J, Kwiatkowski L, Maclaren JK, Mason BM, Nebuchina Y, Ninokawa A, Pongratz J, Ricke KL, Rivlin T, Schneider K, Sesboüé M, Shamberger K, Silverman J, Wolfe K, Zhu K, & Caldeira K (2016). Reversal of ocean acidification enhances net coral reef calcification. Nature, 531(7594), 362–365. 10.1038/nature17155 [DOI] [PubMed] [Google Scholar]
- Altschul SF, Gish W, Miller W, Myers EW, & Lipman DJ (1990). Basic local alignment search tool. Journal of Molecular Biology, 215(3), 403–410. 10.1016/S0022-2836(05)80360-2 [DOI] [PubMed] [Google Scholar]
- Ameye L, De Becker G, Killian C, Wilt F, Kemps R, Kuypers S, & Dubois P (2001). Proteins and saccharides of the sea urchin organic matrix of mineralization: Characterization and localization in the spine skeleton. Journal of Structural Biology, 134(1), 56–66. 10.1006/jsbi.2001.4361 [DOI] [PubMed] [Google Scholar]
- Anders S, McCarthy DJ, Chen YS, Okoniewski M, Smyth GK, Huber W, & Robinson MD (2013). Count-based differential expression analysis of RNA sequencing data using R and Bioconductor. Nature Protocols, 8(9), 1765–1786. 10.1038/nprot.2013.099 [DOI] [PubMed] [Google Scholar]
- Andrews S (2010). FastQC: A quality control tool for high throughput sequence data. [Google Scholar]
- Anstrom JA, Chin JE, Leaf DS, Parks AL, & Raff RA (1987). Localization and expression of msp130, a primary mesenchyme lineage-specific cell surface protein in the sea urchin embryo. Development, 101(2), 255–265. [DOI] [PubMed] [Google Scholar]
- Benjamini Y, Drai D, Elmer G, Kafkafi N, & Golani I (2001). Controlling the false discovery rate in behavior genetics research. Behavioural Brain Research, 125(1–2), 279–284. 10.1016/S0166-4328(01)00297-2 [DOI] [PubMed] [Google Scholar]
- Bitter MC, Kapsenberg L, Gattuso JP, & Pfister CA (2019). Standing genetic variation fuels rapid adaptation to ocean acidification. Nature Communications, 10(1), 5821. 10.1038/s41467-019-13767-1 [DOI] [PMC free article] [PubMed] [Google Scholar]
- Bolger AM, Lohse M, & Usadel B (2014). Trimmomatic: A flexible trimmer for Illumina sequence data. Bioinformatics, 30(15), 2114–2120. 10.1093/bioinformatics/btu170 [DOI] [PMC free article] [PubMed] [Google Scholar]
- Bottjer DJ, Davidson EH, Peterson KJ, & Cameron RA (2006). Paleogenomics of echinoderms. Science, 314(5801), 956–960. 10.1126/science.1132310 [DOI] [PubMed] [Google Scholar]
- Byrne M, & Fitzer S (2019). The impact of environmental acidification on the microstructure and mechanical integrity of marine invertebrate skeletons. Conservation. Physiology, 7(1), coz062. 10.1093/conphys/coz062 [DOI] [PMC free article] [PubMed] [Google Scholar]
- Byrne M, & Hernandez JC (2020). Sea urchins in a high CO2 world: impacts of climate warming and ocean acidification across life history stages. In Laurence JM (Ed.), Sea urchines: Biology and ecology (4th edn., pp. 281–297). Elsevier B.V. [Google Scholar]
- Byrne M, Ho M, Selvakumaraswamy P, Nguyen HD, Dworjanyn SA, & Davis AR (2009). Temperature, but not pH, compromises sea urchin fertilization and early development under near-future climate change scenarios. Proceedings of the Royal Society B: Biological Sciences, 276(1663), 1883–1888. 10.1098/rspb.2008.1935 [DOI] [PMC free article] [PubMed] [Google Scholar]
- Byrne M, Ho M, Wong E, Soars NA, Selvakumaraswamy P, Shepard-Brennand H, Dworjanyn SA, & Davis AR (2011). Unshelled abalone and corrupted urchins: Development of marine calcifiers in a changing ocean. Proceedings of the Royal Society B: Biological Sciences, 278(1716), 2376–2383. 10.1098/rspb.2010.2404 [DOI] [PMC free article] [PubMed] [Google Scholar]
- Byrne M, Lamare M, Winter D, Dworjanyn SA, & Uthicke S (2013). The stunting effect of a high CO2 ocean on calcification and development in sea urchin larvae, a synthesis from the tropics to the poles. Philosophical Transactions of the Royal Society London B: Biological Sciences, 368(1627), 20120439. 10.1098/rstb.2012.0439 [DOI] [PMC free article] [PubMed] [Google Scholar]
- Byrne M, & Sewell MA (2019). Evolution of maternal lipid provisioning strategies in echinoids with non-feeding larvae: Selection for high-quality juveniles. Marine Ecology Progress Series, 616, 95–106. 10.3354/meps12938 [DOI] [Google Scholar]
- Byrne M, Soars NA, Ho MA, Wong E, McElroy D, Selvakumaraswamy P, Dworjanyn SA, & Davis AR (2010). Fertilization in a suite of coastal marine invertebrates from SE Australia is robust to near-future ocean warming and acidification. Marine Biology, 157(9), 2061–2069. 10.1007/s00227-010-1474-9 [DOI] [Google Scholar]
- Carey N, Harianto J, & Byrne M (2016). Sea urchins in a high-CO2 world: Partitioned effects of body size, ocean warming and acidification on metabolic rate. Journal of Experimental Biology, 219(8), 1178–1186. 10.1242/jeb.136101 [DOI] [PubMed] [Google Scholar]
- Chen J, Nolte V, & Schlotterer C (2015). Temperature stress mediates decanalization and dominance of gene expression in Drosophila melanogaster. PLOS Genetics, 11(2), e1004883. 10.1371/journal.pgen.1004883 [DOI] [PMC free article] [PubMed] [Google Scholar]
- Collard M, Catarino AI, Bonnet S, Flammang P, & Dubois P (2013). Effects of CO2-induced ocean acidification on physiological and mechanical properties of the starfish Asterias rubens. Journal of Experimental Marine Biology and Ecology, 446, 355–362. 10.1016/j.jembe.2013.06.003 [DOI] [Google Scholar]
- Conesa A, Madrigal P, Tarazona S, Gomez-Cabrero D, Cervera A, McPherson A, Szcześniak MW, Gaffney DJ, Elo LL, Zhang X, & Mortazavi A (2016). A survey of best practices for RNA-seq data analysis. Genome Biology, 17, 13. 10.1186/s13059-016-0881-8 [DOI] [PMC free article] [PubMed] [Google Scholar]
- Dalman MR, Deeter A, Nimishakavi G, & Duan ZH (2012). Fold change and p-value cutoffs significantly alter microarray interpretations. BMC Bioinformatics, 13(Suppl 2), S11. 10.1186/1471-2105-13-S2-S11 [DOI] [PMC free article] [PubMed] [Google Scholar]
- Davidson PL, Thompson JW, Foster MW, Moseley MA, Byrne M, & Wray GA (2019). A comparative analysis of egg provisioning using mass spectrometry during rapid life history evolution in sea urchins. Evolution & Development, 21(4), 188–204. 10.1111/ede.12289 [DOI] [PMC free article] [PubMed] [Google Scholar]
- Davies SW, Marchetti A, Ries JB, & Castillo KD (2016). Thermal and pCO(2) Stress Elicit Divergent Transcriptomic Responses in a Resilient Coral. Frontiers in Marine Science, 3, 10.3389/fmars.2016.00112 [DOI] [Google Scholar]
- De Wit P, Durland E, Ventura A, & Langdon CJ (2018). Gene expression correlated with delay in shell formation in larval Pacific oysters (Crassostrea gigas) exposed to experimental ocean acidification provides insights into shell formation mechanisms. BMC Genomics, 19(1), 160. 10.1186/s12864-018-4519-y [DOI] [PMC free article] [PubMed] [Google Scholar]
- Devens H, Davidson P, Deaker D, Smith KE, Wray G, & Byrne M (2020). Data accompanying “Ocean acidification induces distinct transcriptomic responses across life history stages of the sea urchin Heliocidaris erythrogramma”. Dryad Digital Repository, 10.5061/dryad.3xsj3txdm [DOI] [PMC free article] [PubMed] [Google Scholar]
- Di Giglio S, Spatafora D, Milazzo M, M’Zoudi S, Zito F, Dubois P, & Costa C (2020). Are control of extracellular acid-base balance and regulation of skeleton genes linked to resistance to ocean acidification in adult sea urchins? Science of the Total Environment, 137443, 10.1016/j.scitotenv.2020.137443 [DOI] [PubMed] [Google Scholar]
- Dickson AG (1990). Standard potential of the reaction: AgCl(s) + 12H2(g) = Ag(s) + HCl(aq), and and the standard acidity constant of the ion HSO4− in synthetic sea water from 273.15 to 318.15 K. The Journal of Chemical Thermodynamics, 22(2), 113–127. 10.1016/0021-9614(90)90074-Z [DOI] [Google Scholar]
- Dickson AG, & Millero FJ (1987). A comparison of the equilibrium constants for the dissociation of carbonic acid in seawater media. Deep Sea Research Part A. Oceanographic Research Papers, 34(10), 1733–1743. 10.1016/0198-0149(87)90021-5 [DOI] [Google Scholar]
- Dickson AG, Sabine CL, & Christian JR (2007). Guide to best practices for ocean CO2 measurements. PICES Special Publication, 3, 191. [Google Scholar]
- Dunn CW, Howison M, & Zapata F (2013). Agalma: An automated phylogenomics workflow. BMC Bioinformatics, 14, 330. 10.1186/1471-2105-14-330 [DOI] [PMC free article] [PubMed] [Google Scholar]
- Emlet RB (1995). Larval spicules, cilia, and symmetry as remnants of indirect development in the direct developing sea urchin Heliocidaris erythrogramma. Developmental Biology, 167(2), 405–415. 10.1006/dbio.1995.1037 [DOI] [PubMed] [Google Scholar]
- Evans TG, Chan F, Menge BA, & Hofmann GE (2013). Transcriptomic responses to ocean acidification in larval sea urchins from a naturally variable pH environment. Molecular Ecology, 22(6), 1609–1625. 10.1111/mec.12188 [DOI] [PubMed] [Google Scholar]
- Evans TG, Pespeni MH, Hofmann GE, Palumbi SR, & Sanford E (2017). Transcriptomic responses to seawater acidification among sea urchin populations inhabiting a natural pH mosaic. Molecular Ecology, 26(8), 2257–2275. 10.1111/mec.14038 [DOI] [PubMed] [Google Scholar]
- Evans TG, & Watson-Wynn P (2014). Effects of seawater acidification on gene expression: Resolving broader-scale trends in sea urchins. The Biological Bulletin, 226(3), 237–254. 10.1086/BBLv226n3p237 [DOI] [PubMed] [Google Scholar]
- Felix MA, & Barkoulas M (2015). Pervasive robustness in biological systems. Nature Reviews Genetics, 16(8), 483–496. 10.1038/nrg3949 [DOI] [PubMed] [Google Scholar]
- Foo SA, Dworjanyn SA, Poore AGB, Harianto J, & Byrne M (2016). Adaptive capacity of the sea urchin Heliocidaris erythrogramma to ocean change stressors: Responses from gamete performance to the juvenile. Marine Ecology Progress Series, 556, 161–172. 10.3354/meps11841 [DOI] [Google Scholar]
- Gattuso JP, Magnan A, Bille R, Cheung WWL, Howes EL, Joos F, & Turley C (2015). Contrasting futures for ocean and society from different anthropogenic CO2 emissions scenarios. Science, 349(6243), aac4722. 10.1126/science.aac4722 [DOI] [PubMed] [Google Scholar]
- Glazier A, Herrera S, Weinnig A, Kurman M, Gomez CE, & Cordes E(2020). Regulation of ion transport and energy metabolism enables certain coral genotypes to maintain calcification under experimental ocean acidification. Molecular Ecology, 29, 1657–1673. 10.1111/mec.15439 [DOI] [PubMed] [Google Scholar]
- Goncalves P, Anderson K, Thompson EL, Melwani A, Parker LM, Ross PM, & Raftos DA (2016). Rapid transcriptional acclimation following transgenerational exposure of oysters to ocean acidification. Molecular Ecology, 25(19), 4836–4849. 10.1111/mec.13808 [DOI] [PubMed] [Google Scholar]
- Gosselin LA, & Qian P-Y (1997). Juvenile mortality in benthic marine invertebrates. Marine Ecology Progress Series, 146(1/3), 265–282. 10.3354/meps146265 [DOI] [Google Scholar]
- Grabherr MG, Haas BJ, Yassour M, Levin JZ, Thompson DA, Amit I, Adiconis X, Fan L, Raychowdhury R, Zeng Q, Chen Z, Mauceli E, Hacohen N, Gnirke A, Rhind N, di Palma F, Birren BW, Nusbaum C, Lindblad-Toh K, … Regev A (2011). Full-length transcriptome assembly from RNA-Seq data without a reference genome. Nature Biotechnology, 29(7), 644–652. 10.1038/nbt.1883 [DOI] [PMC free article] [PubMed] [Google Scholar]
- Griffiths JS, Pan T-C-F, & Kelly MW (2019). Differential responses to ocean acidification between populations of Balanophyllia elegans corals from high and low upwelling environments. Molecular Ecology, 28(11), 2715–2730. 10.1111/mec.15050 [DOI] [PubMed] [Google Scholar]
- Hammond LM, & Hofmann GE (2012). Early developmental gene regulation in Strongylocentrotus purpuratus embryos in response to elevated CO(2) seawater conditions. Journal of Experimental Biology, 215(Pt 14), 2445–2454. 10.1242/jeb.058008 [DOI] [PubMed] [Google Scholar]
- Hardy NA, & Byrne M (2014). Early development of congeneric sea urchins (Heliocidaris) with contrasting life history modes in a warming and high CO2 ocean. Marine Environmental Research, 102, 78–87. 10.1016/j.marenvres.2014.07.007 [DOI] [PubMed] [Google Scholar]
- Henry JJ, & Raff RA (1990). Evolutionary change in the process of dorsoventral axis determination in the direct developing sea urchin, Heliocidaris erythrogramma. Developmental Biology, 141(1), 55–69. 10.1016/0012-1606(90)90101-N [DOI] [PubMed] [Google Scholar]
- Henry JJ, Wray GA, & Raff RA (1990). The dorsoventral axis is specified prior to first cleavage in the direct developing sea urchin Heliocidaris erythrogramma. Development, 110(3), 875–884. [DOI] [PubMed] [Google Scholar]
- Hoffman GE, & Schadt EE (2016). variancePartition: Interpreting drivers of variation in complex gene expression studies. BMC Bioinformatics, 17(1), 483. 10.1186/s12859-016-1323-z [DOI] [PMC free article] [PubMed] [Google Scholar]
- IPCC (2014). Climate change 2014: Synthesis report. Contribution of Working Groups I, II and III to the fifth assessment report of the Intergovernmental Panel on Climate Change. Geneva, Switzerland: IPCC. [Google Scholar]
- Israel JW, Martik ML, Byrne M, Raff EC, Raff RA, McClay DR, & Wray GA (2016). Comparative Developmental Transcriptomics Reveals Rewiring of a Highly Conserved Gene Regulatory Network during a Major Life History Switch in the Sea Urchin Genus Heliocidaris. PLOS Biology, 14(3), e1002391. 10.1371/journal.pbio.1002391 [DOI] [PMC free article] [PubMed] [Google Scholar]
- Jury CP, Delano MN, & Toonen RJ (2019). High heritability of coral calcification rates and evolutionary potential under ocean acidification. Scientific Reports, 9(1), 20419. 10.1038/s41598-019-56313-1 [DOI] [PMC free article] [PubMed] [Google Scholar]
- Karakostis K, Zanella-Cléon I, Immel F, Guichard N, Dru P, Lepage T, Plasseraud L, Matranga V, & Marin F (2016). A minimal molecular toolkit for mineral deposition? Biochemistry and proteomics of the test matrix of adult specimens of the sea urchin Paracentrotus lividus. Journal of Proteomics, 136, 133–144. 10.1016/j.jprot.2016.01.001 [DOI] [PubMed] [Google Scholar]
- Keesing JK (2020). Heliocidaris erythrogramma. In Lawrence JM (Ed.), Sea urchins: Biology and ecology (4th edn., pp. 537–552): Elsevier B.V. [Google Scholar]
- Killian CE, & Wilt FH (2008). Molecular aspects of biomineralization of the echinoderm endoskeleton. Chemical Reviews, 108(11), 4463–4474. 10.1021/cr0782630 [DOI] [PubMed] [Google Scholar]
- Killian CE, & Wilt FH (2017). Endocytosis in primary mesenchyme cells during sea urchin larval skeletogenesis. Experimental Cell Research, 359(1), 205–214. 10.1016/j.yexcr.2017.07.028 [DOI] [PubMed] [Google Scholar]
- Kroeker KJ, Kordas RL, Crim R, Hendriks IE, Ramajo L, Singh GS, Duarte CM, & Gattuso J-P (2013). Impacts of ocean acidification on marine organisms: Quantifying sensitivities and interaction with warming. Global Change Biology, 19(6), 1884–1896. 10.1111/gcb.12179 [DOI] [PMC free article] [PubMed] [Google Scholar]
- Kumar L, & Futschik E (2007). Mfuzz: A software package for soft clustering of microarray data. Bioinformation, 2(1), 5–7. 10.6026/97320630002005 [DOI] [PMC free article] [PubMed] [Google Scholar]
- Kurihara H, Takano Y, Kurokawa D, & Akasaka K (2012). Ocean acidification reduces biomineralization-related gene expression in the sea urchin, Hemicentrotus pulcherrimus. Marine Biology, 159(12), 2819–2826. 10.1007/s00227-012-2043-1 [DOI] [Google Scholar]
- Langmead B, & Salzberg SL (2012). Fast gapped-read alignment with Bowtie 2. Nature Methods, 9(4), 357–U354. 10.1038/Nmeth.1923 [DOI] [PMC free article] [PubMed] [Google Scholar]
- Leaf DS, Anstrom JA, Chin JE, Harkey MA, Showman RM, & Raff RA (1987). Antibodies to a fusion protein identify a cDNA clone encoding msp130, a primary mesenchyme-specific cell surface protein of the sea urchin embryo. Developmental Biology, 121(1), 29–40. 10.1016/0012-1606(87)90135-7 [DOI] [PubMed] [Google Scholar]
- Li W, & Godzik A (2006). Cd-hit: A fast program for clustering and comparing large sets of protein or nucleotide sequences. Bioinformatics, 22(13), 1658–1659. 10.1093/bioinformatics/btl158 [DOI] [PubMed] [Google Scholar]
- Liu Z, Zhang Y, Zhou Z, Zong Y, Zheng Y, Liu C, Kong N, Gao Q, Wang L, & Song L (2020). Metabolomic and transcriptomic profiling reveals the alteration of energy metabolism in oyster larvae during initial shell formation and under experimental ocean acidification. Scientifc Reports, 10(1), 6111. 10.1038/s41598-020-62963-3 [DOI] [PMC free article] [PubMed] [Google Scholar]
- Lopez-Maury L, Marguerat S, & Bahler J (2008). Tuning gene expression to changing environments: From rapid responses to evolutionary adaptation. Nature Reviews Genetics, 9(8), 583–593. 10.1038/nrg2398 [DOI] [PubMed] [Google Scholar]
- Love MI, Anders S, Kim V, & Huber W (2015). RNA-Seq work-flow: Gene-level exploratory analysis and differential expression. F1000Res, 4, 1070. 10.12688/f1000research.7035.1 [DOI] [PMC free article] [PubMed] [Google Scholar]
- Love MI, Huber W, & Anders S (2014). Moderated estimation of fold change and dispersion for RNA-seq data with DESeq2. Genome Biology, 15(12), 550. 10.1186/s13059-014-0550-8 [DOI] [PMC free article] [PubMed] [Google Scholar]
- Lynch M, & Walsh B (1998). Genetics and analysis of quantitative traits, Vol. 1. Sinauer. [Google Scholar]
- Maas AE, Lawson GL, Bergan AJ, & Tarrant AM (2018). Exposure to CO2 influences metabolism, calcification and gene expression of the thecosome pteropod Limacina retroversa. Journal of Experimental Biology, 221(Pt 3), jeb164400. 10.1242/jeb.164400 [DOI] [PubMed] [Google Scholar]
- Mann K, Poustka AJ, & Mann M (2008). The sea urchin (Strongylocentrotus purpuratus) test and spine proteomes. Proteome Science, 6, 22. 10.1186/1477-5956-6-22 [DOI] [PMC free article] [PubMed] [Google Scholar]
- Mark S, Weiss J, Sharma E, Liu T, Wang W, Claycomb JM, & Cutter AD (2019). Genome structure predicts modular transcriptome responses to genetic and environmental conditions. Molecular Ecology, 28(16), 3681–3697. 10.1111/mec.15185 [DOI] [PubMed] [Google Scholar]
- Martin S, Richier S, Pedrotti M-L, Dupont S, Castejon C, Gerakis Y, Kerros M-E, Oberhansli F, Teyssie J-L, Jeffree R, & Gattuso J-P (2011). Early development and molecular plasticity in the Mediterranean sea urchin Paracentrotus lividus exposed to CO2-driven acidification. Journal of Experimental Biology, 214(Pt 8), 1357–1368. 10.1242/jeb.051169 [DOI] [PubMed] [Google Scholar]
- Mehrbach C, Culberson CH, Hawley JE, & Pytkowicx RM (1973). Measurement of the apparent dissociation constants of carbonic acid in seawater at atmospheric pressure1. Limnology and Oceanography, 18(6), 897–907. 10.4319/lo.1973.18.6.0897 [DOI] [Google Scholar]
- Micallef L, & Rodgers P (2014). eulerAPE: Drawing area-proportional 3-Venn diagrams using ellipses. PLoS One, 9(7), e101717. 10.1371/journal.pone.0101717 [DOI] [PMC free article] [PubMed] [Google Scholar]
- O’Donnell MJ, Todgham AE, Sewell MA, Hammond LM, Ruggiero K, Fangue NA, Zippay ML, & Hofmann GE (2010). Ocean acidification alters skeletogenesis and gene expression in larval sea urchins. Marine Ecology Progress Series, 398, 157–171. 10.3354/meps08346 [DOI] [Google Scholar]
- Padilla-Gamino JL, Kelly MW, Evans TG, & Hofmann GE (2013). Temperature and CO2 additively regulate physiology, morphology and genomic responses of larval sea urchins, Strongylocentrotus purpuratus. Proceedings of the Royal Society B: Biological Sciences, 280(1759), 20130155. 10.1098/rspb.2013.0155 [DOI] [PMC free article] [PubMed] [Google Scholar]
- Pan TC, Applebaum SL, & Manahan DT (2015). Experimental ocean acidification alters the allocation of metabolic energy. Proceedings of the National Academy of Sciences U S A, 112(15), 4696–4701. 10.1073/pnas.1416967112 [DOI] [PMC free article] [PubMed] [Google Scholar]
- Patro R, Duggal G, Love MI, Irizarry RA, & Kingsford C (2017). Salmon provides fast and bias-aware quantification of transcript expression. Nature Methods, 14(4), 417–419. 10.1038/nmeth.4197 [DOI] [PMC free article] [PubMed] [Google Scholar]
- Pespeni MH, Sanford E, Gaylord B, Hill TM, Hosfelt JD, Jaris HK, LaVigne M, Lenz EA, Russell AD, Young MK, & Palumbi SR (2013). Evolutionary change during experimental ocean acidification. Proceedings of the National Academy of Sciences USA, 110(17), 6937–6942. 10.1073/pnas.1220673110 [DOI] [PMC free article] [PubMed] [Google Scholar]
- Pierrot D, Lewis E, & Wallace D (2006). MS Excel program developed for CO2 system calculations, ORNL/CDIAC-105a. U.S. Department of Energy, Oak Ridge National Laboratory. [Google Scholar]
- Przeslawski R, Byrne M, & Mellin C (2015). A review and meta-analysis of the effects of multiple abiotic stressors on marine embryos and larvae. Global Change Biology, 21(6), 2122–2140. 10.1111/gcb.12833 [DOI] [PubMed] [Google Scholar]
- Rafiq K, Shashikant T, McManus CJ, & Ettensohn CA (2014). Genome-wide analysis of the skeletogenic gene regulatory network of sea urchins. Development, 141(4), 950–961. 10.1242/dev.105585 [DOI] [PubMed] [Google Scholar]
- Runcie DE, Dorey N, Garfield DA, Stumpp M, Dupont S, & Wray GA (2016). Genomic characterization of the evolutionary potential of the sea urchin Strongylocentrotus droebachiensis facing ocean acidification. Genome Biology and Evolution, 8(12), 3672–3684. 10.1093/gbe/evw272 [DOI] [PMC free article] [PubMed] [Google Scholar]
- Ryan JF (2015). Alien Index (Version 1.0). Zenodo. [Google Scholar]
- Schurch NJ, Schofield P, Gierliński M, Cole C, Sherstnev A, Singh V, Wrobel N, Gharbi K, Simpson GG, Owen-Hughes T, Blaxter M, & Barton GJ (2016). How many biological replicates are needed in an RNA-seq experiment and which differential expression tool should you use? RNA, 22(6), 839–851. 10.1261/rna.053959.115 [DOI] [PMC free article] [PubMed] [Google Scholar]
- Shashikant T, Khor JM, & Ettensohn CA (2018a). From genome to anatomy: The architecture and evolution of the skeletogenic gene regulatory network of sea urchins and other echinoderms. Genesis, 56(10), e23253. 10.1002/dvg.23253 [DOI] [PMC free article] [PubMed] [Google Scholar]
- Shashikant T, Khor JM, & Ettensohn CA (2018b). Global analysis of primary mesenchyme cell cis-regulatory modules by chromatin accessibility profiling. BMC Genomics, 19(1), 206. 10.1186/s12864-018-4542-z [DOI] [PMC free article] [PubMed] [Google Scholar]
- Smith AM, Clark DE, Lamare MD, Winter DJ, & Byrne M (2016). Risk and resilience: Variations in magnesium in echinoid skeletal calcite. Marine Ecology Progress Series, 561, 1–16. 10.3354/meps11908 [DOI] [Google Scholar]
- Smith KE, Byrne M, Deaker D, Hird CM, Nielson C, Wilson-McNeal A, & Lewis C (2019). Sea urchin reproductive performance in a changing ocean: Poor males improve while good males worsen in response to ocean acidification. Proceedings of the Royal Society B: Biological Sciences, 286(1907), 10.1098/rspb.2019.0785 [DOI] [PMC free article] [PubMed] [Google Scholar]
- Smith MS, Collins S, & Raff RA (2009). Morphogenetic mechanisms of coelom formation in the direct-developing sea urchin Heliocidaris erythrogramma. Development Genes and Evolution, 219(1), 21–29. 10.1007/s00427-008-0262-8 [DOI] [PubMed] [Google Scholar]
- Smith-Unna R, Boursnell C, Patro R, Hibberd JM, & Kelly S (2016). TransRate: Reference-free quality assessment of de novo transcriptome assemblies. Genome Research, 26(8), 1134–1144. 10.1101/gr.196469.115 [DOI] [PMC free article] [PubMed] [Google Scholar]
- Sodergren E, Weinstock GM, Davidson EH, Cameron RA, Gibbs RA, Angerer RC, Angerer LM, Arnone MI, Burgess DR, Burke RD, Coffman JA, Dean M, Elphick MR, Ettensohn CA, Foltz KR, Hamdoun A, Hynes RO, Klein WH, Marzluff W, … Wright R (2006). The genome of the sea urchin Strongylocentrotus purpuratus. Science, 314(5801), 941–952. 10.1126/science.1133609 [DOI] [PMC free article] [PubMed] [Google Scholar]
- Soneson C, Love MI, & Robinson MD (2015). Differential analyses for RNA-seq: Transcript-level estimates improve gene-level inferences. F1000Research, 4, 1521. 10.12688/f1000research.7563.2 [DOI] [PMC free article] [PubMed] [Google Scholar]
- Strader ME, Wong JM, & Hofmann GE (2020). Ocean acidification promotes broad transcriptomic responses in marine metazoans: A literature survey. Frontiers in Zoology, 17, 7. 10.1186/s12983-020-0350-9 [DOI] [PMC free article] [PubMed] [Google Scholar]
- Stumpp M, Wren J, Melzner F, Thorndyke MC, & Dupont ST (2011). CO2 induced seawater acidification impacts sea urchin larval development I: Elevated metabolic rates decrease scope for growth and induce developmental delay. Comparative Biochemistry and Physiology - Part A: Molecular and Integrative Physiology, 160(3), 331–340. 10.1016/j.cbpa.2011.06.022 [DOI] [PubMed] [Google Scholar]
- Todgham AE, & Hofmann GE (2009). Transcriptomic response of sea urchin larvae Strongylocentrotus purpuratus to CO2-driven seawater acidification. Journal of Experimental Biology, 212(Pt 16), 2579–2594. 10.1242/jeb.032540 [DOI] [PubMed] [Google Scholar]
- Tu Q, Cameron RA, & Davidson EH (2014). Quantitative developmental transcriptomes of the sea urchin Strongylocentrotus purpuratus. Developmental Biology, 385(2), 160–167. 10.1016/j.ydbio.2013.11.019 [DOI] [PMC free article] [PubMed] [Google Scholar]
- Uppström LR (1974). The boron/chlorinity ratio of deep-sea water from the Pacific Ocean. Deep Sea Research and Oceanographic Abstracts, 21(2), 161–162. 10.1016/0011-7471(74)90074-6 [DOI] [Google Scholar]
- Uthicke S, Schaffelke B, & Byrne M (2009). A boom-bust phylum? Ecological and evolutionary consequences of density variations in echinoderms. Ecological Monographs, 79(1), 3–24. 10.1890/07-2136.1 [DOI] [Google Scholar]
- Varemo L, Nielsen J, & Nookaew I (2013). Enriching the gene set analysis of genome-wide data by incorporating directionality of gene expression and combining statistical hypotheses and methods. Nucleic Acids Research, 41(8), 4378–4391. 10.1093/nar/gkt111 [DOI] [PMC free article] [PubMed] [Google Scholar]
- Walker NS, Fernández R, Sneed JM, Paul VJ, Giribet G, & Combosch DJ (2019). Differential gene expression during substrate probing in larvae of the Caribbean coral Porites astreoides. Molecular Ecology, 28(22), 4899–4913. 10.1111/mec.15265 [DOI] [PMC free article] [PubMed] [Google Scholar]
- Webster AK, Jordan JM, Hibshman JD, Chitrakar R, & Baugh LR (2018). Transgenerational Effects of Extended Dauer Diapause on Starvation Survival and Gene Expression Plasticity in Caenorhabditis elegans. Genetics, 210(1), 263–274. 10.1534/genetics.118.301250 [DOI] [PMC free article] [PubMed] [Google Scholar]
- Williams D, & Anderson D (1975). The reproductive system, embryonic development, larval development and metamorphosis of the sea urchin Heliocidaris erythrogramma (Val.) (Echinoidea : Echinometridae). Australian Journal of Zoology, 23(3), 371–403. 10.1071/ZO9750371 [DOI] [Google Scholar]
- Wolfe K, Dworjanyn SA, & Byrne M (2013). Effects of ocean warming and acidification on survival, growth and skeletal development in the early benthic juvenile sea urchin (Heliocidaris erythrogramma). Global Change Biology, 19(9), 2698–2707. 10.1111/gcb.12249 [DOI] [PubMed] [Google Scholar]
- Wolfe K, Nguyen HD, Davey M, & Byrne M (2020). Characterizing biogeochemical fluctuations in a world of extremes: A synthesis for temperate intertidal habitats in the face of global change. Global Change Biology, 26(7), 3858–3879. 10.1111/gcb.15103 [DOI] [PubMed] [Google Scholar]
- Wong JM, Gaitan-Espitia JD, & Hofmann GE (2019). Transcriptional profiles of early stage red sea urchins (Mesocentrotus franciscanus) reveal differential regulation of gene expression across development. Marine Genomics, 48, 100692. 10.1016/j.margen.2019.05.007 [DOI] [PubMed] [Google Scholar]
- Wong JM, Johnson KM, Kelly MW, & Hofmann GE (2018). Transcriptomics reveal transgenerational effects in purple sea urchin embryos: Adult acclimation to upwelling conditions alters the response of their progeny to differential pCO2 levels. Molecular Ecology, 27(5), 1120–1137. 10.1111/mec.14503 [DOI] [PubMed] [Google Scholar]
- Wray GA, & Raff RA (1990). Novel origins of lineage founder cells in the direct-developing sea urchin Heliocidaris erythrogramma. Developmental Biology, 141(1), 41–54. 10.1016/0012-1606(90)90100-W [DOI] [PubMed] [Google Scholar]
- Wygoda JA, Yang Y, Byrne M, & Wray GA (2014). transcriptomic analysis of the highly derived radial body plan of a sea urchin. Genome Biology and Evolution, 6(4), 964–973. 10.1093/gbe/evu070 [DOI] [PMC free article] [PubMed] [Google Scholar]
- Zhang ZH, Jhaveri DJ, Marshall VM, Bauer DC, Edson J, Narayanan RK, Robinson GJ, Lundberg AE, Bartlett PF, Wray NR, & Zhao Q-Y (2014). A comparative study of techniques for differential expression analysis on RNA-Seq data. PLoS One, 9(8), e103207. 10.1371/journal.pone.0103207 [DOI] [PMC free article] [PubMed] [Google Scholar]
Associated Data
This section collects any data citations, data availability statements, or supplementary materials included in this article.
Supplementary Materials
Data Availability Statement
Sequencing reads and the transcriptome generated in this study are publicly available on Dryad Digital Repository (https://doi.org/10.5061/dryad.3xsj3txdm) (Devens et al., 2020). Transcript abundances and gene sets are available in the Supporting Information Data online.