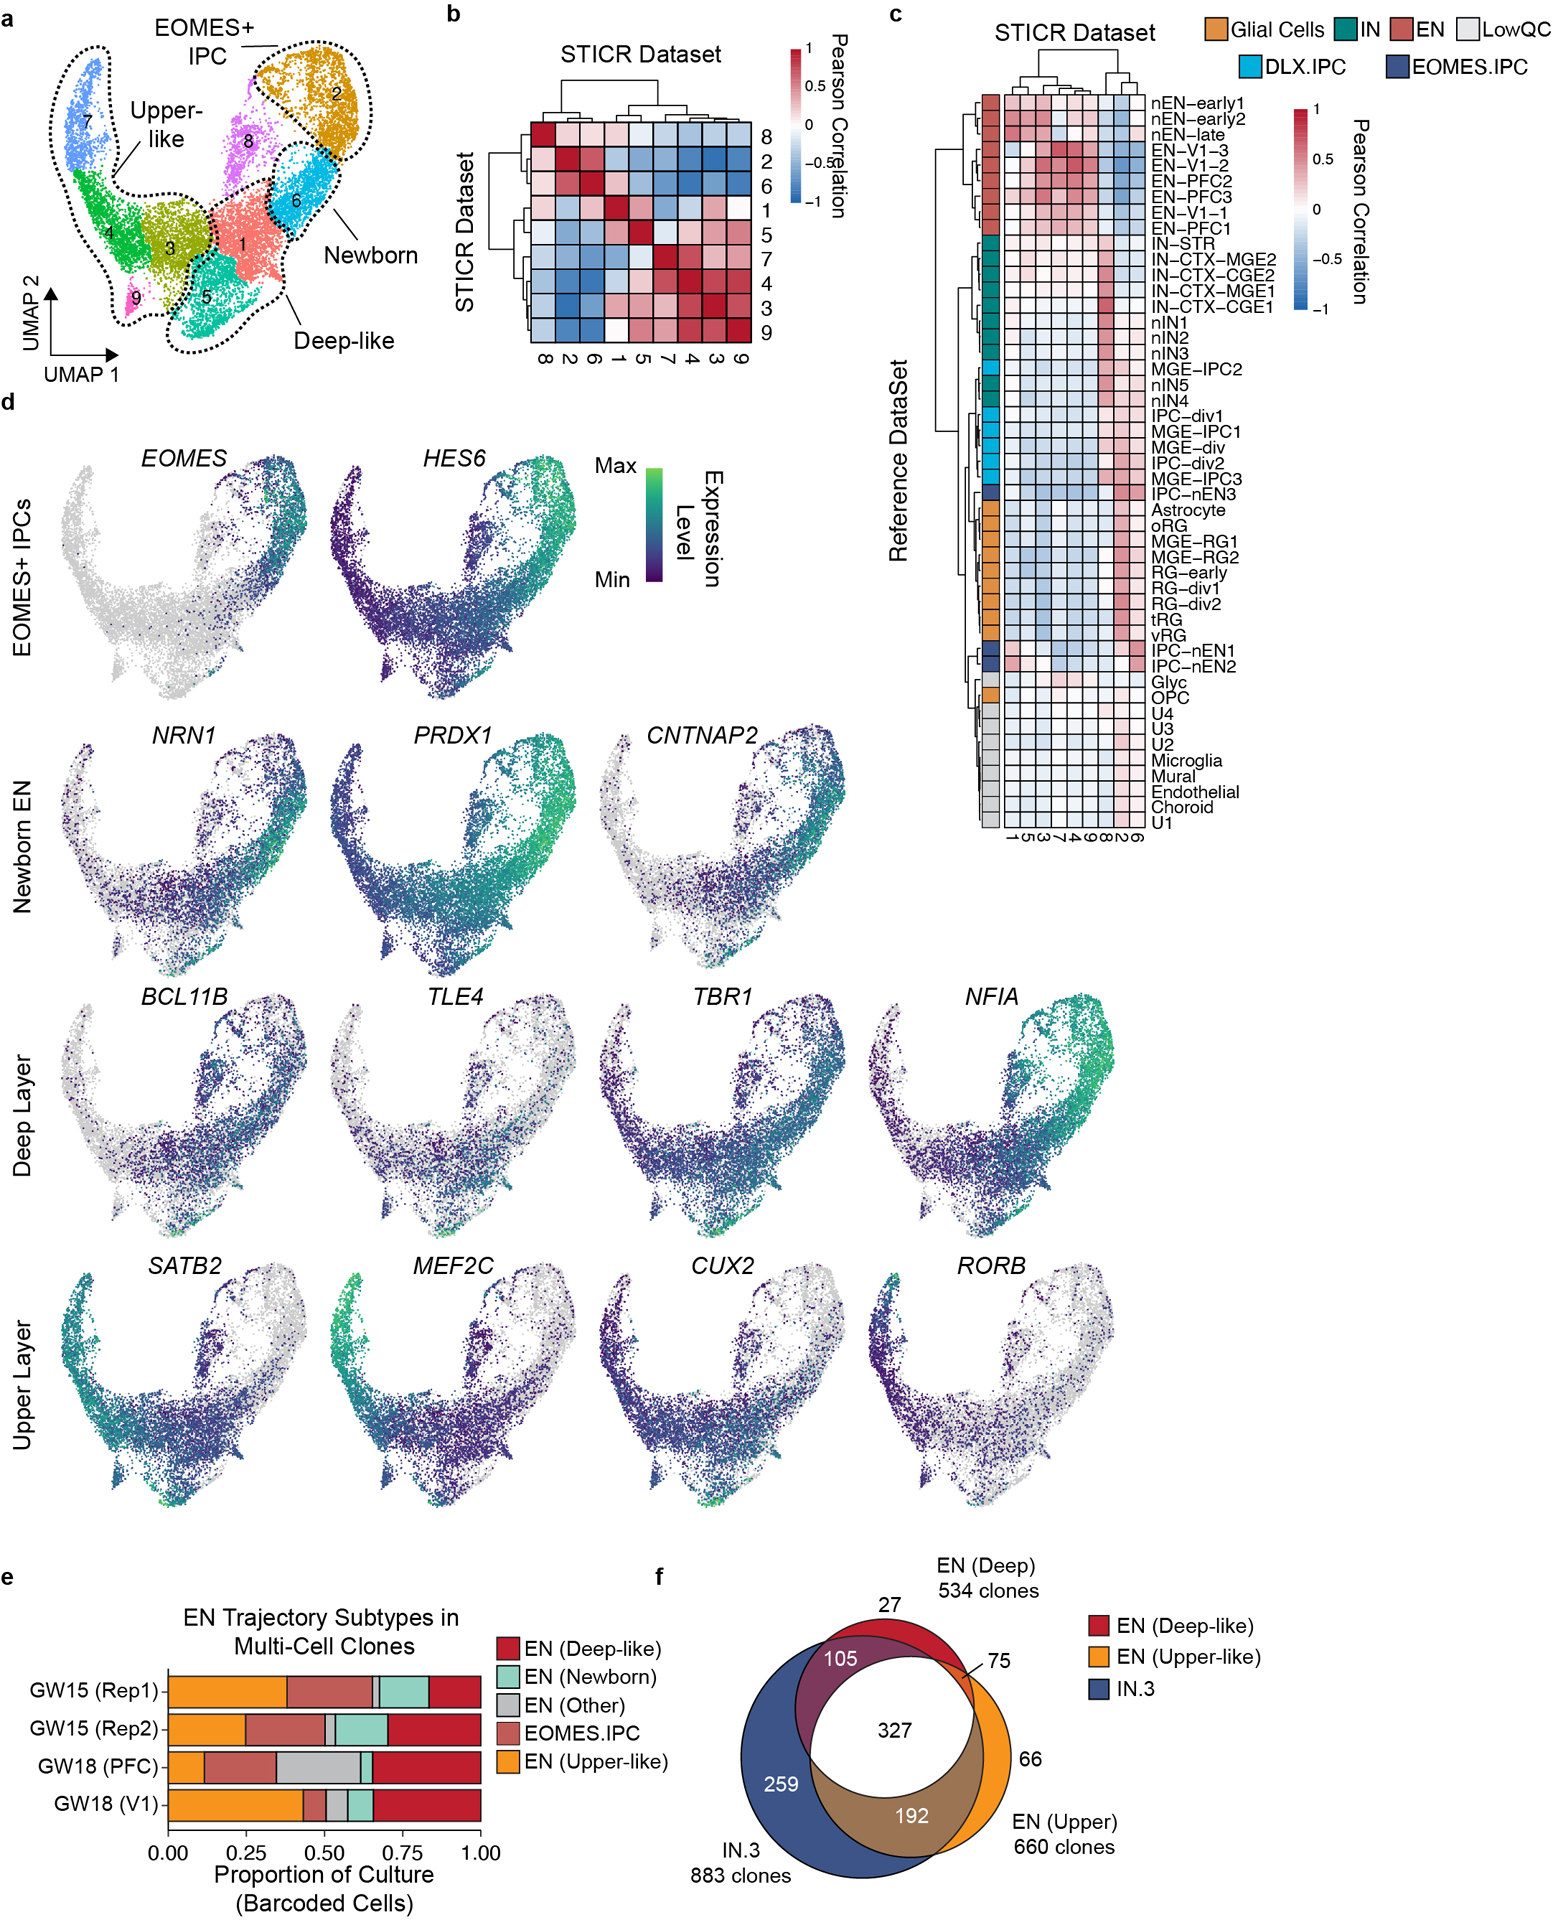
Extended Data Fig. 6. Clonal and Transcriptional Analysis of In Vitro ENs and EOMES+ IPCs.

a) UMAP embedding and Louvain subclustering of EN trajectory cells. b-c) Heatmap depicting pairwise transcriptional cluster correlation of subclustered EN trajectory cells with b) self and c) 2017 Nowakowski et al. developing human brain scRNA-seq atlas. d) Feature plots depicting expression of genes corresponding to labelled subclustered EN trajectory subtypes. e) Stacked barplot depicting relative proportions of EN subtypes within EN trajectory cells of multicellular clones. f) Venn diagram depicting the number of multicellular cortical clones containing Deep-like ENs, Upper-like ENs, and IN.3 cells.
