

Abstract
BAF250b and its paralog BAF250a are the DNA‐binding central hub proteins present in BAF‐B and BAF‐A classes of SWI/SNF chromatin‐remodeling complexes. BAF250b contains an AT‐rich interaction domain (ARID) and C‐terminal BAF250_C domain, and it is found mutated in several cancers. ARID is a conserved helix‐turn‐helix motif‐containing DNA‐binding domain present in several eukaryotic proteins. The ARID of BAF250b has been proposed to play roles in recruiting SWI/SNF to the target gene promoters for their activation. BAF250b ARID structures had been deposited in the protein data bank by a structural genomics consortium. However, it is not well‐studied for its DNA‐binding and solution dynamic properties. Here, we report complete backbone NMR resonance assignments of human BAF250b ARID. NMR chemical shifts and the backbone dynamics showed that the solution structure of the protein matched the reported crystal structures. The structure and chemical shift indexing revealed the presence of a short β‐sheet in the DNA‐binding region of BAF250b ARID that was absent in the structure of its paralog BAF250a ARID. NMR chemical shift perturbations identified DNA‐binding residues and revealed the DNA‐binding interface on BAF250b ARID. NMR data‐driven HADDOCK models of BAF250b ARID – DNA complexes revealed its plausible mode of DNA‐binding. Isothermal titration calorimetry experiments showed that BAF250b ARID interacts with DNA sequences with moderate affinities like BAF250a ARID. However, distinct thermodynamic signatures were observed for binding of BAF250a ARID and BAF250b ARID to AT‐rich DNA sequence, suggesting that subtle sequence and structural differences in these two proteins influence their DNA‐binding.
Keywords: BAF250b ARID, HADDOCK, NMR chemical shift perturbations, protein‐DNA interaction, SWI/SNF
Abbreviations
- ARID
AT‐rich interaction domain
- HADDOCK
(High Ambiguity Driven protein–protein DOCKing)
- SWI/SNF
SWItch/Sucrose Non‐Fermentable
- BAF
BRG1 or hBRM‐associated factors
- NMR
nuclear magnetic resonance
- CSP
chemical shift perturbations
- AIR
ambiguous interaction restraints
- HTH
helix‐turn‐helix
1. INTRODUCTION
A 2,236 residues long DNA binding protein BAF250b (also known as ARID1b) is the largest core subunit of the BAF‐B class of SWI/SNF chromatin remodeling complexes. 1 , 2 , 3 BAF250b and its paralog BAF250a (also known as ARID1a) are mutually exclusive in the BAF complexes and are more than 57% identical across their entire length. 2 , 4 , 5 , 6 , 7 , 8 In transient transfection assays, BAF250a and BAF250b showed similar abilities to enhance the expression of genes from steroid hormone‐responsive promoters. 9 However, although BAF250a and BAF250b shared a high degree of sequence identity and showed similar behavior in transfection assays, the expression profile of these two proteins differs during early primate development, indicating that the proteins have different functions in vivo. Also, BAF250a and BAF250b are found in separate chromatin remodeling complexes, that is, BAF250a is part of BAF‐A, whereas BAF250b is part of BAF‐B complexes. 5 , 9 In ~20% of human cancers, gene encoding BAF subunits are mutated, making them one of the most frequently mutated complexes in cancer. 3 BAF250b was found to be mutated in several cancers and diseases, including ovarian clear cell carcinoma, colorectal cancer, gastric cancer, and hepatocellular carcinoma. 10 , 11 , 12 Therefore, BAF250b has been considered as a tumor suppressor protein. 13 , 14 , 15 , 16
BAF250b and BAF250a share a similar domain architecture that consists of the N‐terminal AT‐rich interaction domain (ARID) and a C‐terminal Armadillo (ARM) repeat‐containing BAF250_C domain 3 , 16 , 17 , 18 , 19 (Figure 1a). The ARID domains of BAF250a and BAF250b share ~80% sequence identity. 17 , 20 , 21 Recently, a 3.7 Å resolution cryo‐electron microscopy structure of the human BAF complex bound to the nucleosome core particle (BAF‐NCP complex) was reported. 22 The structure showed that the seven ARM repeats containing the C‐terminal BAF250_C domain serve as a rigid core and binds with the catalytic subunit BRG1 (SMARCA4) and all subunits of the BAF base module, supporting its importance in BAF complex structure and function. The structure showed that BAF250a maintained the overall scaffold of the BAF complex, and the absence of BAF250a reduced the nucleosome sliding activity of the BAF complex. 23 Interestingly, however, the DNA binding N‐terminal ARID was not visible in the cryoEM structure that was attributed to the flexible nature of the protein in that region. Since BAF250a and BAF250b share high sequence similarity and are mutually exclusive in BAF complexes, BAF250b containing the BAF‐B complex was proposed to be assembled in a similar manner. 22
FIGURE 1.
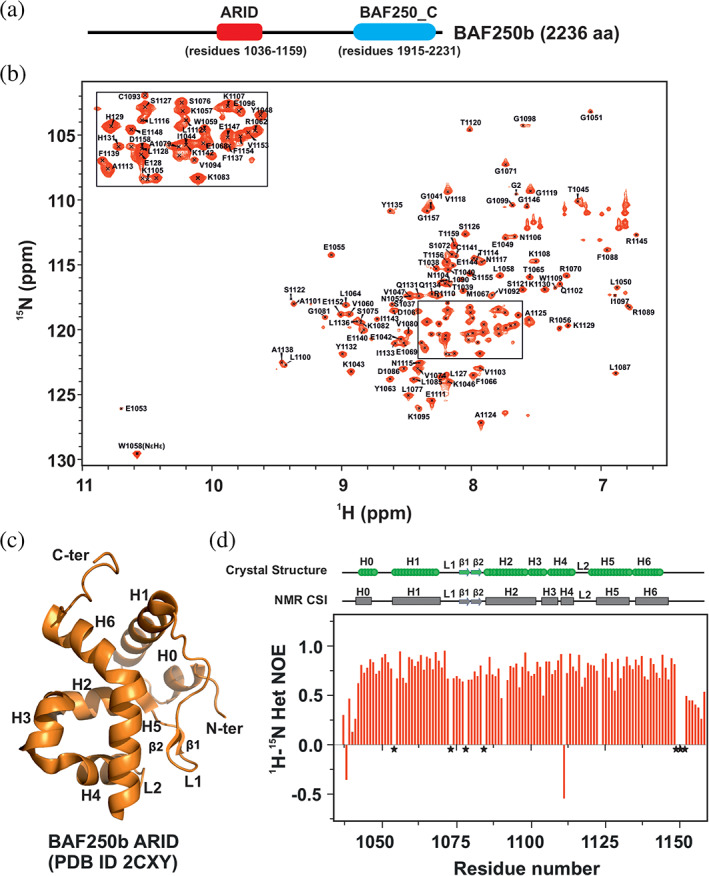
NMR characterization of BAF250b ARID. (a) Domain architecture of BAF250b depicting the ARID and BAF250_C domains. This study used the ARID construct that encompasses residues 1,036–1,159 of BAF250b. (b) Assigned 2D 1H‐15N HSQC spectrum of BAF250b ARID (residues 1,036–1,159). An enlarged view of the selected crowded region is shown in the inset. (c) Crystal structure of BAF250b ARID (PDB ID 2CXY). The secondary structure elements are marked. (d) A plot of 1H‐15N heteronuclear‐NOE values vs. residues of BAF250b ARID. The proline residues, which cannot be observed in 2D 1H‐15N HSQC spectra, are marked with the asterisks (*) in the figure. The secondary structure of BAF250b, as observed in the crystal structure (green) and deduced from the NMR chemical shift indexing (gray), is shown at the top of the figure
The ARID (~110 residues in length) is an atypical helix‐turn‐helix (HTH) motif‐containing DNA binding domain found in several proteins across different eukaryotes. 17 , 24 , 25 ARID‐containing proteins have been shown to have diverse cellular roles, which include roles in embryonic development, transcriptional regulation, and cell cycle control. 24 The structural fold of the ARID and its DNA binding properties were shown to be important for the cellular functions of BAF250a. The affinity of the BAF‐A complex for the nucleosome was shown to be reduced due to the disruption of the BAF250a ARID–DNA interactions. 26 Additionally, the ARID‐containing regions of BAF250a and BAF250b were shown to promote the transcriptional activation by steroid hormone receptors. 4 Deletion of ARID from BAF250b protein resulted in the loss of glucocorticoid receptor‐mediated transcriptional activation, suggesting its direct role in the recruitment of SWI/SNF to the target gene promoters. 4 , 26 These studies have suggested that ARID/DNA interactions are important for the specific recruitment of SWI/SNF complexes to certain genes for their activation. ARIDs of Dri (Dead ringer) from Drosophila, murine protein Bright, and human Mrf2 (modulator recognition factor 2) were shown to bind to the AT‐rich core of consensus DNA sequences. 27 , 28 , 29 , 30 The structure of ARIDs from Dri and Mrf2 with DNA were determined, which provided molecular details of ARID – DNA interactions in these proteins. 31 , 32 , 33 These structures revealed that a non‐canonical HTH motif (helices H3/H4 – loop L2 – helix H5) interacts specifically with A/T bases in the major groove of DNA.
Using DNase protection assays and GST‐fusion proteins, BAF250a and BAF250b ARIDs were found to bind DNA without any sequence preference. 21 , 34 Recently NMR spectroscopy, structural, and thermodynamics analysis have suggested that BAF250a ARID may have sequence and structural determinants for specific binding to AT‐rich DNA. 35 , 36 However, the structure and DNA binding properties of BAF250b ARID in terms of thermodynamics and molecular details have not been systematically studied. Two crystal structures of BAF250b ARID have been deposited in Protein Data Bank (PDB) (PDB IDs 2CXY and 2EH9) by the RIKEN Structural Genomics/Proteomics Initiative (RSGI) consortia. The structure revealed that while the core ARID fold consists of six helices as observed in other ARIDs, there are subtle differences in BAF250b ARID. This includes the presence of short N and the C‐terminal helices and the presence of a short β‐sheet in the loop L1 that connects helices H2 and H3. The N and the C‐terminal helices were found in its paralog BAF250a ARID structure. However, the short β‐sheet in the loop L1 was found absent in BAF250a ARID but was found in Dri ARID structure, suggesting that these subtle structural differences may influence the DNA binding properties of ARIDs in different proteins. 37 , 38
Here, we have studied the structure and DNA binding properties of BAF250b ARID using NMR spectroscopy and isothermal titration calorimetry (ITC). Using standard triple resonance NMR experiments, we have achieved the complete backbone resonance (amide nitrogen and proton, CO, Cα, and Cβ atoms) assignments of human BAF250b ARID. NMR chemical shifts based indexing and backbone dynamics (using backbone heteronuclear NOE) showed that the BAF250b ARID structure in solution is the same as observed in the crystal structure. NMR chemical shift perturbations (CSP) derived from 2D 1H‐15N HSQC titration experiments revealed the key DNA binding residues of BAF250b ARID. These residues were mapped onto the crystal structure of BAF250b ARID, which identified the DNA binding interface on protein. NMR CSP driven HADDOCK models of BAF250b ARID – DNA complexes reveal its plausible mode of DNA binding and showed that the atypical HTH motif (consisting of helix H4 – loop L2 – helix H5) and short β‐sheet containing loop L1 of ARID constitute the main DNA binding regions of BAF250b ARID. Isothermal titration calorimetry experiment results showed that BAF250b ARID interacts with DNA sequences with moderate affinities similar to BAF250a ARID. 35 , 36 However, distinct thermodynamic signatures were observed for binding BAF250b ARIDs with the 12mer AT‐rich dsDNA sequence suggesting that subtle sequence and structural difference in different ARIDs influence the DNA binding.
2. RESULTS
2.1. Backbone resonance assignment of BAF250b ARID
There are two structures of human BAF250b ARID in the protein data bank (PDB) deposited by the RIKEN Structural Genomics/Proteomics Initiative (RSGI) consortia (PDB IDs 2CXY and 2EH9). To understand the solution behavior and DNA binding properties of BAF250b ARID, we decided to characterize it using solution‐state NMR spectroscopy methods. In the protein construct used in this study, the BAF250b ARID consists of 126 residues that include seven proline residues. We, therefore, expect 119 backbone NH cross‐peaks (excluding the eight residues from the purification tag) in the 2D 1H‐15N HSQC spectra of the protein. We observed well‐dispersed cross peaks of uniform intensities in the 2D 1H‐15N HSQC spectra, indicating that the recombinant protein is well folded in solution (Figure 1b). Sequential assignment of the backbone atoms was achieved by analyzing CBCA(CO)NH/HNCACB and HNCO/HN(CA)CO pairs of the triple resonance spectrum. 39 The side‐chain resonances were assigned by analyzing HBHA(CO)NH, H(CCO)NH, and CC(CO)NH spectrum. A total of 116 amide nitrogen (N) and amide proton (NH) atoms (out of 119 non‐proline residues) have been assigned in the 2D 1H‐15N HSQC spectra (Figure 1b). Overall, we have assigned 97.5% of N and NH, 94% Cα, 93% of Cβ, and 97% of CO atoms of BAF250b ARID. There are few unassigned peaks in the 2D 1H‐15N HSQC spectra. These peaks may represent a minor conformation or 10 residues that we could not assign (M1, S1036, Y1091, S1123, and six residues from the C‐terminal His‐tag). Additionally, we have also assigned 86% Hα, 54% Hβ, 33% Hγ, 23% Hδ, 52% Cγ, and 21% Cδ atoms by analyzing the 3D HBHA(CO)NH, H(CCO)NH, and CC(CO)NH experiments. All the assigned chemical shifts have been deposited in the Biological Magnetic Resonance Data Bank (BMRB) (http://bmrb.wis.edu) under accession number 51010.
2.2. NMR chemical shifts and heteronuclear NOE data correlate with the crystal structure of BAF250b ARID
The crystal structure of BAF250b ARID (PDB IDs 2CXY and 2EH9) showed that it consists of a typical ARID fold composed of six core α‐helices, namely H1 (residues 1,055–1,071), H2 (residues 1,086–1,098), H3 (residues 1,099–1,107), H4 (residues 1,108–1,116), H5 (residues 1,121–1,136), H6 (residues 1,136–1,146), and two‐loop regions L1 (between H1 and H2), and L2 (between H4 and H5). A short helix H0 (residues 1,045–1,050) is present at the N‐terminus. A short β‐sheet was also observed in the loop L1 region between H1 and H2 helices in the crystal structure (Figure 1c). We performed chemical shift indexing based on the backbone resonance assignments using PECAN (an algorithm for probabilistic prediction of protein secondary structure from NMR chemical shifts) 40 and chemical shifts indexing using CSI 3.0 webserver 41 to predict the secondary structure of BAF250b ARID (Figure S1a,b). This analysis confirmed the presence of all seven α‐helices (H0 to H6) and a short β‐sheet containing Loop L1 between H1 and H2 helices as seen in the crystal structure of BAF250b ARID (Figure 1c). Interestingly, in case of BAF250a ARID (paralogue of BAF250b), the previously determined structure and chemical shift indexing showed that loop L1 lacks the short β‐sheet (Figure S1c). The two short β strands (β1 and β2) are hydrogen‐bonded to each other forming a short β‐sheet in the loop L1 of BAF250b ARID (Figure S2).
We recorded a steady‐state backbone {1H}‐15N heteronuclear NOE (het‐NOE) experiment on BAF250b ARID. The backbone {1H}‐15N heteronuclear NOE experiment provides information on the motion of individual N‐H bond vectors. 42 Those that undergo motion faster than the overall tumbling of the molecules (in ps to ns timescale) show a decreased het‐NOE intensity relative to the average observed for most of the residues. For instance, decreased het‐NOE values are observed for the residues at the N‐ and C‐terminal ends and flexible loop regions of the protein compared to the ordered and rigid regions that show positive heteronuclear NOE values of ~0.8. The steady‐state {1H}‐15N heteronuclear NOE values versus residue number for BAF250b ARID are shown in Figure 1d. The first nine residues at the N terminus and the last 18 residues at the C terminus have low {1H}‐15N heteronuclear NOEs, which suggest that these regions are unstructured in nature. Low het‐NOE values of residues 1,072–1,085 are indicative of a flexible loop L1. Residues T1040 and E1111 exhibited a negative value of {1H}‐15N heteronuclear NOE (Figure S3). While the residues T1040 is present at the flexible N‐terminus of the protein, residues E1111 kinks a helix that results in the formation of helices H3 and H4; therefore, we speculate that flexibility at this residue position is required to bring this structural change. The other regions showed high positive values of {1H}‐15N heteronuclear NOE, which correlated well with the reported crystal structure of BAF250b ARID (PDB ID 2CXY) (Figure 1d).
2.3. The short β‐sheet in the loop L1 region is a stable secondary structure in BAF250b ARID
To gain molecular insights into the structural stability of the observed short β‐sheet in loop L1 region in the structure of BAF250b ARID, we performed an all‐atom MD simulation of 50 ns using GROMOS96 53a6 united atom force field. 43 Thermodynamic properties such as temperature and energies were monitored during the MD simulations, and all converged to stable values. The time evolutions of Root Mean Square Deviation (RMSD) of the backbone atoms were analyzed that showed that BAF250b ARID achieved comparable stability that continued throughout the simulation time of 50 ns (Figure S4a). Root Mean Square Fluctuation (RMSF) over 50 ns simulation showed increased mobility of residues from loop L1 and C‐terminal region (Figure S4b).
Time evolutions of Secondary Structure Elements (SSE) were monitored to follow the structural change during the simulation time. This analysis showed that most of the SSEs including short β‐sheet in the loop L1 of BAF250b maintain their structural stability throughout the simulation time of 50 ns (Figure S4c).
2.4. NMR chemical shift perturbation experiments identified DNA binding residues of BAF250b ARID
We used two double‐stranded DNA sequences, namely Mrf2‐15 DNA and Dri‐15 DNA, that had been previously used in other studies to understand the DNA binding activities of ARID domains from Mrf2, Dri, and BAF250a proteins (Table 1). 31 , 32 , 35 Increasing amount of DNA was added to a 0.1 mM sample of 15N labeled BAF250b ARID, and 2D 1H‐15N HSQC spectra were acquired at each step of the titration. Initial disappearance of several resonance peaks in the 2D 1H‐15N HSQC spectrum was observed that reappeared at distinct chemical shift positions upon further addition of DNA (Figure 2a,b). This suggested that the protein–DNA complexes are in the intermediate to slow exchange regime on the NMR timescale. For both Dri‐15 DNA and Mrf2‐15 DNA titrations, the CSPs at the 1:2 saturating ARID: DNA ratio were calculated and plotted against the ARID residues (Figure 3a,b). Similar CSPs in the case of both DNAs revealed that the same set of binding residues of BAF250b ARID is responsible for ARID – DNA interactions. Significant CSPs (above average CSP) were observed in residues from loop L1, including the residues from β‐sheet, helix H3, helix H4, loop L2, helix H5, and helix H6 of BAF250b ARID, along with some residues from the N‐ and the C‐terminal region of ARID (Figure 3c,d). Residues A1080, K1083, K1106, W1110, S1128, and K1131 were completely broadened and hence disappeared upon DNA binding. Based on NMR CSPs, we identified the DNA binding surface of BAF250b ARID to consist of surface‐exposed residues from loop L1, including the β‐sheet, helix H3, helix H4, helix H5, and helix H6 (Figure. 3c,d).
TABLE 1.
Thermodynamic parameters derived from ITC experiments for BAF250b ARID and DNA binding. The sequences of dsDNA used in the titrations are also shown (both the strands of the DNAs are shown)
| S. no. | DNA used in ITC experiment for BAF250b ARID/DNA interaction | Temp. | K d (μM) | ΔG (kcal Mol−1) | ΔH (kcal Mol−1) | TΔS (kcal Mol−1) |
|---|---|---|---|---|---|---|
| 1 |
Dri‐15 DNA 5’‐CCTGTATTGATGTGG‐3′ 3’‐GGACATAACTACACC‐5′ |
30°C | 4.42 ± 1.63 | −7.42 ± 2.74 | −1.05 ± 0.97 | 6.37 |
| 2 |
Mrf2‐15 dsDNA 5’‐TACAATATAACGTCG‐3′ 3’‐ATGTTATATTGCAGC‐5′ |
30°C | 5.29 ± 1.46 | −7.31 ± 2.01 | −1.74 ± 0.14 | 5.57 |
| 3 |
AT‐12 DNA 5′‐ATATATATATAT‐3′ 3′‐TATATATATATA‐5′ |
5°C | 4.76 ± 1.27 | −6.77 ± 1.80 | −8.29 ± 2.41 | −1.53 |
| 15°C | 4.85 ± 0.82 | −7.00 ± 1.18 | −11.9 ± 1.15 | −4.86 | ||
| 25°C | 5.41 ± 1.14 | −7.18 ± 1.51 | −11.48 ± 1.62 | −4.30 |
FIGURE 2.

Chemical shift perturbations (CSP) observed in BAF250b ARID upon interaction with DNA. (a) An overlay of 2D 1H‐15N HSQC spectra of free ARID (black) and ARID/Dri‐15 DNA complex (red) at a 1:2 molar ratio. (b) An overlay of 2D 1H‐15N HSQC spectra of free ARID (black) and ARID/Mrf2‐15 DNA complex (red) at a 1:2 molar ratio
FIGURE 3.

Plot of CSP versus residues for BAF250b ARID – DNA interactions. (a, b) CSP plot for BAF250b ARID/Dri‐15 DNA (a) and ARID/Mrf2‐15 DNA (b) at 1:2 protein to DNA molar ratio. The proline residues, which cannot be observed in 2D 1H‐15N HSQC spectra, are marked with the asterisks (*) in the figures. The orange line in‐dash represents the average CSP. The red line in‐dash represents average plus one standard deviation CSP. The residues whose resonance were broadened and disappeared upon DNA titrations are shown with infinite lines. The secondary structure of BAF250b is depicted on the top of the figures. (c, d) Average and above‐average CSPs observed for BAF250b ARID/Dri‐15 DNA (c), and ARID/Mrf2‐15 DNA (d) interactions are mapped on the BAF250b ARID structure. Above‐average CSPs are shown in color. Residues showing CSPs between average and average plus one standard deviation are shown in orange. Residues showing CSPs above average plus one standard deviation are shown in red
2.5. NMR CSP driven docked models of BAF250b ARID – DNA complexes suggest a plausible DNA binding mechanism
We generated NMR CSPs driven HADDOCK 44 models of ARID/Dri‐15 DNA and ARID/Mrf2‐15 DNA complexes to gain structural insights into the possible mode of ARID – DNA interactions and to understand BAF250b ARID – DNA binding surfaces in more detail. The ARID residues that showed CSPs above‐average plus one standard deviation and all the DNA nucleotides were chosen as active residues in the HADDOCK protocol. HADDOCK produced a total of 106 structures in 15 clusters and 85 structures in 15 clusters for ARID/Dri‐15 DNA and ARID/Mrf2‐15 DNA complexes, respectively. All the major clusters (nine in ARID/Dri‐15 and eight in ARID/Mrf2‐15 out of best 10 clusters) consist of structural models of ARID/DNA complexes where ARID interacts with DNA mainly in the major groove using the extended H5 helix. Figure S5 shows the structural ensemble (of four structures) of the top two clusters (in terms of lowest HADDOCK score, lowest z‐score, and the number of structures in each cluster) for ARID/Dri‐15 DNA (Figure S5a,b) and ARID/Mrf2‐15 DNA (Figure S5c,d), showing that overall, the structures in top clusters are similar. For further description of the results, we selected the lowest energy structures of BAF250b ARID/Dri‐15 DNA from cluster 1 and BAF250b ARID/Mrf2‐15 DNA from cluster 2 (Figure S5a,c and Figure 4a,b). The overall orientation of protein and DNA in these HADDOCK models was similar to the previously determined structures of Dri ARID/DNA structure (Figure S5e), 31 Mrf2 ARID/DNA structure (Figure S5f), 32 and BAF250a ARID/DNA model structures. 35 , 36
FIGURE 4.

Selected HADDOCK model structures of BAF250b ARID/DNA complexes. (a) HADDOCK structure of BAF250b ARID/Dri‐15 DNA complex. (b) HADDOCK structure of BAF250b ARID/Mrf2‐15 DNA complex. The side chains of residues that were used as “active residues” in HADDOCK are shown in stick representations. The secondary structural elements in BAF250b ARID are marked
In the selected HADDOCK model structures, the total buried surface area between ARID and Dri‐15 DNA and Mrf2‐15 DNA is 1,454.6 Å2 and 1,480.6 Å2, respectively. The HADDOCK score and Z score of the selected HADDOCK structure of the BAF250b ARID/Dri‐15 DNA complex are −89.6 +/− 7.7 and −1.6, respectively. Similarly, the HADDOCK score and Z score of the selected HADDOCK structure of BAF250b ARID/Mrf‐15 DNA are −93.0 +/− 6.9 and −1.7, respectively. Van der Waals energies of selected HADDOCK structures of BAF250b ARID/Dri‐15 and BAF250b ARID/Mrf2‐15 are −35.0 +/− 5.2 kcal mol−1 and ‐36.8 +/− 8.9 kcal mol−1, respectively. Electrostatic energies of selected HADDOCK structures of BAF250b ARID/Dri‐15 and BAF250b ARID/Mrf2‐15 are −550.1 +/− 57.6 kcal mol−1 and −537.9 +/− 55.6 kcal mol−1, respectively (Table S1).
The HADDOCK structures of ARID/Dri‐15 DNA and ARID/Mrf2‐15 DNA complexes show that ARID contacts DNA in the major groove mainly via the H5 helix. The residues from the β‐sheet in loop L1 interact with the minor groove of DNA mainly to the sugar‐phosphate backbone, and these residues showed high CSPs. This interaction stabilizes the BAF250b ARID – DNA interaction by immobilization of the molecular interface (Figure 4a,b). A few residues from N‐terminal, helix H3, helix H4, and helix H6 contact the sugar‐phosphate backbone in the adjacent minor groove of DNA.
2.6. Isothermal titration calorimetry results provided the binding affinity and thermodynamics of human BAF250b ARID – DNA Interaction
Isothermal titration calorimetry (ITC) experiments provide the equilibrium dissociation constant (K d), the change in enthalpy (ΔH), the change in entropy (ΔS), and the stoichiometry (n) of interaction under a set of experimental conditions. We followed the BAF250b ARID – DNA interactions using ITC. Mrf2‐15 and Dri‐15 DNAs were titrated with BAF250b ARID. The titrations were repeated two or three times for the consistency of the data. The ITC experiments were carried out at 30°C. Interaction of BAF250b ARID with both Dri‐15 and Mrf2‐15 dsDNAs proceeded with exothermic reactions with the apparent equilibrium dissociation constants, K ds of 4.42 ± 1.63 μM and 5.29 ± 1.46 μM and the stoichiometry (n) of 1.02 ± 0.06 and 1.00 ± 0.06, respectively (Figure 5a,b and Table 1). The dissociation constants of BAF250b ARID – DNA interactions are in the range of BAF250a ARID – DNA interactions reported previously. 35 , 36
FIGURE 5.

BAF250b ARID – DNA interactions monitored using ITC experiments. (a, b) Raw and fitted ITC isotherms for the interaction of BAF250b ARID with Dri‐15 DNA (a) and Mrf2‐15 DNA (b). The calculated K ds are mentioned in each figure panel
In the next sets of experiments, we used a 12mer alternating AT base‐paired containing dsDNA (AT‐12 DNA) (Table 1). This DNA was used previously in studies involving ARID domains from yeast SWI and human BAF250a. 31 , 32 , 35 The ITC experiments were carried out at 5°C, 15°C, and 25°C. Enthalpy‐driven interactions between BAF250b ARID and AT‐12 DNA were observed at all three temperatures (Figure 6a–c and Table 1). The apparent K ds of 4.76 ± 1.27 μM, 4.85 ± 0.82 μM, and 5.41 ± 1.14 μM were obtained for BAF250b ARID – AT‐12 DNA interactions at 5°C, 15°C, and 25°C, respectively. Stoichiometry of ~1:1 is observed in all the cases. The K d and ΔH values of BAF250b ARID – AT‐12 DNA interactions are compared with BAF250a ARID – AT‐12 DNA interactions from a published study 36 at different temperatures to compare their DNA binding properties. This analysis showed that compared to BAF250a ARID/AT‐12 DNA interaction, a small change in ΔH and affinity was observed for BAF250b ARID and AT‐12 DNA interaction at different temperatures (5°C, 15°C, and 25°C) (Figure 6d,e).
FIGURE 6.

BAF250b ARID/AT‐12 DNA interactions monitored using ITC experiments. (a‐c) Raw and fitted ITC isotherms for the interaction of BAF250b ARID with AT‐12 DNA at 5°C (a), 15°C (b), and 25°C (c), respectively. The calculated K ds are mentioned in each figure panel. (d, e) Comparison of enthalpy change (ΔH) and equilibrium dissociations constants (K ds) of BAF250a ARID/AT‐12 DNA and BAF250b ARID/AT‐12 DNA interactions at 5°C, 15°C, and 25°C. The plot of ΔH values vs. temperature (d) and the plot of K d values vs. temperature (e) for the interactions of BAF250b ARID (in red bars) and BAF250a ARID 36 (in black bars) with AT‐12 DNA
3. DISCUSSION
BAF250a and BAF250b are paralogs that share ~57% sequence identity across full‐length sequences. Both the proteins share similar domain architecture that consists of N‐terminal ARID and C‐terminal ARM‐repeats containing BAF250_C domains. However, the association of BAF250a and BAF250b subunits with other proteins result in distinct SWI/SNF complexes, namely BAF‐A (with BAF250a) or BAF‐B (with BAF250b) complexes. 2 The ARIDs from these two proteins share a sequence identity of ~80% (Figure 7a).
FIGURE 7.

Sequence and structural comparison of ARIDs of BAF250b and BAF250a. (a) Sequence and secondary structure alignment of BAF250b ARID and BAF250a ARID. Non‐identical amino acids are highlighted in green and the β‐sheet forming residues in loop L1 region of BAF250b ARID are highlighted in blue. (b) Structural overlay of BAF250b ARID (PDB ID 2CXY) in yellow and BAF250a ARID (PDB ID 1RYU) in gray. Non‐identical amino acids are highlighted in green and the short β‐sheet in loop1 region is highlighted in blue in the structure of BAF250b ARID
ARID is a well‐conserved fold found in several eukaryotic proteins and comprises six core helices and two notable loops. However, N and C‐terminal extensions have been observed in ARIDs. 29 For example, ARIDs of BAF250a and BAF250b contain an extra N‐terminal helix (H0). The structure and NMR chemical shifts analysis presented in this study revealed the presence of a short β‐sheet in loop L1 region in BAF250b ARID, which was found absent in BAF250a ARID (Figure S1b,c). A closer inspection of ARID sequences from these two proteins revealed that the sequence of the loop L1 containing region differs between these two proteins, although the β‐sheet forming residues are the same in these two proteins (Figure 7a,b). The L1 loop is rich in Ser residues in the case of BAF250b ARID (Figure 7a). NMR CSPs had revealed residues from loop L1 to be involved in DNA binding in both BAF250a ARID 29 , 35 , 36 and BAF250b ARID (studied here). In these two ARIDs, the DNA‐interacting residues from helix H5 are nearly identical. Therefore, the difference in DNA binding may arise from other contacts such as residues from loop L1. Indeed the DNA interacting residues from loop L1 of BAF250b ARID differ from the interacting residues of loop L1 in BAF250a ARID. Also, loop L1 harbors β‐sheet in BAF250b structure which is absent in BAF250a ARID. We postulate that these subtle differences in the sequence and structure of ARIDs may fine‐tune the DNA binding affinity and specificity in different proteins.
NMR CSP‐based analysis and docked HADDOCK models showed that BAF250b ARID mainly interacts with DNA via a non‐canonical HTH motif (consisting of helix H4 – loop L2 – helix H5) similar to the mode of DNA recognition by other ARID proteins such as Dri, Mrf2, and BAF250a (Figure 4 and Figure S5). 31 , 32 , 35 , 36 Here, the second helix is called the “recognition helix” that inserts into the major groove and makes specific interactions with the bases. The short β‐sheet containing loop L1 residues also showed high CSPs. Equivalent regions in Dri and Mrf2 ARIDs were shown to provide non‐specific anchoring contacts to the adjacent sugar‐phosphate backbone in the minor groove of DNA (Figure S5e,f). 31 Therefore, the structure and sequence of this region of the protein play a role in DNA binding.
ITC results showed that BAF250b ARID binds DNAs of different sequence compositions (Dri‐15 DNA, Mrf2‐15 DNA, and AT‐12 DNAs) with moderate affinity (K ds in low μM range) (Table 1). In cases of Dri‐15 and Mrf2‐15 DNAs, binding with BAF250b ARID was both enthalpically and entropically favored. The entropic contribution may likely be due to the release of water molecules from DNA upon complex formation with protein, result in moderate DNA distortion, flexible, and less complementary protein‐DNA interface in the complex. However, the thermodynamic signature of BAF250b ARID – AT‐12 DNA interaction was different from Dri‐15 and Mrf2‐15 DNAs. The BAF250b ARID – AT‐12 DNA binding was only enthalpically driven (and entropically opposed with a negative TΔS entropy term). This suggests that ARID – AT‐12 DNA binding might result in a structured and better‐adapted complex. The protein – DNA interactions can be “sequence‐specific,” “non‐specific,” “non‐sequence specific (minimum sequence‐specific),” or “structure‐specific.” 45 Specific protein‐DNA interactions are usually driven by negative enthalpy and entropy change. Based on the ITC results, we propose that the BAF250b ARID/AT‐12 DNA complex is likely a structure‐specific adapted complex. This may arise from the intrinsic properties of AT‐12 DNA such as its flexibility and 3D shape.
We compared the DNA binding of BAF250b ARID with its paralog BAF250a ARID that we had reported earlier. 36 At 25°C, both BAF250a and BAF250b ARIDs showed enthalpically (ΔH) driven interaction with AT‐12 DNA. However, at lower temperatures (5°C and 15°C), we observed distinct DNA binding patterns for BAF250b ARID compared to BAF250a ARID. A temperature‐dependent change in binding affinity (K d) and enthalpy change (ΔH) was observed in the case of BAF250a ARID – AT‐12 DNA binding (Figure 6d,e). However, no significant change in binding affinities (K ds) or enthalpy change (ΔH) were observed in the case of BAF250b ARID – AT‐12 DNA binding (Figure 6d,e). These results suggest that subtle sequence and structural changes in ARIDs (such as β‐sheet in loop L1) may influence their DNA binding properties (Figure 7a,b).
In conclusion, here we have reported the complete backbone 1H, 13C, and 15N chemical shifts assignment and backbone dynamics of BAF250b ARID. NMR CSP driven HADDOCK models of BAF250b ARID – DNA complexes showed that the residues of an atypical HTH (helix H4 – loop L2 – helix H5) motif and a short β‐sheet containing loop L1 provides the main determinants for DNA binding. ITC experiments with DNA of different sequences showed that BAF250b ARID interacts with DNA with low micromolar affinities.
4. MATERIALS AND METHODS
4.1. Cloning, protein expression, and purification of human BAF250b ARID
The DNA sequence coding for ARID (residues 1,036–1,159) of BAF250b (Uniprot identifier Q8NFD5–1) was PCR amplified using CMV‐T7‐hOsa2 (BAF250b is also known as Osa2 in humans) as a template and subcloned into E. coli expression vector pET28a between NcoI and XhoI restriction sites. CMV‐T7‐hOsa2 was a gift from Naoko Tanese (Addgene plasmid # 17987). The resulting plasmid encodes a protein of a total of 134 residues, which includes eight C‐terminus hexahistidine containing affinity purification tag (sequence LEHHHHHH). Protein was expressed in BL21(DE3) Rosetta cells in LB media. For isotopic labeling of the protein, a modified M9 minimal media containing 15NH4Cl and/or 13C D‐glucose was used. Bacterial cells were grown at 37°C till the optical density at 600 nm (OD600) reached 0.8, and then the temperature was reduced to 18°C. The cells were induced with 1 mM IPTG for protein expression overnight (~16 hours) at 18°C. The cells were harvested by centrifugation at 6000 rpm for 20 min. The cells were resuspended in lysis buffer (50 mM Tris, 500 mM NaCl, 10% glycerol, pH 8 at 25°C) and lysed by sonication. Cell lysates were centrifuged for 1 hr at 13,000 rpm, and then the supernatant was loaded on a Ni2+‐NTA Sepharose column. The bound protein of interest was eluted using elution buffer containing 300 mM imidazole (lysis buffer +300 mM imidazole). Fractions containing protein of interest were concentrated, and the protein was further purified by cation exchange chromatography followed by size exclusion chromatography (SEC) using an S75 column (GE). The final purity of the sample was ascertained by running the samples on a SDS–PAGE. The final protein sample was prepared in a 20 mM sodium phosphate buffer (pH 6) containing 0.01% sodium azide for NMR and ITC experiments. The BAF250a ARID was not purified as part of this study.
4.2. Preparations of dsDNA for ITC and NMR titrations
The DNA used in this study was commercially synthesized and purified (Sigma). Table 1 shows all the double‐stranded DNAs used in this study. The complementary DNA strands were dissolved in the NMR/ITC buffer and heated at 95°C for 3 min, followed by snap cooled on ice.
4.3. NMR data collection and processing
For NMR experiments, a uniformly 15N, 13C labeled ARID was concentrated to desired concentrations (0.1 to 0.6 mM). NMR data were collected using a 600 MHz spectrometer (Agilent) with a cryogenic triple‐resonance probe. Initially, 1D 1H and 2D 1H‐15N HSQC spectra of the BAF250b ARID were recorded. Well‐dispersed cross‐peaks of uniform intensities (for most cross‐peaks) indicated that protein is well folded in solution. For the resonance assignment of the backbone and side‐chain atoms, triple resonance experiments: HNCACB, CBCA(CO)NH, HNCO and HN(CA)CO, HBHA(CO)NH, H(CCO)NH, and CC(CO)NH were acquired. 39 The spectra were processed using NMRPipe 46 and analyzed using NMRFAM‐ SPARKY. 47
The 1H–15N heteronuclear NOE experiments were recorded on a 15N labeled BAF250b ARID sample in an interleaved fashion, with and without 1H saturation for 4 s. The ratio of the peak intensities in the spectra recorded with and without 1H saturation for each residue was calculated to determine the heteronuclear NOE value for each residue of the protein.
4.4. Secondary structure determination of BAF250b and BAF250a ARID using CSI 3.0 webserver
NMR chemical shift based, chemical shift indexing to determine the secondary structures of BAF250a and BAF250b ARIDs was performed using CSI 3.0 webserver. 41 The backbone chemical shifts of BAF250a ARID were taken from the data deposited in BMRB (BMRB accession code 5748). 48 The backbone chemical shifts of BAF250b ARID were determined as part of this work (BMRB accession code 51010).
4.5. Molecular dynamic (MD) simulation of BAF250b ARID
The available crystal structure of BAF250b ARID (PDB ID 2CXY) was used as the starting structure for simulation. MD simulation protocol was applied to PDB 2CXY using the latest GROMACS 4.6.5 simulation package. 43 GROMOS96 53a6 united‐atom force field and simple point charge (SPC) water model were used to model the intra‐molecular protein interactions and the intermolecular interactions between the protein and solvent molecules. Initial energy minimization and equilibration steps were followed by a simulation with pressure coupling at 1 atm. During this phase, the velocities were reassigned according to a Maxwell's distribution at 300 K. Finally, the production phase of MD simulation was run keeping the temperature, pressure, and number of molecules of the ensemble invariant. Production phase using 0.002 ps time step was continued up to 50 ns. All the subsequent analyses that include root mean square deviation (RMSD), root mean square fluctuation (RMSF), and time evolution of the secondary structure evolution (SSE) were performed using different programs of the GROMACS package over the production run.
4.6. NMR titration experiments
Uniformly 15N labeled BAF250b ARID samples were titrated with different Mrf2‐15 and Dri‐15 dsDNA sequences, and a 2D 1H ‐ 15N HSQC spectra were recorded at each step of titration. We observed the initial disappearance of cross‐peaks in the 2D 1H − 15N HSQC spectra of BAF250b ARID. However, most of the cross‐peaks reappeared subsequently at 1:1 and higher ARID: DNA molar ratio at distinct chemical shift positions. This suggested that the BAF250b ARID interacts with DNA on an intermediate to slow NMR time scale. All titrations were carried out on a Bruker 700 MHz NMR spectrometer equipped with a room temperature probe.
The raw NMR data were processed using the Bruker program Topspin 3.1, and spectra were analyzed using NMRFAM‐SPARKY. 47 The magnitudes of the induced chemical shift perturbations (CSP) at a saturating 1:2 protein: DNA molar ratio was calculated using the standard formula,
where δH and δN denote the chemical shift changes (in parts per million) in the 1H and 15N dimensions, respectively.
4.7. Isothermal titration calorimetry (ITC) of BAF250b ARID – DNA Interactions
ITC experiments were performed using the VP‐ITC instrument (MicroCal). Protein and DNAs were prepared in the same buffer consisting of 20 mM sodium phosphate buffer (pH 6). All the samples were thoroughly degassed before the experiment. For the titration experiments, the sample cell was filled with 10–20 μM DNA and titrated with 200–400 μM BAF250b ARID solution. Thirty injections of the titrant were performed with an interval of 180 s between each injection. The heat of dilution was subtracted from the integrated heat data, and the data was then fitted for the one‐site binding model using ORIGIN software provided by the vendor (MicroCal). All the parameters were kept floating during the data fitting. Experiments were repeated 2–3 times for consistency and reproducibility.
4.8. Protein–DNA molecular docking using HADDOCK
The 3D coordinates of BAF250b ARID (PDB ID 2CXY) were downloaded from the PDB website. The molecule in the PDB contains residues 1,041–1,154 (114 amino acids) of BAF250b. BAF250b ARID was docked with the two DNAs, Dri‐15 and Mrf2‐15 DNAs, that were used to determine the structure of Dri ARID/DNA complex (PDB ID 1KQQ) and Mrf2 ARID/DNA complex (PDB ID 2OEH) structures, respectively. 3D models of Dri‐15 DNA and Mrf2‐15 DNA were generated using 3D‐DART (3DNA‐Driven DNA Analysis and Rebuilding Tool) server and used in docking experiments. 49
The data‐driven docking of ARID – DNA complexes was performed using HADDOCK (high ambiguity driven protein–protein docking) webserver (easy interface). 44 HADDOCK is an information‐driven, flexible docking approach for modeling biomolecular complexes. The residues that showed CSPs above the average perturbations were considered as perturbed residues upon DNA binding. The “active residues” were defined as the residues that showed CSPs greater than average plus one standard deviation. Using these criteria, in the case of BAF250b ARID/Dri‐15 DNA docking, the ‘active residues’ consisted of E1042, A1079, G1081, K1082, K1083, A1101, K1105, N1106, W1109, E1111, L1112, A1113, N1115, V1118, T1120, S1126, S1127, K1130, Y1132, Y1135, whereas residues: K1043, K1046, V1047, N1052, S1072, S1075, S1076, L1077, V1080, L1090, L1100, N1104, K1108, L1116, S1122, A1124, A1125, Q1131, I1133, Q1134 were selected as the “passive residues.” Similarly, in the case of BAF250b ARID/Mrf2‐15 DNA docking following residues were classified as ‘active residues’: E1042, A1079, G1081, K1082, K1083, A1101, K1105, N1106, K1108, W1109, E1111, L1112, A1113, N1115, T1120, S1126, S1127, K1130, Q1131, Y1132, Y1135. Residues with more than average CSP: K1043, K1046, V1047, N1052, V1060, S1076, L1077, V1080, L1090, V1103, N1104, L1116, V1118, A1124, A1125, I1133, Q1134, A1138, E1140 were defined as the ‘passive residues’.
All DNA nucleotides were classified as active residues and the program was let to classify them further as active or passive ambiguous interaction restraints (AIRs).
HADDOCK algorithm converts the ‘active’ and ‘passive’ residues to AIRs that are used for data‐driven docking. The topology of the molecules that are to be docked is generated automatically. Docking consists of three stages: rigid body energy minimization, semi‐flexible refinement in torsion angle space, and a final refinement in explicit solvent. Scoring and ranking are done after each stage, and the best structures are kept for the next stage. Scoring is a weighted sum of van der Waals, electrostatic, desolvation, and restraint violation energies with the buried surface area. The top cluster with the highest number of structures where the ARID bound DNA in the major groove was selected for further analysis. The docked structures of BAF250b ARID/DNA models were viewed using PyMOL (DeLano Scientific).
DATABASE DEPOSITION
The backbone resonance assignment of BAF250b ARID has been deposited to Biological Magnetic Resonance Data Bank (BMRB) under the accession code 51010.
CONFLICT OF INTEREST
The authors declare that there are no competing interests associated with the manuscript.
AUTHOR CONTRIBUTIONS
Malyasree Giri: Data curation (equal); formal analysis (equal); investigation (equal); methodology (equal); resources (equal); writing – original draft (equal); writing – review and editing (equal). Parul Gupta: Methodology (supporting); resources (supporting). Aditi Maulik: Methodology (supporting); resources (supporting). Magaly Gracias: Resources (supporting). Mahavir Singh: Conceptualization (equal); formal analysis (equal); funding acquisition (equal); project administration (equal); supervision (equal); writing – original draft (equal); writing – review and editing (equal).
Supporting information
Appendix S1
ACKNOWLEDGEMENTS
Authors acknowledge the Department of Science and Technology (DST) and the Department of Biotechnology (DBT), India for the NMR and ITC facilities at the Indian Institute of Science. Authors acknowledge funding for infrastructural support from the following programs of the Government of India: DST‐FIST, University Grant Commission – Center of Advanced Studies (UGC‐CAS), and the DBT‐IISc partnership program. M.S. is a recipient of the Ramalingaswami Fellowship (BT/RLF/Re‐entry/23/2013) from DBT, India, and STAR award (award number STR/2021/000015) from the Science and Engineering Research Board (SERB), DST, India. A. M. acknowledges Early Career Fellowship from Wellcome Trust/ DBT India Alliance (grant number IA/E/15/1/502321).
Giri M, Gupta P, Maulik A, Gracias M, Singh M. Structure and DNA binding analysis of AT‐rich interaction domain present in human BAF‐B specific subunit BAF250b . Protein Science. 2022;31(5):e4294. 10.1002/pro.4294
Present address Magaly Gracias, National Institute of Oceanography, CSIR (CSIR‐NIO), Goa, India
Funding information M.S. acknowledges the financial support received from the Department of Biotechnology (DBT) (grant number BT/PR15829/BRB/10/1469/2015); IISc‐DBT partnership program and Science and Engineering Research Board (SERB), Department of Science and Technology, India, grant number: STR/2021/000015
Review Editor: Hideo Akutsu
REFERENCES
- 1. Mathur R, Roberts CWM. SWI/SNF (BAF) complexes: Guardians of the epigenome. Ann Rev Cancer Biol. 2018;2:413–427. [Google Scholar]
- 2. Bao Y, Shen X. SnapShot: Chromatin remodeling complexes. Cell. 2007;129:632–632, 632.e2. [DOI] [PubMed] [Google Scholar]
- 3. El Hadidy N, Uversky VN. Intrinsic disorder of the BAF complex: Roles in chromatin remodeling and disease development. Int J Mol Sci. 2019;20:5260. [DOI] [PMC free article] [PubMed] [Google Scholar]
- 4. Inoue H, Furukawa T, Giannakopoulos S, Zhou S, King DS, Tanese N. Largest subunits of the human SWI/SNF chromatin‐remodeling complex promote transcriptional activation by steroid hormone receptors. J Biol Chem. 2002;277:41674–41685. [DOI] [PubMed] [Google Scholar]
- 5. Wang X, Nagl NG, Wilsker D, et al. Two related ARID family proteins are alternative subunits of human SWI/SNF complexes. Biochem J. 2004;383:319–325. [DOI] [PMC free article] [PubMed] [Google Scholar]
- 6. Kasten, M.M. , Clapier, C.R. and Cairns, B.R. (2011) SnapShot: Chromatin remodeling: SWI/SNF. Cell, 144, 310 e311, 310, 310.e1. [DOI] [PubMed] [Google Scholar]
- 7. Wilsker D, Patsialou A, Dallas PB, Moran E. ARID proteins: A diverse family of DNA binding proteins implicated in the control of cell growth, differentiation, and development. Cell Growth Diff. 2002;13:95–106. [PubMed] [Google Scholar]
- 8. Wilsker D, Probst L, Wain HM, Maltais L, Tucker PW, Moran E. Nomenclature of the ARID family of DNA‐binding proteins. Genomics. 2005;86:242–251. [DOI] [PubMed] [Google Scholar]
- 9. Zheng P, Patel B, McMenamin M, et al. Expression of genes encoding chromatin regulatory factors in developing rhesus monkey oocytes and preimplantation stage embryos: Possible roles in genome activation. Biol Reprod. 2004;70:1419–1427. [DOI] [PubMed] [Google Scholar]
- 10. Helming KC, Wang X, Roberts CWM. Vulnerabilities of mutant SWI/SNF complexes in cancer. Cancer Cell. 2014;26:309–317. [DOI] [PMC free article] [PubMed] [Google Scholar]
- 11. Shain AH, Pollack JR. The spectrum of SWI/SNF mutations, ubiquitous in human cancers. PLoS ONE. 2013;8:e55119. [DOI] [PMC free article] [PubMed] [Google Scholar]
- 12. Helming KC, Wang X, Wilson BG, et al. ARID1B is a specific vulnerability in ARID1A‐mutant cancers. Nat Med. 2014;20:251–254. [DOI] [PMC free article] [PubMed] [Google Scholar]
- 13. Zinzalla G. A new way forward in cancer drug discovery: Inhibiting the SWI/SNF chromatin Remodelling complex. Chembiochem. 2016;17:677–682. [DOI] [PubMed] [Google Scholar]
- 14. Deogharkar A, Singh SV, Bharambe HS, et al. Downregulation of ARID1B, a tumor suppressor in the WNT subgroup medulloblastoma, activates multiple oncogenic signaling pathways. Hum Mol Genet. 2021;30:1721–1733. [DOI] [PubMed] [Google Scholar]
- 15. Khursheed M, Kolla JN, Kotapalli V, et al. ARID1B, a member of the human SWI/SNF chromatin remodeling complex, exhibits tumour‐suppressor activities in pancreatic cancer cell lines. Br J Cancer. 2013;108:2056–2062. [DOI] [PMC free article] [PubMed] [Google Scholar]
- 16. Odnokoz O, Wavelet‐Vermuse C, Hophan SL, Bulun S, Wan Y. ARID1 proteins: From transcriptional and post‐translational regulation to carcinogenesis and potential therapeutics. Epigenom. 2021;13:809–823. [DOI] [PMC free article] [PubMed] [Google Scholar]
- 17. Sandhya S, Maulik A, Giri M, Singh M. Domain architecture of BAF250a reveals the ARID and ARM‐repeat domains with implication in function and assembly of the BAF remodeling complex. PLoS ONE. 2018;13:e0205267. [DOI] [PMC free article] [PubMed] [Google Scholar]
- 18. Varga J, Kube M, Luck K, Schick S. The BAF chromatin remodeling complexes: Structure, function, and synthetic lethalities. Biochem Soc Trans. 2021;49:1489–1503. [DOI] [PubMed] [Google Scholar]
- 19. Wagner FR, Dienemann C, Wang H, et al. Structure of SWI/SNF chromatin remodeller RSC bound to a nucleosome. Nature. 2020;579:448–451. [DOI] [PMC free article] [PubMed] [Google Scholar]
- 20. Finn RD, Coggill P, Eberhardt RY, et al. The Pfam protein families database: Towards a more sustainable future. Nucleic Acids Res. 2016;44:D279–D285. [DOI] [PMC free article] [PubMed] [Google Scholar]
- 21. Patsialou A, Wilsker D, Moran E. DNA‐binding properties of ARID family proteins. Nucleic Acids Res. 2005;33:66–80. [DOI] [PMC free article] [PubMed] [Google Scholar]
- 22. He S, Wu Z, Tian Y, et al. Structure of nucleosome‐bound human BAF complex. Science. 2020;367:875–881. [DOI] [PubMed] [Google Scholar]
- 23. Givaty O, Levy Y. Protein sliding along DNA: Dynamics and structural characterization. J Mol Biol. 2009;385:1087–1097. [DOI] [PubMed] [Google Scholar]
- 24. Kortschak RD, Tucker PW, Saint R. ARID proteins come in from the desert. Trends Biochem Sci. 2000;25:294–299. [DOI] [PubMed] [Google Scholar]
- 25. Liu G, Huang YJ, Xiao R, Wang D, Acton TB, Montelione GT. Solution NMR structure of the ARID domain of human AT‐rich interactive domain‐containing protein 3A: A human cancer protein interaction network target. Proteins. 2010;78:2170–2175. [DOI] [PMC free article] [PubMed] [Google Scholar]
- 26. Chandler RL, Brennan J, Schisler JC, Serber D, Patterson C, Magnuson T. ARID1a‐DNA interactions are required for promoter occupancy by SWI/SNF. Mol Cell Biol. 2013;33:265–280. [DOI] [PMC free article] [PubMed] [Google Scholar]
- 27. Whitson RH, Huang T, Itakura K. The novel Mrf‐2 DNA‐binding domain recognizes a five‐base core sequence through major and minor‐groove contacts. Biochem Biophys Res Commun. 1999;258:326–331. [DOI] [PubMed] [Google Scholar]
- 28. Gregory SL, Kortschak RD, Kalionis B, Saint R. Characterization of the dead ringer gene identifies a novel, highly conserved family of sequence‐specific DNA‐binding proteins. Mol Cell Biol. 1996;16:792–799. [DOI] [PMC free article] [PubMed] [Google Scholar]
- 29. Kim S, Zhang Z, Upchurch S, Isern N, Chen Y. Structure and DNA‐binding sites of the SWI1 AT‐rich interaction domain (ARID) suggest determinants for sequence‐specific DNA recognition. J Biol Chem. 2004;279:16670–16676. [DOI] [PubMed] [Google Scholar]
- 30. Wang T, Zhang J, Zhang X, Tu X. Solution structure of SWI1 AT‐rich interaction domain from Saccharomyces cerevisiae and its nonspecific binding to DNA. Proteins. 2012;80:1911–1917. [DOI] [PubMed] [Google Scholar]
- 31. Iwahara J, Iwahara M, Daughdrill GW, Ford J, Clubb RT. The structure of the dead ringer‐DNA complex reveals how AT‐rich interaction domains (ARIDs) recognize DNA. EMBO J. 2002;21:1197–1209. [DOI] [PMC free article] [PubMed] [Google Scholar]
- 32. Cai S, Zhu L, Zhang Z, Chen Y. Determination of the three‐dimensional structure of the Mrf2‐DNA complex using paramagnetic spin labeling. Biochemistry. 2007;46:4943–4950. [DOI] [PMC free article] [PubMed] [Google Scholar]
- 33. Zhu L, Hu J, Lin D, Whitson R, Itakura K, Chen Y. Dynamics of the Mrf‐2 DNA‐binding domain free and in complex with DNA. Biochemistry. 2001;40:9142–9150. [DOI] [PubMed] [Google Scholar]
- 34. Wilsker D, Patsialou A, Zumbrun SD, et al. The DNA‐binding properties of the ARID‐containing subunits of yeast and mammalian SWI/SNF complexes. Nucleic Acids Res. 2004;32:1345–1353. [DOI] [PMC free article] [PubMed] [Google Scholar]
- 35. Maulik A, Giri M, Singh M. Molecular determinants of complex formation between DNA and the AT‐rich interaction domain of BAF250a. FEBS Lett. 2019;593:2716–2729. [DOI] [PubMed] [Google Scholar]
- 36. Giri M, Maulik A, Singh M. Signatures of specific DNA binding by the AT‐rich interaction domain of BAF250a. Biochemistry. 2020;59:100–113. [DOI] [PubMed] [Google Scholar]
- 37. Gajiwala KS, Burley SK. Winged helix proteins. Curr Opin Struct Biol. 2000;10:110–116. [DOI] [PubMed] [Google Scholar]
- 38. Invernizzi G, Tiberti M, Lambrughi M, Lindorff‐Larsen K, Papaleo E. Communication routes in ARID domains between distal residues in helix 5 and the DNA‐binding loops. PLoS Comput Biol. 2014;10:e1003744. [DOI] [PMC free article] [PubMed] [Google Scholar]
- 39. Cavanagh J, Fairbrother WJ, Skelton NJ, Rance M, Palmer IAG. Protein NMR spectroscopy: Principles and practice. Oxford, UK: Elsevier Science, 2006. [Google Scholar]
- 40. Eghbalnia HR, Wang L, Bahrami A, Assadi A, Markley JL. Protein energetic conformational analysis from NMR chemical shifts (PECAN) and its use in determining secondary structural elements. J Biomol NMR. 2005;32:71–81. [DOI] [PubMed] [Google Scholar]
- 41. Hafsa NE, Arndt D, Wishart DS. CSI 3.0: A web server for identifying secondary and super‐secondary structure in proteins using NMR chemical shifts. Nucleic Acids Res. 2015;43:W370–W377. [DOI] [PMC free article] [PubMed] [Google Scholar]
- 42. Kharchenko V, Nowakowski M, Jaremko M, Ejchart A, Jaremko Ł. Dynamic 15N{1H} NOE measurements: A tool for studying protein dynamics. J Biomol NMR. 2020;74:707–716. [DOI] [PMC free article] [PubMed] [Google Scholar]
- 43. Pronk S, Pall S, Schulz R, et al. GROMACS 4.5: A high‐throughput and highly parallel open source molecular simulation toolkit. Bioinformatics. 2013;29:845–854. [DOI] [PMC free article] [PubMed] [Google Scholar]
- 44. van Zundert GCP, Rodrigues J, Trellet M, et al. The HADDOCK2.2 web server: User‐friendly integrative modeling of biomolecular complexes. J Mol Biol. 2016;428:720–725. [DOI] [PubMed] [Google Scholar]
- 45. Murphy FVt, Churchill ME. Nonsequence‐specific DNA recognition: A structural perspective. Structure. 2000;8:R83–R89. [DOI] [PubMed] [Google Scholar]
- 46. Delaglio F, Grzesiek S, Vuister GW, Zhu G, Pfeifer J, Bax A. NMRPipe: A multidimensional spectral processing system based on UNIX pipes. J Biomol NMR. 1995;6:277–293. [DOI] [PubMed] [Google Scholar]
- 47. Lee W, Tonelli M, Markley JL. NMRFAM‐SPARKY: Enhanced software for biomolecular NMR spectroscopy. Bioinformatics. 2015;31:1325–1327. [DOI] [PMC free article] [PubMed] [Google Scholar]
- 48. Kim S, Zhu L, Yu B, Chen Y. Assignment of 1H, 13C and 15N resonances of the ARID domain of P270. J Biomol NMR. 2003;27:277–278. [DOI] [PubMed] [Google Scholar]
- 49. van Dijk M, Bonvin AM. 3D‐DART: a DNA structure modelling server. Nucleic Acids Res. 2009;37:W235–W239. [DOI] [PMC free article] [PubMed] [Google Scholar]
Associated Data
This section collects any data citations, data availability statements, or supplementary materials included in this article.
Supplementary Materials
Appendix S1