Abstract
Hsp90 is a conserved and essential molecular chaperone responsible for the folding and activation of hundreds of ‘client’ proteins1-3. The glucocorticoid receptor (GR) is a model client that constantly depends on Hsp90 for activity4-9. Previously, we revealed GR ligand binding is inhibited by Hsp70 and restored by Hsp90, aided by the cochaperone p2310. However, a molecular understanding of the chaperone-mediated remodeling that occurs between the inactive Hsp70:Hsp90 ‘client-loading complex’ and an activated Hsp90:p23 ‘client-maturation complex’ is lacking for GR, or any client. Here, we present a 2.56Å cryo-EM structure of the GR-maturation complex (GR:Hsp90:p23), revealing that the GR ligand-binding domain is, surprisingly, restored to a folded, ligand-bound conformation, while simultaneously threaded through the Hsp90 lumen. Also, unexpectedly, p23 directly stabilizes native GR using a previously unappreciated C-terminal helix, resulting in enhanced ligand-binding. This is the highest resolution Hsp90 structure to date and the first atomic resolution structure of a client bound to Hsp90 in a native conformation, sharply contrasting with the unfolded kinase:Hsp90 structure11. Thus, aided by direct cochaperone:client interactions, Hsp90 can directly dictate client-specific folding outcomes. Together with the GR-loading complex structure12, we present the molecular mechanism of chaperone-mediated GR remodeling, establishing the first complete chaperone cycle for any client.
Hsp90 is required for the functional maturation of ~10% of the eukaryotic proteome, including signaling proteins such as GR, a steroid hormone receptor (SHR)1,3,13. We previously uncovered the biochemical basis for GR’s Hsp90 dependence using in vitro reconstitution starting with an active GR ligand-binding domain (hereafter GR, for simplicity)10. We demonstrated that GR ligand binding is regulated by a cycle of GR:chaperone complexes in which GR is first inhibited by Hsp70, then loaded onto Hsp90:Hop (Hsp70/Hsp90 organizing protein) forming an inactive GR:Hsp90:Hsp70:Hop loading complex12. Upon ATP hydrolysis on Hsp90, Hsp70 and Hop are released, and p23 is incorporated to form an active GR:Hsp90:p23 maturation complex, restoring GR ligand binding with enhanced affinity. Progression through this cycle is coordinated by the ATPase activities of Hsp70 and Hsp90, enabling large conformational rearrangements2,14. Particularly, Hsp90 functions as a constitutive dimer that undergoes an open-to-closed transition upon ATP binding and this conformational cycle is further regulated by cochaperones15. The cochaperone p23 specifically binds and stabilizes the closed Hsp90 conformation16 and is required for full reactivation of GR ligand binding in vitro10 and proper GR function in vivo17.
While the Hsp90/Hsp70 chaperone systems are fundamental in maintaining protein homeostasis and regulating numerous crucial cellular functions1, the absence of client:chaperone structures has precluded a mechanistic understanding of the remodeling process for GR, or any client. The kinase:Hsp90 structure11 first revealed how Hsp90 can stabilize an inactive client, but provided no insights to explain how Hsp90 can reactivate a client, such as GR. Here, we report the high-resolution cryo-EM structure of the GR-maturation complex, providing a long-awaited molecular mechanism for chaperone-mediated client remodeling and activation.
Structure determination
The GR-maturation complex was prepared through in vitro reconstitution of the GR chaperone cycle, where the MBP (maltose-binding protein)-GR ligand-binding domain (LBD) was incubated with Hsp70, Hsp40, Hop, Hsp90, and p23, allowing GR to progress through the chaperone cycle to reach the maturation complex (Materials and Methods, Extended Data Fig. 1a-e). A 2.56Å cryo-EM reconstruction of the maturation complex was obtained (Fig. 1a; Extended Data Fig. 2a,b; Supplementary Table 1) using RELION18 and atomic models were built in Rosetta19 starting from previously published atomic structures. The structure reveals a fully closed, nucleotide-bound Hsp90 dimer (Hsp90A and B) (Extended Data Fig. 2c) complexed with a single GR and a single p23, which occupy the same side of Hsp90 (Fig. 1a,b).
Figure 1 ∣. Architecture of the GR-maturation complex.
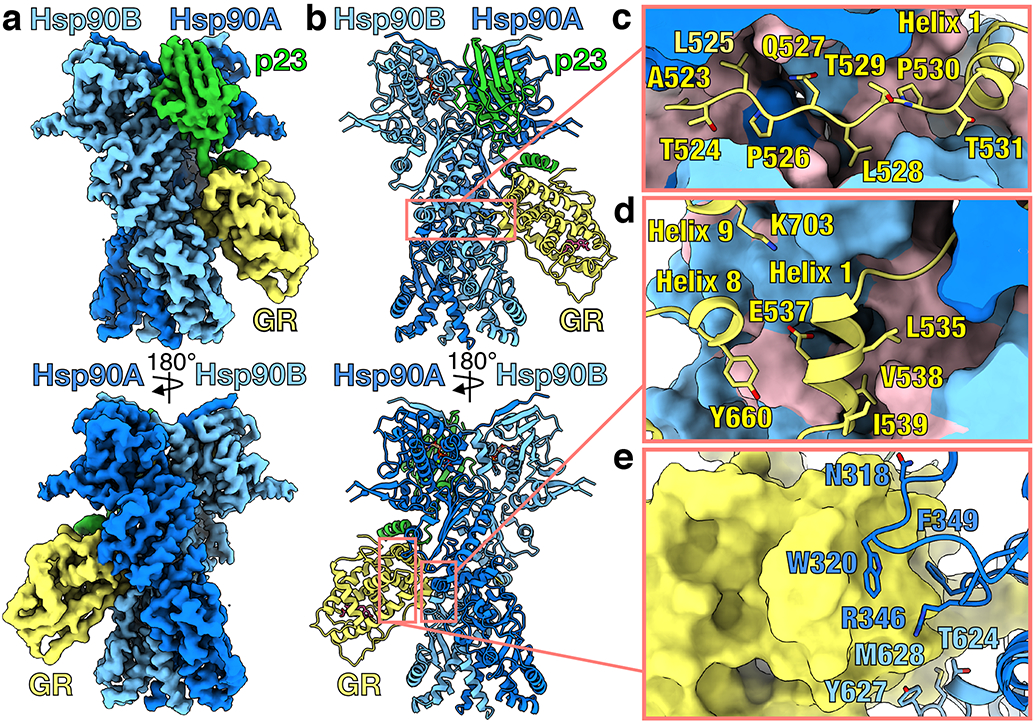
a, Composite cryo-EM map of the GR-maturation complex. Hsp90A (dark blue), Hsp90B (light blue), GR (yellow), p23 (green). Color scheme is maintained throughout. b, Atomic model in cartoon representation. c, Interface 1 of the Hsp90:GR interaction depicting GRpre-Helix 1 (GR523-531) threading through the Hsp90 lumen. Hsp90A/B are in surface representation with hydrophobic residues colored in pink. d, Interface 2 of the Hsp90:GR interaction depicting GRHelix 1 (GR532-539) packing against the entrance to the Hsp90 lumen. Hsp90A/B are in surface representation with hydrophobic residues colored in pink. e, Interface 3 of the Hsp90:GR interaction depicting residues on the Hsp90AMD loops (Hsp90AN318,W320,R346,F349) and Hsp90Bamphi-α (Hsp90BT624,Y627,M628) packing against GR (surface representation).
Hsp90 stabilizes GR in an active state
GR and Hsp90 have three major interfaces (Fig. 1c-e): (1) Hsp90 lumen:GRpre-Helix 1; (2) Hsp90MD/CTD:GRHelix 1, and (3) Hsp90MD/CTD:GRHelices 3, 4, and 9. In the first interface, the N-terminal GRpre-Helix 1 (GR523-531) is threaded through the closed Hsp90 lumen (~735Å2 buried surface area (BSA))(Fig. 1c). The Hsp90 lumen provides a mostly hydrophobic ‘tunnel’ that captures GRpre-Helix 1 (Fig. 1c; Extended Data Fig. 3a). Specifically, two residues (GRL525,L528) occupy hydrophobic binding pockets within the Hsp90 lumen. The interaction is further stabilized by multiple hydrogen bonds from Hsp90 to the backbone and side chains of GRpre-Helix 1 (Extended Data Fig. 3b). Interface 2 is mainly comprised of the short GRHelix 1 (GR532-539) packing up against the amphipathic helical hairpin (Hsp90amphi-α) in the C-terminal domain of Hsp90B (Hsp90BCTD) and GRHelices 8 and 9 interacting with Hsp90BMD/CTD (~488Å2 BSA)(Fig. 1d, Extended Data Fig. 3c). In interface 3, the Hsp90Bamphi-α packs against GRHelix 3 and the conserved, solvent exposed hydrophobic residues Hsp90W320,F349, located in the middle domain of Hsp90A (Hsp90AMD), make contact with GRHelices 4 and 9 (~467Å2 BSA)(Fig. 1e, Extended Data Fig. 3d). Notably, Hsp90W320,F349 also make contact with GR in the loading complex12 and Hsp90W320 is critical for client activation in vivo20-22.
Surprisingly, in the maturation complex, despite being bound to Hsp90, GR adopts an active, folded conformation (Cα RMSD of 1.24Å to crystal structure Protein Data Bank (PDB) ID 1M2Z23). Specifically, GRHelix 12, a dynamic motif responsive to ligand binding, is in the agonist-bound position, as in the crystal structure (PDB ID 1M2Z) (Extended Data Fig. 4a). Unlike the crystal structure, GRHelix 12 is not stabilized by a co-activator peptide, although co-activator peptide binding would be sterically allowed (Extended Data Fig. 4b). Unexpectedly, the density also revealed that GR is ligand-bound (Extended Data Fig. 4c). The only ligand source was the initial GR purification with agonists, after which GR was extensively dialyzed, removing the majority of ligand10. During preparation of the maturation complex, GR likely rebound residual ligand and despite multiple washes, the ligand remained bound, suggesting a high affinity and slow ligand off-rate from the maturation complex. Based on the ligand density and positions of GRY735, the bound ligand is likely dexamethasone (Extended Data Fig. 4c). The native, ligand-bound GR LBD is known to dimerize for function23; however, in the GR-maturation complex, while the putative dimerization interface is solvent accessible, the binding of a second GR would clash with the Hsp90BCTD (Extended Data Fig. 4d).
p23 interacts directly with GR
The Hsp90:p23 interface is comparable to the crystal structure of the yeast Hsp90:p23 complex (PDB ID 2CG9)16, where p23 makes extensive contacts with the N-terminal domains of Hsp90 (Hsp90NTDs) to stabilize the Hsp90 closed state (~1274Å2 BSA)(Extended Data Fig. 5a-d). Only one p23 is bound to the Hsp90 dimer, consistent with a previous report8, although a 2-fold excess of p23 was added during complex preparation and two p23 molecules are in the yeast Hsp90:p23 structure16. The slight asymmetry observed here between the Hsp90NTD dimer interfaces (Extended Data Fig. 5e) combined with the avidity afforded by simultaneous interactions with Hsp90 and GR likely provides a molecular explanation.
Unexpectedly, p23 also makes direct and extensive contacts with GR (~702Å2 BSA) through the early part (p23112-133) of its ~58 residue C-terminal tail (p23103-160), while the following 27 tail residues (p23134-160) were not visible. As observed in the yeast Hsp90:p23 crystal structure (PDB ID 2CG9), the beginning of the p23 tail (p23F103,N104,W106) interacts with the Hsp90BNTD (Extended Data Fig. 5c). The following loop (p23108-118) forms polar interactions with both GR and Hsp90 (Fig. 2a,c). Although the tail was previously thought to be unstructured24, we found a 13-residue helix (p23119-131, p23tail-helix) bound to GR (Fig. 2a,c; Extended Data Fig. 6a,b). This newly identified p23tail-helix was also predicted by multiple state-of-the-art secondary structure prediction algorithms and AlphaFold v2.0 25 (Extended Data Fig. 6d). Furthermore, a peptide corresponding to this region (p23118-131) was previously found to have helical propensity26 and an interaction between p23117-127 and GR has been suggested27. In the GR maturation complex, the hydrophobic surface of the p23tail-helix packs against an exposed hydrophobic patch on the GR surface made by GRHelices 9 and 10 (Extended Data Fig. 6a,b). The p23tail-helix also contacts the C-terminal strand of GR (GRH775), potentially allosterically stabilizing the dynamic GRHelix 12 (GR750-767) in the agonist-bound position (Fig. 2c, Extended Data Fig. 6e).
Figure 2 ∣. p23tail-helix interactions and effect on GR ligand binding.
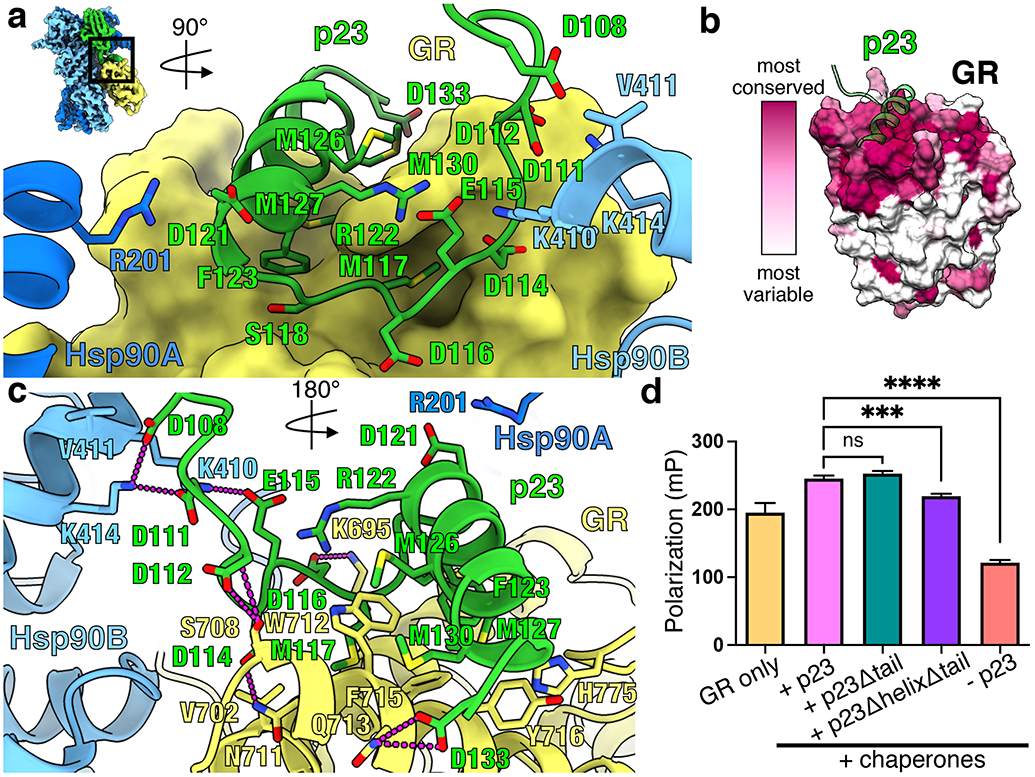
a, Interface between the p23tail-helix (green), GR (yellow, surface representation), Hsp90A (dark blue), and Hsp90B (light blue). The p23tail-helix (p23119-131) binds GR, while the preceding p23 loop (p23108-118) interacts with GR and Hsp90. b, GR protein sequence conservation mapped onto the GR surface colored from most variable (white) to most conserved residues (maroon). The p23tail-helix (green) is overlaid to indicate the p23:GR interface. c, Interface between the p23tail-helix, GR, and Hsp90 showing interacting side chains and hydrogen bonds (dashed pink lines). d, Equilibrium binding of 20nM fluorescent dexamethasone to 250nM GR with chaperones and p23 tail mutants measured by fluorescence polarization (mean±SD). n=3 biologically independent samples per condition (n=6 biologically independent samples for the GR only condition). See Extended Data Fig. 7b for data points. Significance was evaluated using a one-way ANOVA (F(3,8) = 636.2; p < 0.0001) with post-hoc Dunnett’s test (n.s. P ≥ 0.05; * P ≤ 0.05; ** P ≤ 0.01; *** P ≤ 0.001; **** P ≤ 0.0001). P-values: p(p23 vs. p23Δtail) = 0.1512, p(p23 vs. p23ΔhelixΔtail) = 0.0002, p(p23 vs. no p23) = <0.0001.
Notably, in both p23 and GR, residues involved in this novel p23:GR interface are conserved across vertebrates (Fig. 2b, Extended Data Fig. 6f). The GR hydrophobic patch at the p23:GR interface is also conserved across SHRs, which are thought to undergo similar regulation by Hsp90/Hsp70 (Extended Data Fig. 6c)5. Attesting to its importance beyond SHRs, the p23tail-helix motif is conserved in yeast, which lack SHRs (Extended Data Fig. 6f). Due to the high level of conservation of the p23tail-helix and the hydrophobic patch on SHRs, we reasoned other proteins may utilize a p23tail-helix -like motif to bind SHRs. Using ScanProsite28 to search the human proteome for a p23tail-helix -like motif (“FXXMMN”), remarkably, Nuclear Coactivator 3 (NCoA3/SRC-3), a canonical co-activator protein for SHRs, was among the top 10 hits. The identified NCoA3 motif (FNSMMNQM) aligns with the p23tail-helix sequence (FSEMMNNM) and contains the key conserved hydrophobic residues that interact with GR (Fig. 2a,c; Extended Data Fig. 6f). This suggests NCoA3 may use this newly identified motif to bind GR at the novel interface, in addition to the canonical NCoA3 LXXLL motif:SHRHelix 12 interface29.
The p23tail-helix potentiates GR
To quantitatively assess the importance of the p23:GR interface for the enhanced ligand binding in the in vitro chaperone cycle, we compared full length p23 to two p23 tail mutants: p231-133 (p23Δtail) and p231-112 (p23ΔhelixΔtail) (Extended Data Fig. 7a). In both mutants, critical Hsp90:p23 contacts were unperturbed. While p23Δtail had no significant effect on the chaperone-mediated enhancement of ligand binding, p23ΔhelixΔtail abolished the enhancement, reducing binding almost to GR alone levels (Fig. 2d, Extended Data Fig. 7b). Thus, the observed chaperone-mediated ligand-binding enhancement is dependent upon the p23tail-helix. Importantly, p23ΔhelixΔtail did not reduce the GR ligand-binding activity to the same extent as omitting p23, indicating the p23 core plays a distinct and critical role in stabilizing the closed Hsp90 conformation in the maturation complex. We also found p23 had no significant effect on GR ligand binding in vitro, independent of the chaperone cycle (Extended Data Fig. 7c), although p23 has general Hsp90-independent chaperoning properties24,30,31.
To assess the importance of the p23tail-helix in vivo, we tested the ability of human p23 and the p23 tail mutants to rescue yeast growth defects due to the absence of Sba1 (yeast p23) in a strain expressing a sensitizing yeast Hsp90 mutant (Hsc82I588A-M589A) (Extended Data Fig. 7d). At 37°C, in the absence of SBA1 (sba1), exogenous expression of full-length human p23 and p23Δtail rescued the sba1 growth defect and, in fact, exhibited enhanced viability compared to exogenous expression of Sba1. The enhanced viability is dependent on the p23tail-helix, as p23ΔhelixΔtail abolished this enhancement, indicating the p23tail-helix is functionally important in vivo.
We also tested whether the p23tail-helix is important for GR activity in vivo, given that p23 can substitute for Sba1 in yeast GR transactivation assays32,33. We measured GR activity with exogenous expression of p23, p23 tail mutants, or Sba1 (Extended Data Fig. 7e). All p23/Sba1 constructs showed equivalent expression levels (Extended Data Fig. 7f) and expression of p23 significantly enhanced GR activity relative to Sba1, consistent with a previous report32. However, both p23Δtail and p23ΔhelixΔtail significantly reduced GR activity equivalently compared to p23. The effect of deleting the unstructured part of the p23 tail (p23134-160) on GR activity in vivo may be related to p23-dependent regulation of GR functions downstream of ligand binding34, which may dominate any effect of the p23tail-helix on GR activation in vivo.
Hsp90 lumen density in the absence of GR
From the same GR:Hsp90:p23 dataset, we also obtained reconstructions of Hsp90:p23 (2.66Å resolution) (Extended Data Fig. 8a,b) and MBP:Hsp90:p23 (3.63Å resolution) (Extended Data Fig. 9a,b), which both contain Hsp90 lumen density (Extended Data Fig. 8c,d; 9d,e). In the MBP:Hsp90:p23 complex, one p23 with low occupancy is bound to Hsp90 on the opposite side of MBP. Notably, MBP is partially unfolded, as density for the two C-terminal helices is missing. The MBP C-terminal region likely threads through Hsp90, accounting for the lumen density. The MBP is also in an apo state, consistent with the unfolding of the last two helices, which form part of its binding pocket (Extended Data Fig. 9c).
Discussion
We present the first atomic resolution structure of a client bound to Hsp90 in a native folded conformation, as well as the highest resolution structure of full-length Hsp90 to date. In the maturation complex, GR simultaneously threads through the closed Hsp90 lumen and adopts a native, ligand-bound conformation that is extensively stabilized by both Hsp90 and the p23tail-helix. The active, native GR in our complex starkly contrasts with the only other structure of a closed Hsp90:client complex, which stabilizes an unfolded kinase client11. Both clients are threaded through the closed Hsp90 lumen, suggesting a universal binding mode for Hsp90 clients11,35 (Extended Data Fig. 10a,b). Although the overall Hsp90:client interactions are similar, the outcomes for folding and function of these two clients are opposing, demonstrating evolutionarily determined, client-specific conformational remodeling by Hsp90 (Extended Data Fig. 10c).
While previously thought to be a general cochaperone whose primary function is to stabilize closed Hsp90, our structure reveals that p23 also makes extensive contacts with GR through a previously unappreciated helix in the p23 tail. This p23tail-helix is necessary for the enhanced GR ligand-binding activity in vitro; thus, p23 not only serves as a cochaperone to stabilize the closure of Hsp90, but also directly contributes to client maturation. In support of this essential p23:GR interaction, the p23tail-helix and GR hydrophobic groove are well conserved, and a helix in the yeast p23 tail supports GR transactivation in vivo27. Furthermore, the hydrophobic groove is conserved across SHRs, suggesting that the p23tail-helix contributes to Hsp90-dependent chaperoning of all SHRs. Indeed, where examined, SHR activity has been dependent on p2317 and the progesterone receptor (PR) requires the p23 tail for chaperone-mediated ligand-binding activity30. Intriguingly, NCoA3 contains a p23tail-helix -like motif, suggesting other GR coregulators may utilize this novel helix motif to bind the hydrophobic groove on GR and compete with p23, potentially facilitating GR release. These findings support an emerging paradigm in which Hsp90 cochaperones make specific, direct contact with Hsp90 clients to aid in client recognition and function11,12.
Together with the structure of the GR-loading complex12, we provide for the first time, a complete picture of the chaperone cycle for any client (Fig. 3b-d). These two structures reveal how GR is remodeled from a partially unfolded conformation in the loading complex to an active, folded conformation in the maturation complex. In the loading complex, GRpre-Helix 1 is captured by Hsp70, GRHelix 1 is stabilized by Hop, and GRpost-Helix 1 is threaded through the semi-closed Hsp90 lumen. First, Hsp70 and Hop release from the loading complex, driven by Hsp90 ATP binding/hydrolysis10,12. Then, GRpre-Helix 1 can slide into the Hsp90 lumen, allowing GRHelix 1 to refold onto the GR core, thereby generating a ligand binding capable, native GR, stabilized by the p23tail-helix (Fig. 3b,c). During this transition, Hsp90 twists to the p23-stabilized closed conformation, likely facilitating client sliding and rearranging the client-binding site to fully enclose GRpre-Helix 1 (Fig. 3a,b). Given that GRHelix 1 is proposed to function as a lid over the ligand-binding pocket36, ligand likely binds during the loading complex to maturation complex transition, just as GRHelix 1 slides through the Hsp90 lumen to seal the ligand-binding pocket (Fig. 3c). The ligand-bound GR becomes protected from Hsp70 rebinding and re-inhibition once it is in the maturation complex, allowing protected nuclear translocation34,37,38.
Figure 3 ∣. Mechanism of GR activation by Hsp90.

a, Surface representation of the Hsp90 dimer in the GR-loading complex12 versus the GR-maturation complex, showing the Hsp90 conformational change. Hsp90A (dark blue), Hsp90B (light blue). b, Top view of the loading complex (left) with GRHelix 1 extended through the Hsp90 lumen. Top view of the maturation complex (right) with GRHelix 1 docked onto GR. Hsp70 (orange, transparent surface), Hop (pink, transparent surface), Hsp90A (dark blue, surface representation), Hsp90B (light blue, surface representation), GR (yellow), p23 (green, transparent surface). c, Schematic showing the conformational change of GRHelix 1 from the loading complex to the maturation complex. Boxes represent chaperone and co-chaperone binding sites along the GRHelix 1 region (H=hydrophobic interface, P=polar interface). The GRpre-Helix 1 strand is highlighted (tan). Color scheme maintained from (b). d, Schematic of the GR chaperone-dependent activation cycle. Ligand-bound, active GR (left) is aggregation prone under physiological conditions. GR ligand binding is inhibited by Hsp70. Inactive GR is loaded onto Hsp90, with Hop, to form the loading complex, where GRHelix 1 is extended through the Hsp90 lumen. Hsp70/Hop release and p23 binds to form the maturation complex, where GRHelix 1 is redocked back onto the body of GR and ligand binding is restored.
The proposed sliding mechanism may be a general theme for Hsp90’s client remodeling. Our two other reconstructions, Hsp90:p23 and MBP:Hsp90:p23, have density in the Hsp90 lumen, suggesting Hsp90 has bound regions in our construct other than GR. Given that GRHelix 1 slides through the Hsp90 lumen, it is possible that Hsp90 can act processively to remodel other client domains beyond the one initially engaged, potentially explaining the other reconstructions. The mechanism of GRHelix 1 sliding explains how Hsp90 can provide protected refolding of client domains as they exit the lumen to become directly stabilized by cochaperones. How eukaryotes overcome the folding challenges of large, multi-domain proteins remains unclear39. While here we show how GR sliding through Hsp90 regulates GR function, more generally, sliding could also ensure folding fidelity in multi-domain proteins by allowing domains to fold independently on either side of the lumen or allowing misfolded/cross-folded domains to be annealed.
Materials and Methods
Data analysis and figure preparation
Figures were created using UCSF Chimera v.1.14 40 and UCSF ChimeraX v0.94 41. GR ligand binding data was analyzed using Prism v.9.1.1 (GraphPad).
Protein expression and purification
Human Hsp90α, Hsp70 (Hsp70A1A), Hop, p23, p23Δtail (1-133), p23ΔhelixΔtail (1-112), and yeast Ydj1 (Hsp40) were expressed in the pET151 bacterial expression plasmid with a cleavable N-terminal, 6x-His tag. Human Bag-1 isoform 4 (116-345) was expressed in a pET28a vector with a cleavable N-terminal, 6x-His tag. Proteins were expressed and purified by the following procedure. Proteins were expressed in E. coli BL21 star (DE3) strain. Cells were grown in either LB or TB at 37°C until OD600 reached 0.6-0.8 and then induced with 0.5 mM IPTG overnight at 16°C. Cells were harvested and lysed in 50 mM Potassium Phosphate pH 8, 500 mM KCl, 10 mM imidazole pH 8, 10% glycerol, 6 mM βME, and Roche cOmplete, mini protease inhibitor cocktail using an EmulsiFlex-C3 (Avestin). Lysate was centrifuged and the soluble fraction was affinity purified by gravity column with Ni-NTA affinity resin (QIAGEN). The protein was eluted with 30 mM Tris pH 8, 50 mM KCl, 250 mM imidazole pH 8, and 6 mM βME. For Hsp90, Hsp70, and Ydj1, an extra wash step with 0.1% Tween20 and 2 mM ATP/MgCl2 was added to the Ni-NTA resin before eluting. The 6x-His tag was removed with TEV protease during the following overnight dialysis in 30 mM Tris pH 8, 50 mM KCl, and 6 mM βME. Cleaved protein was then loaded onto an ion exchange column, MonoQ 10/100 GL (GE Healthcare), with 30 mM Tris pH 8, 50 mM KCl, and 6 mM βME and eluted with a linear gradient of 50-500 mM KCl. Protein was further purified by size exclusion in 30 mM HEPES pH 7.5, 50 mM KCl, 10% glycerol, 1-2 mM DTT using a HiLoad 16/60 Superdex 200 (GE Healthcare) or Hi Load 16/60 Superdex 75 (GE Healthcare). For Hsp70, each peak from ion exchange was collected separately and purified by size exclusion in 30 mM HEPES pH 7.5, 100 mM KCl, 10% glycerol, 4 mM DTT, where only the monomeric peak was then collected. Protein was concentrated, flash frozen, and stored at −80°C.
GR LBD expression and purification
For GR, the ligand binding domain (LBD) (F602S) (520-777) was codon optimized and expressed in the pMAL-c3X derivative with an N-terminal cleavable 6x-His-MBP tag. GR LBD was expressed and purified as previously described10.
GR-maturation complex sample preparation
The GR chaperone cycle was reconstituted in vitro with purified components as previously described10. Buffer conditions were 30 mM HEPES pH 8, 50 mM KCl, 0.05% Tween20, and 2 mM TCEP. Proteins and reagents were added at the following concentration: 5 μM MBP-GR LBD, 2 μM Hsp40, 5 μM Hsp70, 5 μM Hop, 15 μM Hsp90, 15 μM p23, 5 mM ATP/MgCl2. This reaction was incubated at room temperature for 60 minutes, then 15 μM p23, 15 μM Bag-1, and 20 mM sodium molybdate (used to stabilize the closed conformation of Hsp9011,42,43, likely by acting as a γ-phosphate analog to stabilize the post-ATP hydrolysis transition state of Hsp90 (Extended Data Fig. 2c)) were added, and the reaction was incubated at room temperature for another 30 minutes. Following incubation, amylose resin (New England Biolabs) was added to the reactions in a 1:1 ratio and incubated at 4°C with nutation. Resin was then washed 4 times with wash buffer (30 mM HEPES pH 8, 50 mM KCl, 5 mM ATP/MgCl2, 0.05% Tween20, 2 mM TCEP, 20 mM sodium molybdate) and eluted with 50 mM maltose in elution buffer (30 mM HEPES pH 8, 50 mM KCl, 2 mM TCEP, 20 mM sodium molybdate). The elution was analyzed by SDS-PAGE (4-12% acrylamide gel) (Extended Data Fig. 1a). The elution was concentrated and purified by size exclusion using a Shodex KW-804 on an Ettan LC (GE Healthcare) and fractions were analyzed by SDS-PAGE (4-12% acrylamide gel) (Extended Data Fig. 1b,c). Fractions containing the full complex were concentrated to ~2 μM. 2.5 μL of sample was applied to glow-discharged QUANTIFOIL R1.2/1.3, 400-mesh, copper holey carbon grid (Quantifoil Micro Tools GmbH) and plunge-frozen in liquid ethane using a Vitrobot Mark IV (FEI) with a blotting time of 15 seconds, blotting force 3, at 10°C, and with 100% humidity.
Cryo-EM data acquisition
The images were collected on a FEI Titan Krios electron microscope (Thermo Fisher Scientific) operating at 300kV using a K3 direct electron camera (Gatan) and equipped with a Bioquantum energy filter (Gatan) set to a slit width of 20 eV (example micrograph Extended Data Fig. 1d). Images were recorded at a nominal magnification of 105,000×, corresponding to a physical pixel size of 0.835Å. A nominal defocus range of 0.8 μm −2.0 μm underfocus was used. A total exposure of 5.9 seconds was used with 0.05 second subframes (117 total frames). The total accumulated electron dose was 60 electrons/Å2 and 0.5128 electrons/Å2/frame. Data was acquired using SerialEM software v.3.8-beta44.
A small dataset on the GR-maturation complex was collected before the larger dataset described above. The smaller dataset was collected from the same GR-maturation complex sample preparation concentrated to 1.2 μM with grids prepared in a similar manner. Images were collected on a FEI Titan Krios electron microscope (Thermo Fisher Scientific) operating at 300kV using a K3 direct electron camera (Gatan). Images were recorded at a nominal magnification of 105,000×, corresponding to a physical pixel size of 0.835Å. A nominal defocus range of 0.8 μm −2.0 μm underfocus was used. A total exposure of 3.0 seconds was used with 0.0255 second subframes (118 total frames). Data was acquired using SerialEM software.
Cryo-EM data processing
The smaller dataset consisted of ~1500 dose-fractionated image stacks, which were motion corrected using UCSF MotionCor2 45 and analyzed with RELION v.3.0.8 18. Motion corrected images without dose weighting were used for contrast transfer function (CTF) estimation using CTFFIND v.4.1 46 and template-based particle picking was done with Gautomatch v.0.53 (http://www.mrc-lmb.cam.ac.uk/kzhang/) with the Hsp90:p23 crystal structure (PDB ID: 2CG9) as a reference to select a total of 718,080 particles. Multiple rounds of 3D classification were performed with 2CG9 as a low-pass-filtered (40 Å) initial model until a medium-resolution (~8 Å) GR:Hsp90:p23 reconstruction was obtained from 13,570 particles. This reconstruction was used as a reference for the larger dataset.
The larger dataset consisted of 5,608 dose-fractionated image stacks, which were motion corrected using UCSF MotionCor2 and analyzed with RELION v.3.0.8. Motion corrected images with dose weighting were used for contrast transfer function (CTF) estimation using CTFFIND v.4.1 and reference-free particle picking was done with RELION v.3.0.8 Laplacian-of-Gaussian auto-picking to select a total of 6,062,152 particles. The processing scheme is depicted in Extended Data Fig. 2a. An initial round of three-dimensional (3D) classification was performed without symmetry using a reference model from the previously collected smaller dataset (see above). The class with clearly recognizable Hsp90 density was used for a second round of 3D classification. In this second round, a class with only Hsp90:p23 density was obtained (454,385 particles). This class was refined after per-particle CTF refinement and beam-tilt correction in RELION to a nominal resolution of 2.66 Å. Particles from two other classes, which contained GR density, were combined (~1 million particles) for a third round of 3D classification. After the third round of 3D classification, particles from classes with the best GR density were then combined (~340,000 particles) and refined. To improve the resolution of GR and the p23tail-helix, the particles were further classified using focused classification with a mask including GR and the p23tail-helix. The best focused classes were combined (140,217 particles) and refined to a nominal resolution of 2.56 Å. Using the 2.56 Å reconstruction, per-particle CTF and beam-tilt were refined using RELION. Although the FSC showed slightly improvement over the pre-refined reconstruction at medium resolution range (5–10 Å), the nominal resolution at 0.143 FSC remained unchanged. Nevertheless, we used the CTF/beam-tilt refined particles for the following focused refinement on GR:p23tail-helix and for the resulting reconstructions used for model building. To further improve the resolution of GR and the p23tail-helix for model building, these regions were refined using focused refinement with a mask including GR and the p23tail-helix.
From the third round of 3D classification, particles from 3D classes with MBP density were combined (~650,000 particles) and refined. To improve the resolution of MBP, the particles were further classified using focused classification with a mask on MBP. The best focused 3D classes were combined (31,556 particles) and refined to a nominal resolution of 3.63 Å after per-particle CTF refinement and beam-tilt correction in RELION.
No ligand-free GR complexes were identified during image analysis, despite many rounds of focused classification using masks of different sizes on GR at various stages of data processing. Only classes with clear ligand density in the GR ligand binding pocket were obtained, suggesting ligand-free GR is either too dynamic or quickly released from the complex.
All final reconstructions were post-processed in RELION in which the nominal resolution was determined by the gold standard Fourier shell correlation (FSC) using the 0.143 criterion (Extended Data Fig. 2b). Maps were sharpened and filtered automatically as determined by RELION according to an estimated overall map B-factor and filtered to their estimated resolution. RELION was used to estimate the local resolution of each map (Extended Data Fig. 2a). For GR:Hsp90:p23, a composite map was generated by combining the overall refinement map with the GR:p23 tail focused refinement map using vop maximum in Chimera. Note that the composite map was only used for presentation in Fig. 1a, but not used in atomic model building or refinement.
Model building and refinement
For the GR-maturation complex atomic model, the dexamethasone-bound human GR crystal structure (PDB ID: 1M2Z) and the human p23 crystal structure (PDB ID: 1EJF) were used as a starting model for model building. A homolog model of human Hsp90α was derived from human Hsp90β from the Hsp90:Cdk4:Cdc37 cryo-EM structure (PDB ID: 5FWK) with the sequence alignment (86% sequence identity) obtained from HHpred server47 and this was also used as a starting model for model building (Supplementary Table 1). Models were refined using Rosetta v.3.11 throughout. Following the split map approach19 to prevent and monitor overfitting, the Rosetta iterative backbone rebuilding procedure was used to refine models against one of the half maps obtained from RELION, with the other half map only used for validations. The structurally uncharacterized p23tail-helix was first de novo built into the focused map of GR:p23tail-helix using RosettaCM48 and then was further refined using the same Rosetta iterative backbone rebuilding procedure. With a proper density weight obtained using the half maps, the final model of the GR:Hsp90:p23 complex was refined against the full reconstruction allowing only sidechain and small-scale backbone refinement. The final refinement statistics are provided (Supplementary Table 1). For the Hsp90:p23 and MBP:Hsp90:p23 cryo-EM maps (Extended Data Fig. 8a,b and Extended Data Fig. 9a,b), the Hsp90:p23 atomic model from the GR-maturation complex was rigid-body docked into the maps using Chimera. For MBP:Hsp90:p23, the apo MBP crystal structure49 (PDB ID: 1OMP) was rigid-body docked into the map using Chimera. For Extended Data Fig. 9c, the maltose-bound MBP crystal structure50 (PDB ID: 1ANF) was rigid-body docked into the map for comparison.
Fluorescence polarization assays
Fluorescence polarization of fluorescent dexamethasone (F-dex) (Thermo Fisher) was measured on a SpectraMax M5 plate reader (Molecular Devices) with excitation/emission wavelengths of 485/538 nm, temperature control set at 25°C. Buffer conditions were 50 mM HEPES pH 8, 100 mM KCl, 2 mM DTT. For equilibrium ligand binding in Fig. 2d and Extended Data Fig. 7b, proteins were pre-equilibrated together at room temperature for 60 minutes prior to F-dex addition. Proteins and reagents were added at the following concentration: 20 nM F-dex, 250 nM GR, 2 μM Hsp40, 15 μM Hsp70, 15 μM Hsp90, 15 μM Hop, 15 μM p23 or p23 tail mutants, and 5 mM ATP/MgCl2. Note that the dissociation constant (KD) between GR and F-dex is ~150 nM10. Ligand binding was initiated with 20 nM F-dex and association was measured until reaching equilibrium. For the GR control sample, 3 experiments were done with a 1-hour room temperature preincubation of GR in the reaction buffer and 3 experiments were done without a preincubation of GR to account for small effects on equilibrium ligand binding from the preincubation. The plotted equilibrium values in Fig. 2d and Extended Data Fig. 7b represent the mean of 3 biologically independent samples (except the GR control reaction, which represents the mean of 6 biologically independent samples), with error bars representing the standard deviation. Statistical significance was evaluated by an ordinary one-way ANOVA with post-hoc Dunnett’s multiple comparisons test using Prism v.9.1.1 (GraphPad). For equilibrium ligand binding in Extended Data Fig. 7c, proteins were pre-equilibrated together at room temperature for 60 minutes prior to F-dex addition. Proteins and reagents were added at the following concentration: 20 nM F-dex, 250 nM GR and 15 μM p23 or p23 tail mutants. Ligand binding was initiated with 20 nM F-dex and association was measured until reaching equilibrium. The plotted data points for each reaction represent 7 biologically independent samples (6 biologically independent samples for the GR + p23Δtail reaction) and polarization values were baseline subtracted in accordance with the measured F-dex only baseline polarization value. Statistical significance was evaluated by an ordinary one-way ANOVA using Prism v.9.1.1 (GraphPad). GR ligand binding behavior was affected by buffer conditions; therefore, reactions were always normalized such that each reaction had equivalent amounts of buffer reagents.
Sequence alignments and p23tail-helix motif search
For the p23 sequence alignments in Extended Data Fig. 6f, sequences were obtained from Uniprot51, aligned in Clustal Omega52 (https://www.ebi.ac.uk/Tools/msa/clustalo/), and visualized in JalView 2.11.1.0 53. Sequences in the alignment are: H. sapiens p23, M. musculus p23, R. norvegicus p23, G. gallus p23, X. tropicalis p23, D. melanogaster p23, A. thaliana p23, and S. cerevisiae p23 (Uniprot accession codes: Q15185, Q9R0Q7, P83868, Q90955, Q5U4Z0, Q7SZQ8, A0A0B4K6D2, Q8L7U4, P28707, respectively). Secondary structure prediction for the S. cerevisiae p23 protein sequence was performed using Psipred v.4.0 54 (http://bioinf.cs.ucl.ac.uk/psipred/). For Fig. 2b, the ConSurf server55,56 (https://consurf.tau.ac.il/) was used to select and align 87 GR protein sequences as follows: the human GR crystal structure57 (PDB ID: 4P6X) was used to select sequences from UNIREF90 with maximal percent ID at 95% and minimal percent ID at 65%. Conservation scores were calculated and provided by the server. The conservation scores calculated by the ConSurf server were mapped onto GR from the maturation complex atomic model using Chimera.
For Extended Data Fig. 6c, the sequences were obtained from Uniprot51, aligned in Clustal Omega52 (https://www.ebi.ac.uk/Tools/msa/clustalo/), and mapped onto GR from the maturation complex using Chimera. Sequences in the alignment are the human steroid hormone receptors: glucocorticoid receptor, mineralocorticoid receptor, androgen receptor, progesterone receptor, estrogen receptor α and β (Uniprot accession codes: P04150, P08235, P10275, P06401, E3WH19, Q92731, respectively). Conservation was calculated using AL2CO58 parameters (unweighted frequency estimation and entropy-based conservation measurement). Relating to Extended Data Fig. 6f, the p23tail-helix motif search was performed using the ScanProsite server 28 (https://prosite.expasy.org/scanprosite/). The motif “FXXMMN” was used to search the UniProtKB sequence database with taxonomy restricted to Homo Sapiens. There were 10 total hits on the motif, which included p23 and NCoA3/SRC-3.
Relating to Extended Data Fig. 6d, the human p23 helix predictions were performed using state-of-the-art secondary structure prediction algorithms: Porter 4.0 59 (http://distillf.ucd.ie/porterpaleale/), RaptorX60 (http://raptorx.uchicago.edu/StructurePrediction/predict/), and Psipred v.4.0 54 (http://bioinf.cs.ucl.ac.uk/psipred/). The human p23 structure prediction is available from AlphaFold v2.0 25 with the accession code P83868
Yeast survival assays
Relating to Extended Data Fig. 7d, yeast survival assays were performed using S. cerevisiae strain hsc82hsp82Δ (JJ816) or sba1hsc82hsp82Δ (JJ94) expressing either wild-type Hsc82 or a mutant in pRS313GPDHis-Hsc82 (hsc82-I588A, M589A)61. The sba1hsc82hsp82Δ strain expressing hsc82-I588A, M589A was transformed with either empty vector (pR416GPD), human p23, or p23 tail mutants constitutively expressed from the p416GPD plasmid. Cells were grown overnight at 30°, then serially diluted 10-fold and grown on selective media at the indicated temperature for 2 days.
Expression of human p23 tail mutants
Human p23 and Sba1 protein expression levels in wild-type strain (JJ762 (PJ51-3a), a derivate of W303)62 were assessed by SDS-PAGE (12.5% acrylamide gel) followed by immunoblot analysis with polyclonal antisera raised against human p23 (Novus NBP1-85485)(1:200 dilution) or Sba161 (1:500 dilution)(Extended Data Fig. 7f).
In vivo GR activity assays
Relating to Extended Data Fig. 7e, GR transactivation was measured in the wild-type S. cerevisiae strain (JJ762) expressing GR on a single copy plasmid (p414GPD-GR) and a single copy LacZ reporter plasmid (pRS317-GRE-lacZ) that were constructed using multicopy versions of each plasmid62. Human p23, p23 tail mutants, or Sba1 were constitutively expressed from the p416-GPD plasmid. Cells were grown at 30°C with shaking overnight in selective media, diluted 10-fold and grown to OD600 0.4-0.5. Cultures were split in two and one set was induced with ligand (10 μM DOC, deoxycorticosterone) (Sigma) for 1 hour. After 1 hour, cultures were put on ice to stop growth. The β-galactosidase (β-gal) activity of paired samples in the presence and absence of hormone was measured as described using the yeast β-galactosidase assay kit from Thermo Scientific (Catalog number #75768).
GR activity was determined by the fold difference in β-gal activity between the hormone treated duplicate relative to the untreated duplicate. Relative GR activation was calculated by normalizing the GR activity of each experimental sample to the average GR activity of strain JJ762 expressing p416GPD (empty vector [e.v.]). GR activity was measured with 18 biologically independent samples (10 biologically independent samples for the + Sba1 condition). Statistical significance was evaluated by an ordinary one-way ANOVA with post-hoc Šídák’s multiple comparisons test using Prism v.9.1.1 (GraphPad).
Quantification and statistical analysis
All data were tested for statistical significance with Prism v.9.1.1 (GraphPad). Statistical significance was determined by ordinary one-way ANOVA (with post-hoc Dunnett’s or Šídák’s multiple comparisons test). All experiments were performed at least three times. Statistical details (including sample sizes (n), F-statistics, p-values, and degrees of freedom) are included in the figure legends for each experiment. Relating to Fig. 2d and Extended Data Fig. 7b, the one-way ANOVA with post-hoc Dunnett’s test p-values are as follows: p(p23 vs. p23Δtail) = 0.1512, p(p23 vs. p23Δhelix-tail) = 0.0002, p(p23 vs. no p23) = <0.0001. Relating to Extended Data Fig. 7e, the one-way ANOVA with post-hoc Šídák’s test p-values are as follows: p(e.v. vs. p23) = 0.0001, p(p23 vs p23Δtail) = 0.0164, p(p23 vs. p23Δhelix-tail) = 0.0021, p(p23 vs. Sba1) = 0.0002, p(p23Δtail vs. p23Δhelix-tail) = 0.9721. For all statistical tests performed, variances across groups were not significantly different (as evaluated using the Brown-Forsythe test) and therefore no corrections were used (Fig. 2d and Extended Data Fig. 7b [Brown-Forsythe test p = 0.9966]; Extended Data Fig. 7c [Brown-Forsythe test p = 0.9224]; Extended Data Fig. 7e [Brown-Forsythe test p = 0.1696]).
Extended Data
Extended Data Fig. 1 ∣. Sample Preparation.
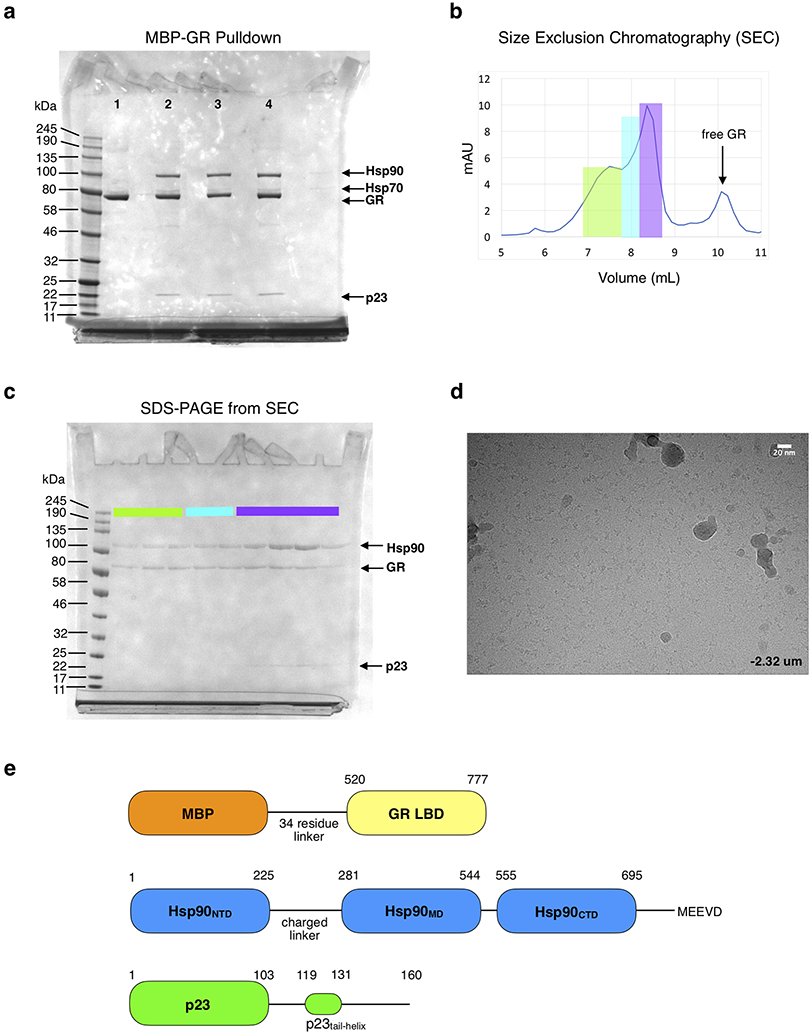
a, Coomassie-stained raw, uncropped SDS-PAGE (4-12% acrylamide gel) with elution from the MBP-GR pulldown from the in vitro reconstituted GR chaperone cycle. Assay conditions are as follows- Lane 1: 5 μM MBP-GR only; Lane 2-5: 5 μM MBP-GR, 2 μM Hsp40, 5 μM Hsp70, 5 μM Hop, 15 μM Hsp90, 15 μM Bag-1, 30 μM p23, 5 mM ATP. Lane 2: no Molybdate addition, Lane 3: addition of 20mM Molybdate, Lane 4: addition of 20 mM Molybdate after 1 hour pre-incubation (see Methods) b, Shodex KW-804 size exclusion chromatography profile of the GR-maturation complex purified by MBP-GR pulldown from the reconstituted GR chaperone cycle. mAU=milli-absorbance units. c, Coomassie-stained raw, uncropped SDS-PAGE (4-12% acrylamide gel) of the fractions from size exclusion chromatography. Colors indicate which gel lanes correspond to specific regions of the size exclusion chromatography profile. Sample fractions from the region highlighted in purple were collected and used for cryo-EM data collection. This experiment was repeated 4 independent times with similar results. d, Representative electron micrograph for the cryo-EM dataset (−2.32 μm defocus). A total of 5608 micrographs were obtained. Scale bar is 20nm. e, Domain organization of the proteins in the GR-maturation complex.
Extended Data Fig. 2 ∣. Cryo-EM Data Analysis.
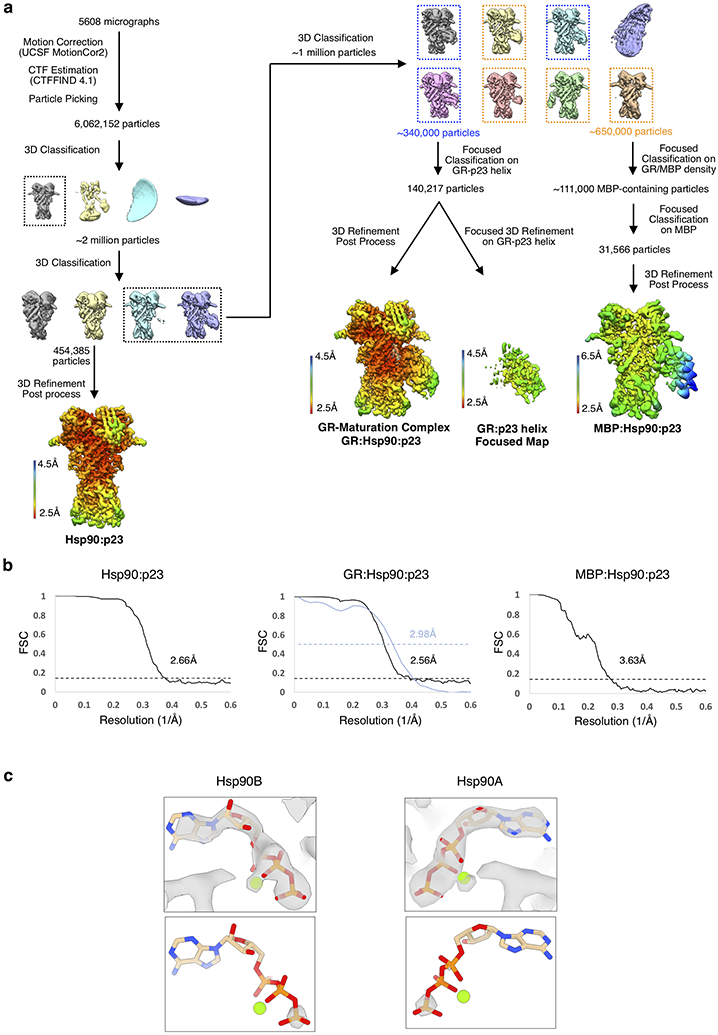
a, Cryo-EM data processing procedure with 3D reconstructions colored by local resolution. b, Gold-standard Fourier shell correlation (FSC) curves of the 3D reconstructions. The black dashed lines intercept the y-axis at an FSC value of 0.143. For the GR:Hsp90:p23 reconstruction, the map-model FSC is plotted in blue, with the blue dashed line intercepting the y-axis at an FSC value of 0.5. c, GR maturation complex map density with atomic model showing ATP-magnesium density in both Hsp90 protomers (Hsp90A/B). Bottom images show increased contour level on the map density to indicate that the ATP γ-phosphate position has much stronger density relative to the α and β-phosphates, likely corresponding to molybdate, which may act as a γ-phosphate analog (see Methods).
Extended Data Fig. 3 ∣. Hsp90:GR Interfaces.
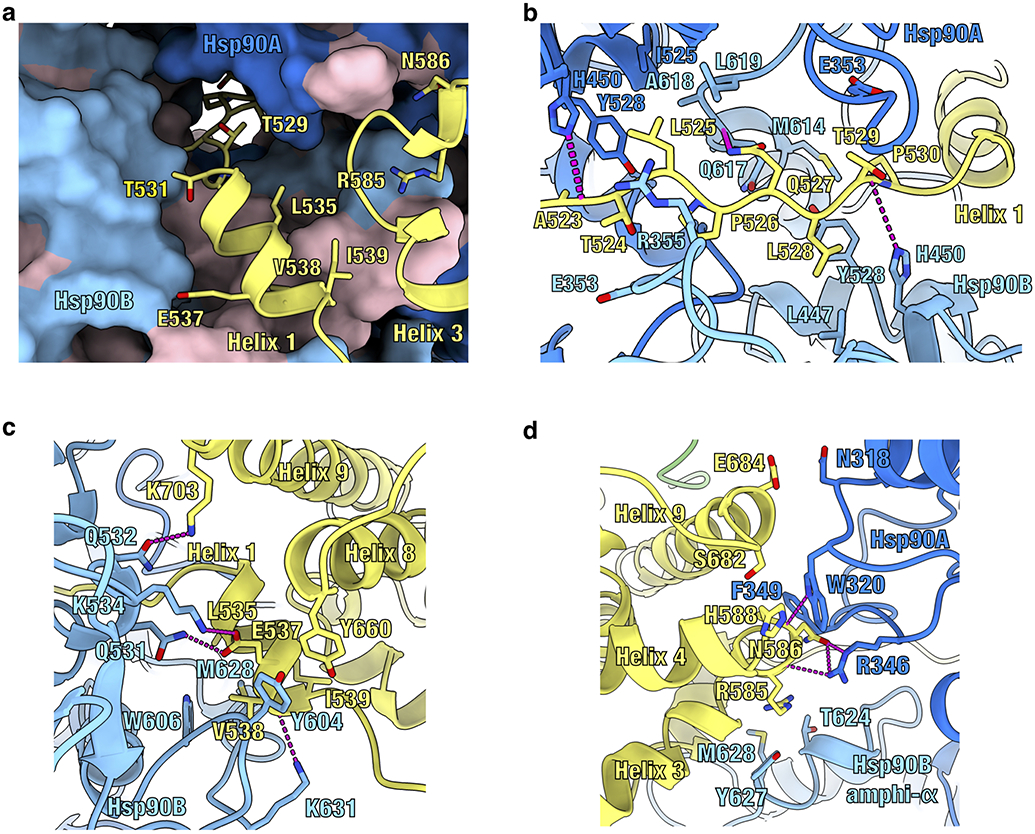
Atomic model of the maturation complex with Hsp90A (dark blue), Hsp90B (light blue), GR (yellow). a, View of the GRpre-helix 1 strand threaded through the Hsp90 lumen and GR helices 1 and 3 packing against the entrance to the Hsp90 lumen. Side chains on GR in contact with Hsp90 are shown. Hsp90A/B are in surface representation. Hydrophobic residues on Hsp90 are colored in pink. b, Interface 1 of the Hsp90:GR interaction depicting the GRpre-Helix 1 region (GR523-531) threading through the Hsp90 lumen. Side chains in contact between GR and Hsp90 are shown, along with hydrogen bonds (dashed pink lines). c, Interface 2 of the Hsp90:GR interaction depicting GRHelix 1 (GR532-539) packing against Hsp90B. Side chains in contact between GR and Hsp90 are shown, along with hydrogen bonds (dashed pink lines). d, Interface 3 of the Hsp90:GR interaction depicting residues on the Hsp90AMD loops (Hsp90AN318,W320,F349,R346) and Hsp90Bamphi-α (Hsp90BT624,Y627,M628) packing against GR. Side chains in contact between GR and Hsp90 are shown, along with hydrogen bonds (dashed pink lines).
Extended Data Fig. 4 ∣. GR is in a Native, Ligand-Bound State in the Maturation Complex.
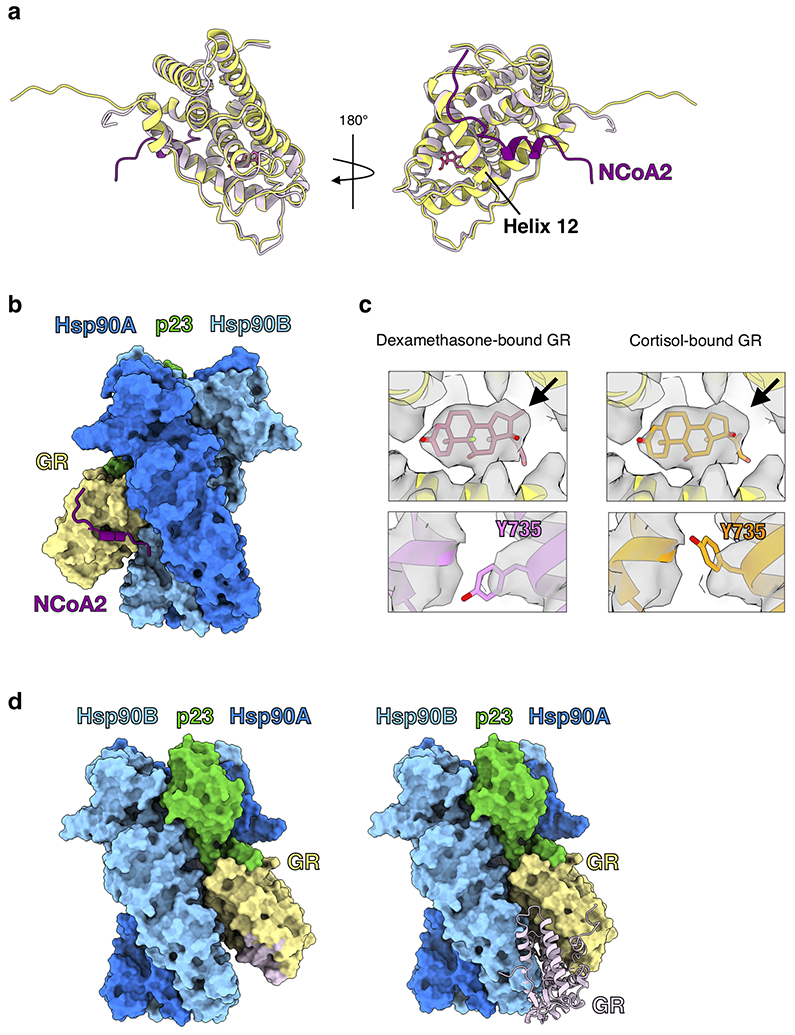
a, Atomic model of GR from the maturation complex (yellow) compared with GR from the crystal structure (PDB ID 1M2Z) (light pink) with co-activator peptide NCoA2 (purple) and ligand (pink). GRHelix 12 is indicated. b, GR-maturation complex atomic model in surface representation with the co-activator peptide NCoA2 (purple) docked based on the GR:NCoA2 crystal structure (PDB ID M2Z). The NCoA2 peptide binding interface is available and the bound NCoA2 peptide does not clash with Hsp90. Hsp90A (dark blue), Hsp90B (light blue), GR (yellow), p23 (green). c, GR maturation complex map density (sharpened with B factor −40) with either the dexamethasone-bound crystal structure docked (left panel, PDB ID 1M2Z) or the cortisol-bound crystal structure docked (right panel, PDB ID 4P6X) into the GR map density. In the top images, the ligand density is shown with the agonist dexamethasone (left) or the agonist cortisol (right) from the docked crystal structures. Arrow indicates the extra carbon atom in dexamethasone compared to cortisol. In the bottom images, density for GRY735 is shown with either the dexamethasone-bound crystal structure docked (left) or the cortisol-bound crystal structure docked (right). d, GR-maturation complex atomic model in surface representation depicting the GR LBD dimerization interface. Hsp90A (dark blue), Hsp90B (light blue), GR (yellow), p23 (green). Left, the GR LBD dimerization interface is highlighted (light pink). Right, while the dimerization interface is solvent accessible in the GR-maturation complex, the binding of a second GR LBD (light pink) clashes with the Hsp90B CTD. The dimerization interface is based on the GR LBD dimer crystal structure (PDB ID 1M2Z).
Extended Data Fig. 5 ∣. Hsp90:p23 Interfaces.
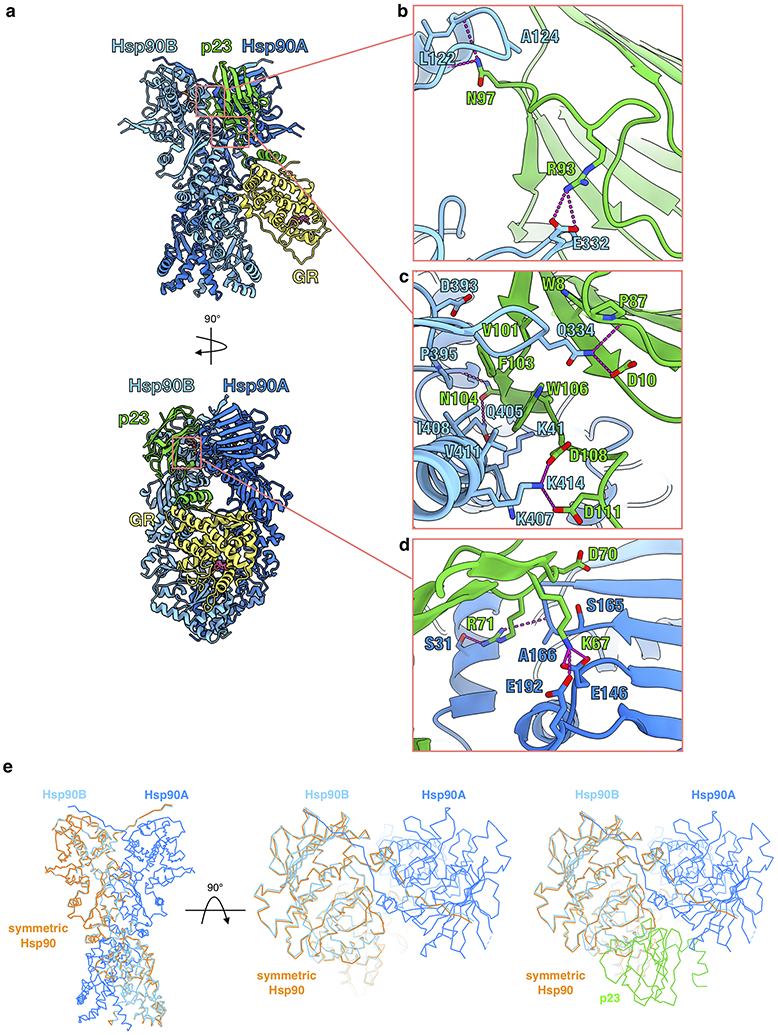
Atomic model of the maturation complex with Hsp90A (dark blue), Hsp90B (light blue), GR (yellow), p23 (green). b, Interface 1 of the Hsp90:p23 interaction depicting Hsp90B interacting with one side of the p23 core. Side chains in contact between p23 and Hsp90B are shown, along with hydrogen bonds (dashed pink lines). c, Interface 2 of the Hsp90:p23 interaction depicting Hsp90B interacting with the base of the p23 core. Side chains in contact between p23 and Hsp90B are shown, along with hydrogen bonds (dashed pink lines). d, Interface 3 of the Hsp90:p23 interaction depicting Hsp90A interacting with the side of the p23 core. Side chains in contact between p23 and Hsp90 are shown, along with hydrogen bonds (dashed pink lines). e, Atomic model of a symmetric Hsp90 dimer (orange) compared with Hsp90 from the maturation complex atomic model, indicating a slight asymmetry in the Hsp90 dimer interface in the maturation complex. Hsp90A (dark blue), Hsp90B (light blue), p23 (green).
Extended Data Fig. 6 ∣. The p23tail-helix:GR Interface.
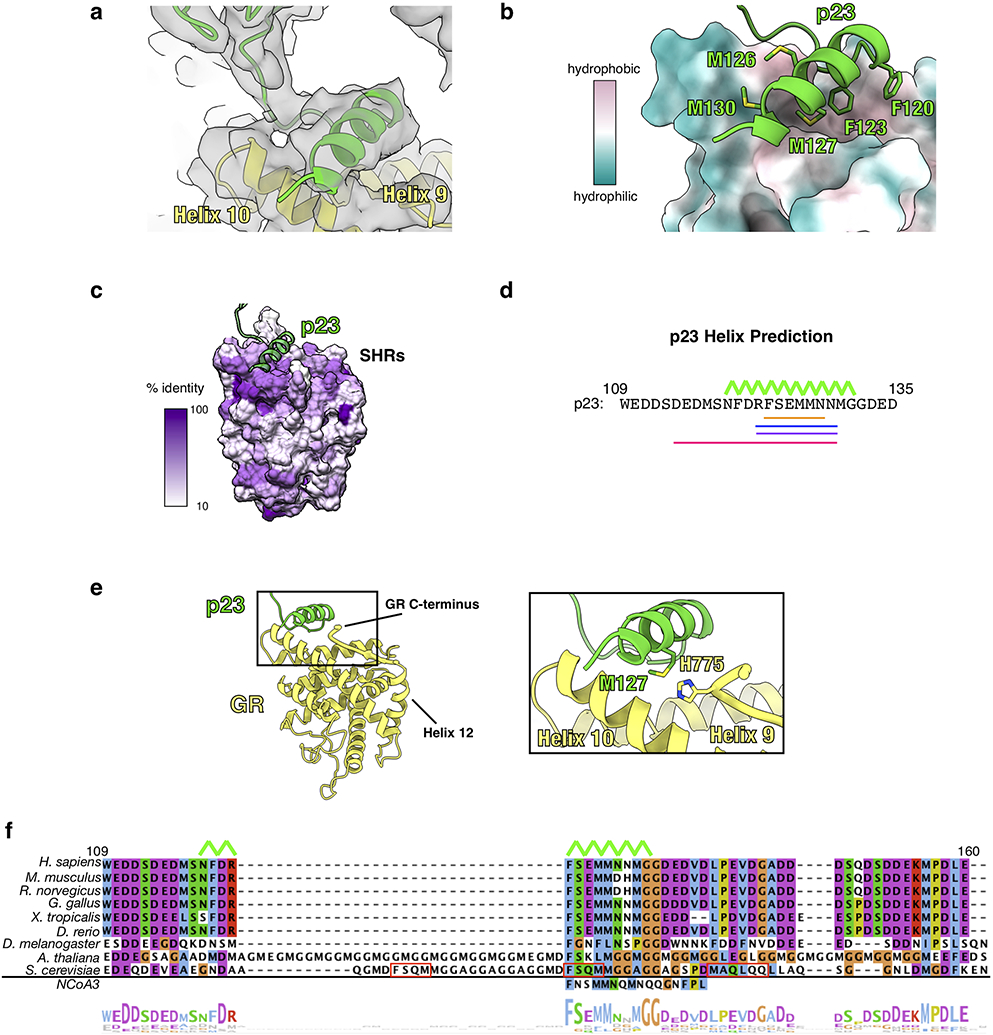
a, Focused map of GR:p23tail-helix showing density for the p23 tail with the atomic model built in. GR (yellow), p23 (green). b, Interface between the p23tail-helix (green) and GR (colored by hydrophobicity, surface representation) showing that the p23tail-helix binds to a hydrophobic patch on GR. p23 side chains interacting with GR are shown. c, Sequence identity across human steroid hormone receptors (GR, mineralocorticoid receptor, androgen receptor, progesterone receptor, estrogen receptor α and β) plotted onto the GR structure. The p23tail-helix (light green) was overlaid to indicate the p23:GR interface. d, Secondary structure predictions for human p23 from three different servers. Porter 4.0 (orange), RaptorX (blue), Psipred (purple), AlphaFold v2.0 (pink). The p23tail-helix from the maturation complex atomic model is shown with the top green line. e, Atomic model of GR (yellow) and p23 (green) from the maturation complex highlighting the interaction between the p23tail-helix and the GR C-terminus, which connects to GRHelix 12. f, Sequence alignment of eukaryotic p23 showing conservation of the p23tail-helix sequence. The p23tail-helix from the maturation complex atomic model is shown with the top green line. The bottom aligned sequence is the p23tail-helix -like motif identified in NCoA3 using the ScanProsite server. Red boxes on the S. cerevisiae p23 sequence indicate predicted helices from the PsiPred server. The alignment is colored according to the ClustalW convention.
Extended Data Fig. 7 ∣. Effect of p23 Tail Mutants on GR Activity and Cell Survival.
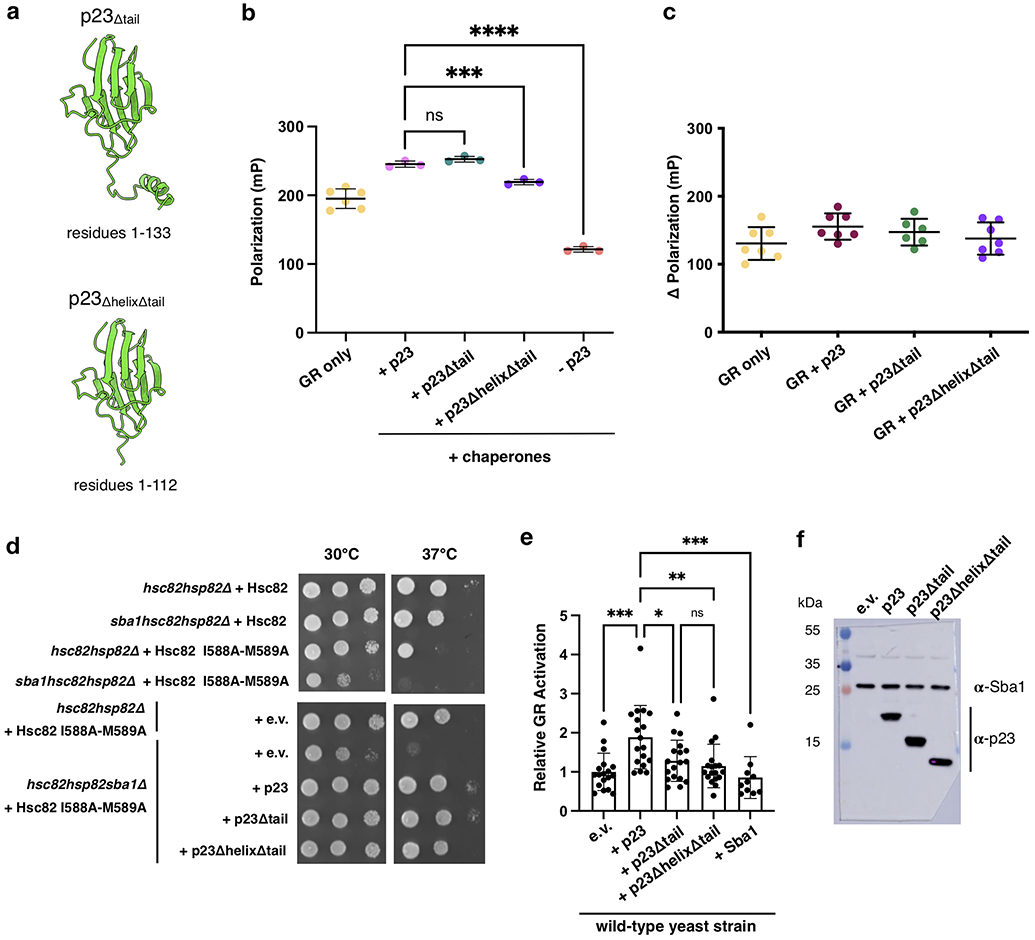
a, Depiction of the two p23 tail mutants used in the GR activity assays. b, Individual data points corresponding to Fig. 2d. Equilibrium binding of 20 nM fluorescent dexamethasone to 250 nM GR with chaperones and p23 tail mutants measured by fluorescence polarization (mean±SD). n=3 biologically independent samples per condition (n=6 biologically independent samples for the GR only condition). Significance was evaluated using a one-way ANOVA (F(3,8) = 636.2; p < 0.0001) with post-hoc Dunnett’s multiple comparisons test (n.s. P ≥ 0.05; * P ≤ 0.05; ** P ≤ 0.01; *** P ≤ 0.001; **** P ≤ 0.0001). P-values: p(p23 vs. p23Δtail) = 0.1512, p(p23 vs. p23ΔhelixΔtail) = 0.0002, p(p23 vs. no p23) = <0.0001. c, Equilibrium binding of 20 nM fluorescent dexamethasone to 250 nM GR with addition of 15 μM p23 or p23 tail mutants measured by fluorescence polarization (mean±SD). n=7 biologically independent samples per condition (n=6 biologically independent samples for the GR + p23Δtail condition). Fluorescence polarization values are baseline subtracted in accordance with the measured fluorescent dexamethasone baseline polarization value. There were no statistically significant differences between group means as determined by a one-way ANOVA (F(3,23) = 1.708; p=0.1933). d, Yeast survival assay with human p23 or p23 tail mutants. Top panels: hsc82hsp82Δ yeast expressing Hsc82 I588A-M589A exhibit a growth defect at 37°C in the presence of SBA1 and enhanced defects in cells lacking SBA1 (sba1). Bottom panels: Growth is restored by addition of human p23, although p23ΔhelixΔtail exhibits reproducibly reduced growth relative to p23 or p23Δtail. e, GR activation assay in wild-type yeast strain JJ762 expressing p23, p23 mutants, or Sba1 in addition to wild-type amounts of Sba1 from the native promoter. The fold increase in GR activities compared to the empty vector (e.v.) control are shown (mean±SD). n=18 biologically independent samples per condition (10 independent samples for the +Sba1 condition). Significance was evaluated using a one-way ANOVA (F(4,77) = 7.077; p < 0.0001) with post-hoc Šídák’s multiple comparisons test (n.s. P ≥ 0.05; * P ≤ 0.05; ** P ≤ 0.01; *** P ≤ 0.001). P-values: p(e.v. vs. p23) = 0.0001, p(p23 vs p23Δtail) = 0.0164, p(p23 vs. p23ΔhelixΔtail) = 0.0021, p(p23 vs. Sba1) = 0.0002, p(p23Δtail vs. p23ΔhelixΔtail) = 0.9721. f, Expression of human p23 or p23 tail mutants in wild-type yeast strain JJ762 assayed by immunoblot with polyclonal antisera raised against Sba1 or human p23.
Extended Data Fig. 8 ∣. Hsp90:p23 Complex.
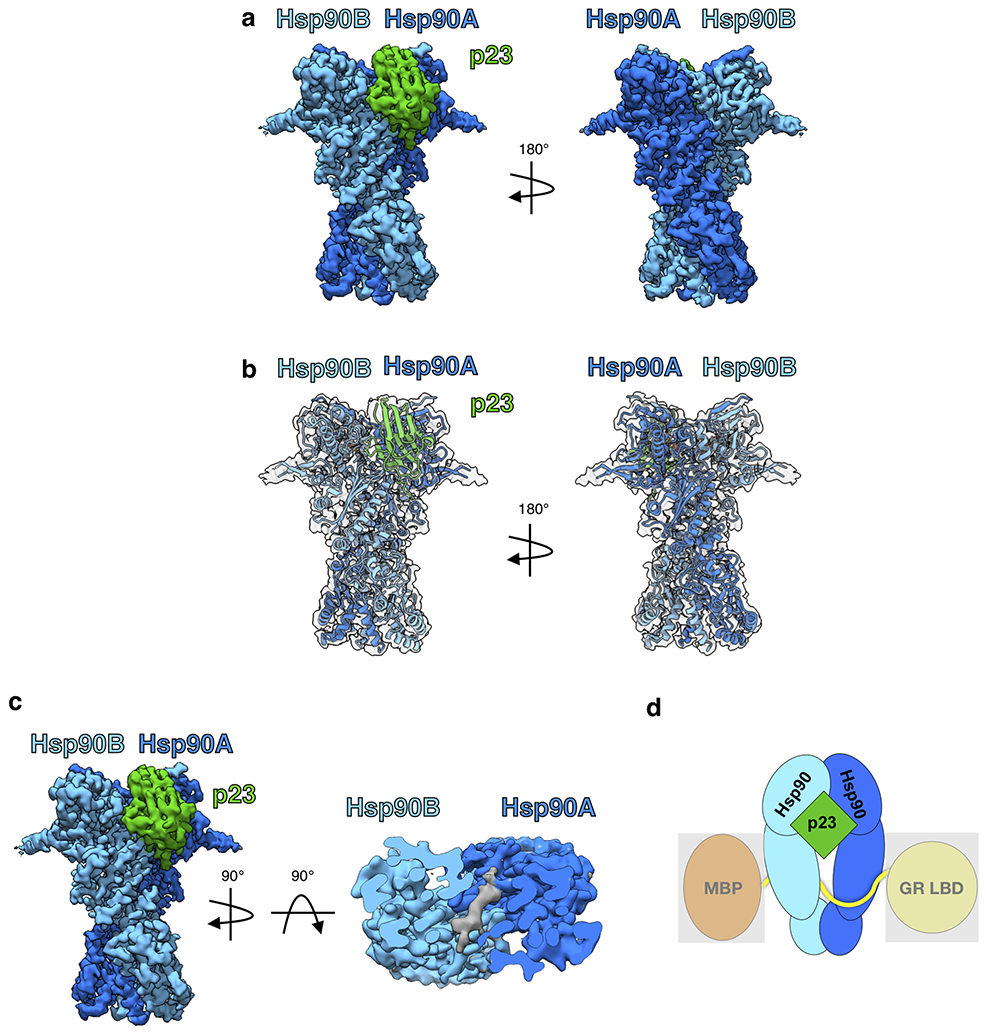
a, Cryo-EM density map of the Hsp90:p23 complex. Hsp90A (dark blue), Hsp90B (light blue), p23 (green). This color scheme is maintained in all figures that show the structure. b, Atomic model of Hsp90 and p23 from the GR-maturation complex docked into the Hsp90:p23 map density. c, Top view of the Hsp90:p23 complex density map with clipping plane to show unidentified density (gray) through the Hsp90 lumen. d, Cartoon representation of the Hsp90:p23 complex illustrating that MBP and GR LBD are not present in the map density (represented by a gray box).
Extended Data Fig. 9 ∣. MBP:Hsp90:p23 Complex.
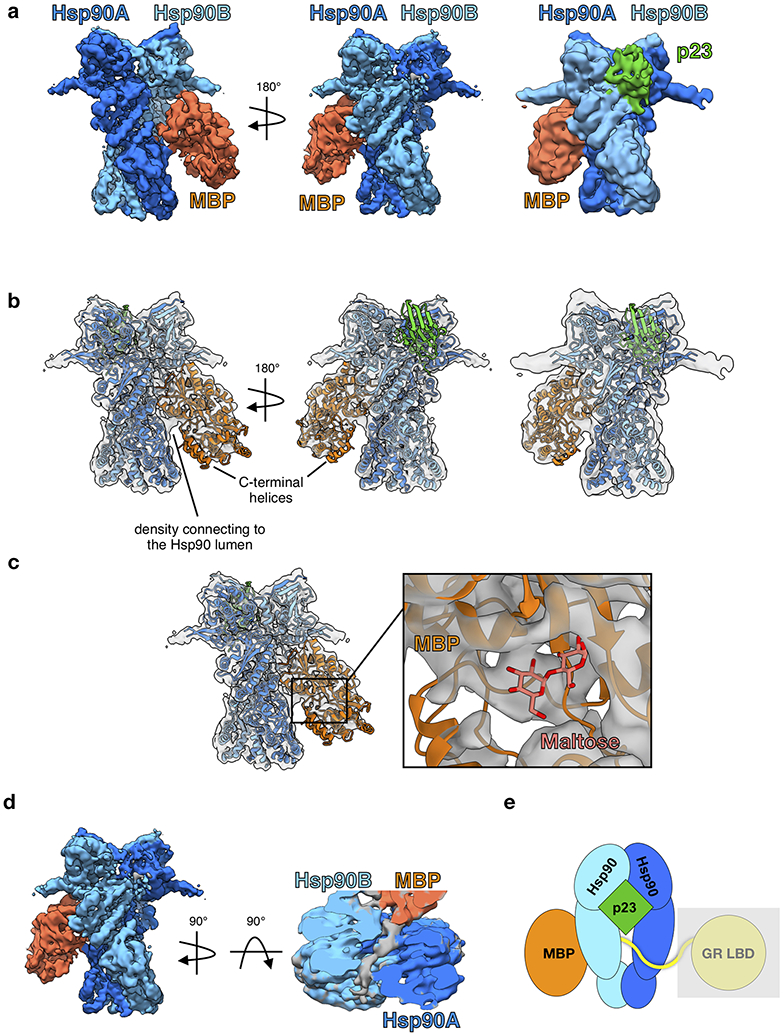
a, Cryo-EM density map of the MBP:Hsp90:p23 complex. Far right image shows the density map lowpass-filtered to 8Å. Hsp90A (dark blue), Hsp90B (light blue), p23 (green), MBP (orange). This color scheme is maintained throughout b, Apo MBP crystal structure (PDB ID 1OMP) and atomic model of Hsp90 and p23 from the GR-maturation complex docked into the MBP:Hsp90:p23 map density. Note the missing density for the two MBP C-terminal helices. Far right image shows the density map lowpass-filtered to 8Å. c, Maltose-bound MBP crystal structure (PDB ID 1ANF) docked into the MBP:Hsp90:p23 map density. MBP (orange), maltose (pink). d, Top view of the MBP:Hsp90:p23 complex density map with clipping plane to show unidentified density (gray) through the Hsp90 lumen. e, Cartoon representation of the MBP:Hsp90:p23 complex illustrating the GR LBD is not present in the map density (represented by a gray box).
Extended Data Fig. 10 ∣. Comparison of the GR-Maturation Complex with the Hsp90:Kinase Complex.
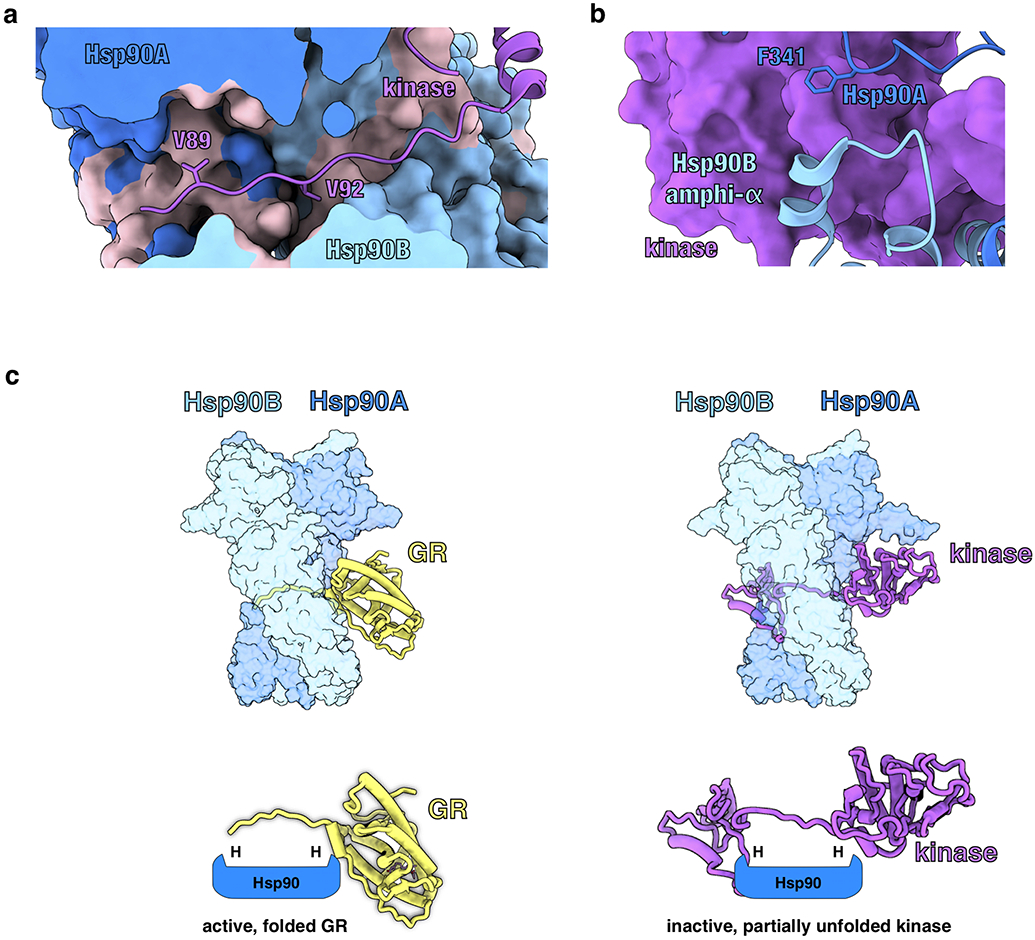
a, Structure of Hsp90 bound to an unfolded kinase client (PDB ID 5FWK) with a strand of the kinase client threaded through the Hsp90 lumen. The two hydrophobic residues on the kinase (Cdk4V89,V92) that occupy the Hsp90 hydrophobic pockets are displayed. In the GR-maturation complex, two hydrophobic residues on GR (GRL525,L528) occupy the Hsp90 hydrophobic pockets, demonstrating a conserved client binding mode. Hsp90A (dark blue, surface representation), Hsp90B (light blue, surface representation), Cdk4 kinase (purple). Hydrophobic residues on Hsp90 are colored in pink. b, Structure of Hsp90 bound to an unfolded kinase client (PDB ID 5FWK) depicting Hsp90AF341 (Hsp90 isoform β) and Hsp90Bamphi-α packing against the kinase. In the GR-maturation complex, the corresponding residue Hsp90AF349 (Hsp90 isoform α) and the Hsp90Bamphi-α also pack against GR, demonstrating a conserved Hsp90:client binding interface. Hsp90A (dark blue), Hsp90B (light blue), Cdk4 kinase (purple, surface representation). c, Top, atomic models of the GR-maturation complex and Hsp90:kinase complex showing that both clients thread through the closed Hsp90 lumen. Hsp90A (dark blue, surface representation), Hsp90B (light blue, surface representation), GR (yellow), Cdk4 kinase (purple). Bottom, schematics demonstrating that both clients thread through the mostly hydrophobic Hsp90 lumen, but have different folding outcomes (H=hydrophobic interface).
Supplementary Material
Supplementary Table 1 ∣ Cryo-EM data collection, refinement and validation statistics
Acknowledgements
We thank members of the Agard Lab and Elaine Kirschke for helpful discussions. We thank David Bulkley, Glenn Gilbert, Zanlin Yu, and Eric Tse from the W.M. Keck Foundation Advanced Microscopy Laboratory at the University of California, San Francisco (UCSF) for EM facility maintenance and help with data collection. We also thank Matt Harrington and Joshua Baker-LePain for computational support with the UCSF Wynton cluster. C.M.N. is a National Cancer Institute Ruth L. Kirschstein Predoctoral Individual NRSA Fellow. R.Y.-R.W was a Howard Hughes Medical Institute Fellow of the Life Sciences Research Foundation. The work was supported by funding from Howard Hughes Medical Institute (D.A.A.) and NIH grants R35GM118099 (D.A.A.), S10OD020054 (D.A.A.), S10OD021741 (D.A.A.), P20GM104420 (J.L.J.), and R01GM127675 (J.L.J.).
Footnotes
Competing interests
The authors declare no competing interests.
Reporting summary
Further information on research design is available in the Nature Research Reporting Summary linked to this paper.
Data availability
The cryo-EM maps generated in this study have been deposited in the Electron Microscopy Data Bank (EMDB) under the accession codes EMD-23004 (GR:Hsp90:p23), EMD-23006 (Hsp90:p23), and EMD-23005 (MBP:Hsp90:p23). The atomic coordinates have been deposited in the PDB under the accession code 7KRJ (GR:Hsp90:p23). Publicly available PDB entries used in this study are: 5FWK, 1M2Z, 4P6X, 1EJF, 2CG9, 1OMP, and 1ANF. The human p23 structure prediction is available from AlphaFold v2.0 with the accession code P83868 (https://alphafold.ebi.ac.uk/entry/P83868). Protein sequence data for sequence alignments are available from Uniprot (see Methods for accession codes). Source data related to Fig. 2d and Extended Data Fig. 7b,c,e are provided with this paper.
Main References
- 1.Taipale M, Jarosz DF & Lindquist S HSP90 at the hub of protein homeostasis: emerging mechanistic insights. 11, 515–528, doi: 10.1038/nrm2918 (2010). [DOI] [PubMed] [Google Scholar]
- 2.Schopf FH, Biebl MM & Buchner J The HSP90 chaperone machinery. Nature Reviews Molecular Cell Biology 18, 345–360, doi: 10.1038/nrm.2017.20 (2017). [DOI] [PubMed] [Google Scholar]
- 3.Taipale M et al. Quantitative analysis of HSP90-client interactions reveals principles of substrate recognition. Cell 150, 987–1001, doi: 10.1016/j.cell.2012.06.047 (2012). [DOI] [PMC free article] [PubMed] [Google Scholar]
- 4.Picard D et al. Reduced levels of hsp90 compromise steroid receptor action in vivo. Nature 348, 166–168, doi: 10.1038/348166a0 (1990). [DOI] [PubMed] [Google Scholar]
- 5.Pratt WB & Toft DO Steroid Receptor Interactions with Heat Shock Protein and Immunophilin Chaperones. Endocrine Reviews 18, 306–360, doi: 10.1210/edrv.18.3.0303 (1997). [DOI] [PubMed] [Google Scholar]
- 6.Morishima Y, Murphy PJ, Li DP, Sanchez ER & Pratt WB Stepwise assembly of a glucocorticoid receptor.hsp90 heterocomplex resolves two sequential ATP-dependent events involving first hsp70 and then hsp90 in opening of the steroid binding pocket. J Biol Chem 275, 18054–18060, doi: 10.1074/jbc.M000434200 (2000). [DOI] [PubMed] [Google Scholar]
- 7.Smith DF & Toft DO Minireview: the intersection of steroid receptors with molecular chaperones: observations and questions. Mol Endocrinol 22, 2229–2240, doi: 10.1210/me.2008-0089 (2008). [DOI] [PMC free article] [PubMed] [Google Scholar]
- 8.Lorenz OR et al. Modulation of the Hsp90 Chaperone Cycle by a Stringent Client Protein. 53, 941–953, doi: 10.1016/j.molcel.2014.02.003 (2014). [DOI] [PubMed] [Google Scholar]
- 9.Nathan DF & Lindquist S Mutational analysis of Hsp90 function: interactions with a steroid receptor and a protein kinase. Mol Cell Biol 15, 3917–3925, doi: 10.1128/mcb.15.7.3917 (1995). [DOI] [PMC free article] [PubMed] [Google Scholar]
- 10.Kirschke E, Goswami D, Southworth D, Griffin P & Agard D Glucocorticoid Receptor Function Regulated by Coordinated Action of the Hsp90 and Hsp70 Chaperone Cycles. Cell 157, 1685–1697, doi: 10.1016/j.cell.2014.04.038 (2014). [DOI] [PMC free article] [PubMed] [Google Scholar]
- 11.Verba KA et al. Atomic structure of Hsp90-Cdc37-Cdk4 reveals that Hsp90 traps and stabilizes an unfolded kinase. Science 352, 1542–1547, doi: 10.1126/science.aaf5023 (2016). [DOI] [PMC free article] [PubMed] [Google Scholar]
- 12.Wang RY-R et al. GR chaperone cycle mechanism revealed by cryo-EM: inactivation of GR by GR:Hsp90:Hsp70:Hop client-loading complex. bioRxiv, 2020.2011.2005.370247, doi: 10.1101/2020.11.05.370247 (2020). [DOI] [Google Scholar]
- 13.Zhao R et al. Navigating the chaperone network: an integrative map of physical and genetic interactions mediated by the hsp90 chaperone. Cell 120, 715–727, doi: 10.1016/j.cell.2004.12.024 (2005). [DOI] [PubMed] [Google Scholar]
- 14.Rosenzweig R, Nillegoda NB, Mayer MP & Bukau B The Hsp70 chaperone network. Nat Rev Mol Cell Biol 20, 665–680, doi: 10.1038/s41580-019-0133-3 (2019). [DOI] [PubMed] [Google Scholar]
- 15.Krukenberg KA, Street TO, Lavery LA & Agard DA Conformational dynamics of the molecular chaperone Hsp90. Q Rev Biophys 44, 229–255, doi: 10.1017/S0033583510000314 (2011). [DOI] [PMC free article] [PubMed] [Google Scholar]
- 16.Ali MMU et al. Crystal structure of an Hsp90–nucleotide–p23/Sba1 closed chaperone complex. Nature 440, 1013–1017, doi: 10.1038/nature04716 (2006). [DOI] [PMC free article] [PubMed] [Google Scholar]
- 17.Sahasrabudhe P, Rohrberg J, Biebl MM, Rutz DA & Buchner J The Plasticity of the Hsp90 Co-chaperone System. Mol Cell 67, 947–961.e945, doi: 10.1016/j.molcel.2017.08.004 (2017). [DOI] [PubMed] [Google Scholar]
- 18.Scheres SH RELION: implementation of a Bayesian approach to cryo-EM structure determination. J Struct Biol 180, 519–530, doi: 10.1016/j.jsb.2012.09.006 (2012). [DOI] [PMC free article] [PubMed] [Google Scholar]
- 19.Wang RY et al. Automated structure refinement of macromolecular assemblies from cryo-EM maps using Rosetta. Elife 5, doi: 10.7554/eLife.17219 (2016). [DOI] [PMC free article] [PubMed] [Google Scholar]
- 20.Meyer P et al. Structural and Functional Analysis of the Middle Segment of Hsp90: Implications for ATP Hydrolysis and Client Protein and Cochaperone Interactions. Molecular Cell 11, 647–658, doi: 10.1016/S1097-2765(03)00065-0 (2003). [DOI] [PubMed] [Google Scholar]
- 21.Rutz DA et al. A switch point in the molecular chaperone Hsp90 responding to client interaction. Nature Communications 9, 1472, doi: 10.1038/s41467-018-03946-x (2018). [DOI] [PMC free article] [PubMed] [Google Scholar]
- 22.Hawle P et al. The middle domain of Hsp90 acts as a discriminator between different types of client proteins. Molecular and cellular biology 26, 8385–8395, doi: 10.1128/MCB.02188-05 (2006). [DOI] [PMC free article] [PubMed] [Google Scholar]
- 23.Bledsoe RK et al. Crystal Structure of the Glucocorticoid Receptor Ligand Binding Domain Reveals a Novel Mode of Receptor Dimerization and Coactivator Recognition. 110, 93–105, doi: 10.1016/s0092-8674(02)00817-6 (2002). [DOI] [PubMed] [Google Scholar]
- 24.Weikl T, Abelmann K & Buchner J An unstructured C-terminal region of the Hsp90 co-chaperone p23 is important for its chaperone function. J Mol Biol 293, 685–691, doi: 10.1006/jmbi.1999.3172 (1999). [DOI] [PubMed] [Google Scholar]
- 25.Jumper J et al. Highly accurate protein structure prediction with AlphaFold. Nature, doi: 10.1038/s41586-021-03819-2 (2021). [DOI] [PMC free article] [PubMed] [Google Scholar]
- 26.Seraphim TV et al. The C-terminal region of the human p23 chaperone modulates its structure and function. Arch Biochem Biophys 565, 57–67, doi: 10.1016/j.abb.2014.10.015 (2015). [DOI] [PubMed] [Google Scholar]
- 27.Biebl MM et al. Structural elements in the flexible tail of the co-chaperone p23 coordinate client binding and progression of the Hsp90 chaperone cycle. Nat Commun 12, 828, doi: 10.1038/s41467-021-21063-0 (2021). [DOI] [PMC free article] [PubMed] [Google Scholar]
- 28.de Castro E et al. ScanProsite: detection of PROSITE signature matches and ProRule-associated functional and structural residues in proteins. Nucleic Acids Res 34, W362–365, doi: 10.1093/nar/gkl124 (2006). [DOI] [PMC free article] [PubMed] [Google Scholar]
- 29.McKenna NJ & O'Malley BW Combinatorial control of gene expression by nuclear receptors and coregulators. Cell 108, 465–474, doi: 10.1016/s0092-8674(02)00641-4 (2002). [DOI] [PubMed] [Google Scholar]
- 30.Weaver AJ, Sullivan WP, Felts SJ, Owen BAL & Toft DO Crystal Structure and Activity of Human p23, a Heat Shock Protein 90 Co-chaperone. J Biol Chem 275, 23045–23052, doi: 10.1074/jbc.m003410200 (2000). [DOI] [PubMed] [Google Scholar]
- 31.Freeman BC, Toft DO & Morimoto RI Molecular chaperone machines: chaperone activities of the cyclophilin Cyp-40 and the steroid aporeceptor-associated protein p23. Science 274, 1718–1720, doi: 10.1126/science.274.5293.1718 (1996). [DOI] [PubMed] [Google Scholar]
- 32.Freeman BC, Felts SJ, Toft DO & Yamamoto KR The p23 molecular chaperones act at a late step in intracellular receptor action to differentially affect ligand efficacies. Genes & development 14, 422–434 (2000). [PMC free article] [PubMed] [Google Scholar]
- 33.Bohen SP Genetic and biochemical analysis of p23 and ansamycin antibiotics in the function of Hsp90-dependent signaling proteins. Mol Cell Biol 18, 3330–3339, doi: 10.1128/MCB.18.6.3330 (1998). [DOI] [PMC free article] [PubMed] [Google Scholar]
- 34.Freeman BC & Yamamoto KR Disassembly of Transcriptional Regulatory Complexes by Molecular Chaperones. Science 296, 2232, doi: 10.1126/science.1073051 (2002). [DOI] [PubMed] [Google Scholar]
- 35.Liu Y, Elnatan D, Sun M, Myasnikov AG & Agard DA Cryo-EM reveals the dynamic interplay between mitochondrial Hsp90 and SdhB folding intermediates. bioRxiv, 2020.2010.2006.327627, doi: 10.1101/2020.10.06.327627 (2020). [DOI] [Google Scholar]
- 36.Suren T et al. Single-molecule force spectroscopy reveals folding steps associated with hormone binding and activation of the glucocorticoid receptor. Proceedings of the National Academy of Sciences 115, 11688, doi: 10.1073/pnas.1807618115 (2018). [DOI] [PMC free article] [PubMed] [Google Scholar]
- 37.Czar MJ, Galigniana MD, Silverstein AM & Pratt WB Geldanamycin, a heat shock protein 90-binding benzoquinone ansamycin, inhibits steroid-dependent translocation of the glucocorticoid receptor from the cytoplasm to the nucleus. Biochemistry 36, 7776–7785, doi: 10.1021/bi970648x (1997). [DOI] [PubMed] [Google Scholar]
- 38.Galigniana MD, Radanyi C, Renoir JM, Housley PR & Pratt WB Evidence that the peptidylprolyl isomerase domain of the hsp90-binding immunophilin FKBP52 is involved in both dynein interaction and glucocorticoid receptor movement to the nucleus. J Biol Chem 276, 14884–14889, doi: 10.1074/jbc.M010809200 (2001). [DOI] [PubMed] [Google Scholar]
- 39.Netzer WJ & Hartl FU Recombination of protein domains facilitated by co-translational folding in eukaryotes. Nature 388, 343–349, doi: 10.1038/41024 (1997). [DOI] [PubMed] [Google Scholar]
Methods References
- 40.Pettersen EF et al. UCSF Chimera--a visualization system for exploratory research and analysis. J Comput Chem 25, 1605–1612, doi: 10.1002/jcc.20084 (2004). [DOI] [PubMed] [Google Scholar]
- 41.Goddard TD et al. UCSF ChimeraX: Meeting modern challenges in visualization and analysis. Protein Sci 27, 14–25, doi: 10.1002/pro.3235 (2018). [DOI] [PMC free article] [PubMed] [Google Scholar]
- 42.Johnson JL & Toft DO Binding of p23 and hsp90 during assembly with the progesterone receptor. Mol Endocrinol 9, 670–678, doi: 10.1210/mend.9.6.8592513 (1995). [DOI] [PubMed] [Google Scholar]
- 43.Csermely P et al. Atp Induces a Conformational Change of the 90-Kda Heat-Shock Protein (Hsp90). Journal of Biological Chemistry 268, 1901–1907 (1993). [PubMed] [Google Scholar]
- 44.Schorb M, Haberbosch I, Hagen WJH, Schwab Y & Mastronarde DN Software tools for automated transmission electron microscopy. Nat Methods 16, 471–477, doi: 10.1038/s41592-019-0396-9 (2019). [DOI] [PMC free article] [PubMed] [Google Scholar]
- 45.Zheng SQ et al. MotionCor2: anisotropic correction of beam-induced motion for improved cryo-electron microscopy. Nat Methods 14, 331–332, doi: 10.1038/nmeth.4193 (2017). [DOI] [PMC free article] [PubMed] [Google Scholar]
- 46.Rohou A & Grigorieff N CTFFIND4: Fast and accurate defocus estimation from electron micrographs. J Struct Biol 192, 216–221, doi: 10.1016/j.jsb.2015.08.008 (2015). [DOI] [PMC free article] [PubMed] [Google Scholar]
- 47.Zimmermann L et al. A Completely Reimplemented MPI Bioinformatics Toolkit with a New HHpred Server at its Core. J Mol Biol 430, 2237–2243, doi: 10.1016/j.jmb.2017.12.007 (2018). [DOI] [PubMed] [Google Scholar]
- 48.Song Y et al. High-resolution comparative modeling with RosettaCM. Structure 21, 1735–1742, doi: 10.1016/j.str.2013.08.005 (2013). [DOI] [PMC free article] [PubMed] [Google Scholar]
- 49.Sharff AJ, Rodseth LE, Spurlino JC & Quiocho FA Crystallographic evidence of a large ligand-induced hinge-twist motion between the two domains of the maltodextrin binding protein involved in active transport and chemotaxis. Biochemistry 31, 10657–10663, doi: 10.1021/bi00159a003 (1992). [DOI] [PubMed] [Google Scholar]
- 50.Quiocho FA, Spurlino JC & Rodseth LE Extensive features of tight oligosaccharide binding revealed in high-resolution structures of the maltodextrin transport/chemosensory receptor. Structure 5, 997–1015, doi: 10.1016/s0969-2126(97)00253-0 (1997). [DOI] [PubMed] [Google Scholar]
- 51.UniProt C UniProt: the universal protein knowledgebase in 2021. Nucleic Acids Res 49, D480–D489, doi: 10.1093/nar/gkaa1100 (2021). [DOI] [PMC free article] [PubMed] [Google Scholar]
- 52.Madeira F et al. The EMBL-EBI search and sequence analysis tools APIs in 2019. Nucleic Acids Res 47, W636–W641, doi: 10.1093/nar/gkz268 (2019). [DOI] [PMC free article] [PubMed] [Google Scholar]
- 53.Waterhouse AM, Procter JB, Martin DM, Clamp M & Barton GJ Jalview Version 2--a multiple sequence alignment editor and analysis workbench. Bioinformatics 25, 1189–1191, doi: 10.1093/bioinformatics/btp033 (2009). [DOI] [PMC free article] [PubMed] [Google Scholar]
- 54.Jones DT Protein secondary structure prediction based on position-specific scoring matrices. Journal of Molecular Biology 292, 195–202, doi:DOI 10.1006/jmbi.1999.3091 (1999). [DOI] [PubMed] [Google Scholar]
- 55.Landau M et al. ConSurf 2005: the projection of evolutionary conservation scores of residues on protein structures. Nucleic Acids Res 33, W299–302, doi: 10.1093/nar/gki370 (2005). [DOI] [PMC free article] [PubMed] [Google Scholar]
- 56.Ashkenazy H et al. ConSurf 2016: an improved methodology to estimate and visualize evolutionary conservation in macromolecules. Nucleic Acids Res 44, W344–350, doi: 10.1093/nar/gkw408 (2016). [DOI] [PMC free article] [PubMed] [Google Scholar]
- 57.He Y et al. Structures and mechanism for the design of highly potent glucocorticoids. Cell Res 24, 713–726, doi: 10.1038/cr.2014.52 (2014). [DOI] [PMC free article] [PubMed] [Google Scholar]
- 58.Pei J & Grishin NV AL2CO: calculation of positional conservation in a protein sequence alignment. Bioinformatics 17, 700–712, doi: 10.1093/bioinformatics/17.8.700 (2001). [DOI] [PubMed] [Google Scholar]
- 59.Mirabello C & Pollastri G Porter, PaleAle 4.0: high-accuracy prediction of protein secondary structure and relative solvent accessibility. Bioinformatics 29, 2056–2058, doi: 10.1093/bioinformatics/btt344 (2013). [DOI] [PubMed] [Google Scholar]
- 60.Kallberg M et al. Template-based protein structure modeling using the RaptorX web server. Nat Protoc 7, 1511–1522, doi: 10.1038/nprot.2012.085 (2012). [DOI] [PMC free article] [PubMed] [Google Scholar]
- 61.Johnson JL, Halas A & Flom G Nucleotide-dependent interaction of Saccharomyces cerevisiae Hsp90 with the cochaperone proteins Sti1, Cpr6, and Sba1. Mol Cell Biol 27, 768–776, doi: 10.1128/MCB.01034-06 (2007). [DOI] [PMC free article] [PubMed] [Google Scholar]
- 62.Johnson JL & Craig EA A role for the Hsp40 Ydj1 in repression of basal steroid receptor activity in yeast. Mol Cell Biol 20, 3027–3036, doi: 10.1128/MCB.20.9.3027-3036.2000 (2000). [DOI] [PMC free article] [PubMed] [Google Scholar]
Associated Data
This section collects any data citations, data availability statements, or supplementary materials included in this article.
Supplementary Materials
Supplementary Table 1 ∣ Cryo-EM data collection, refinement and validation statistics
Data Availability Statement
The cryo-EM maps generated in this study have been deposited in the Electron Microscopy Data Bank (EMDB) under the accession codes EMD-23004 (GR:Hsp90:p23), EMD-23006 (Hsp90:p23), and EMD-23005 (MBP:Hsp90:p23). The atomic coordinates have been deposited in the PDB under the accession code 7KRJ (GR:Hsp90:p23). Publicly available PDB entries used in this study are: 5FWK, 1M2Z, 4P6X, 1EJF, 2CG9, 1OMP, and 1ANF. The human p23 structure prediction is available from AlphaFold v2.0 with the accession code P83868 (https://alphafold.ebi.ac.uk/entry/P83868). Protein sequence data for sequence alignments are available from Uniprot (see Methods for accession codes). Source data related to Fig. 2d and Extended Data Fig. 7b,c,e are provided with this paper.


