

Abstract
Background
Leukoencephalopathy with brainstem and spinal cord involvement and lactate elevation (LBSL) is a rare leukodystrophy with motor impairment due to biallelic mutations in DARS2, which encodes mitochondrial aspartyl tRNA synthetase. Progressive ataxia is the primary feature.
Objective
The study objective is to determine the feasibility of remotely collecting quantitative gait and balance measures in LBSL.
Methods
The study design uses wearable accelerometers and the scale for the assessment and rating of ataxia (SARA) scale to assess gait and postural sway in LBSL and control participants' homes through video conferencing.
Results
Lateral step variability (LSV), which indicates stride variability, and elevation of the step at mid‐swing are increased for LBSL patients during brief walking tests. During stance with the eyes closed, LBSL participants show rapid accelerations and decelerations of body movement covering a large sway area and path. Both the LSV and sway area during stance with the feet together and eyes closed correlate strongly with the SARA.
Conclusions
Wearable accelerometers are valid and sensitive for detecting ataxia in LBSL patients during remote assessments. The finding of large increases in the sway area during stance with the eyes closed is intriguing since dorsal column dysfunction is universally seen in LBSL. This approach can be applied to related rare diseases that feature ataxia.
Background
Leukoencephalopathy with brainstem and spinal cord involvement and lactate elevation (LBSL) is a rare autosomal recessive leukodystrophy caused by biallelic mutations in the DARS2 gene and characterized by progressive ataxia, spasticity and dorsal column dysfunction. 1 Prevalence data are scarce and the carrier rate is low in the general population, although a 1:95 carrier rate has been reported in Finland. 2 DARS2 encodes mitochondrial aspartyl‐tRNA synthetase, the enzyme that attaches aspartate to the correct mitochondrial tRNA. This step is necessary for the translation of mitochondrial mRNA into functional protein. 3 MR imaging typically shows T2 hyperintensities in the cerebral, brainstem, and cerebellar white matter, as well as dorsal column and lateral corticospinal tracts, 4 (Fig. S1). LBSL presents on a clinical spectrum, but the most common presentation is onset of ataxia in childhood and slow neurological deterioration. The contribution of factors such as the genotype or the white matter lesion burden to disease progression is unclear. Treatment strategies inclusive of antisense oligonucelotide therapy 3 and antioxidants 5 have been proposed, but the lack of quantitative outcome measures that represent clinically meaningful measures of disease severity and progression is an unmet need that impedes the advancement to clinical trials.
Wearable accelerometers are increasingly being used to characterize atypical patterns of gait and balance. 6 , 7 These research‐grade, watch‐sized sensors typically contain an accelerometer, gyroscope, and magnetometer and are designed to quantify physical movement with good clinical validity and test–retest reliability compared with clinical examinations or clinical rating scales. 8 , 9 In Parkinson's Disease and multiple sclerosis (MS), wearable accelerometers have been used to evaluate gait and postural sway patterns in patients with varying levels of disease severity and in response to therapeutic interventions. Furthermore, aspects of postural sway in Parkinson's disease, such as sway velocity, may be related to disease progression. 10 Wearable accelerometers have also been used to evaluate disease severity and progression in Friedrich's ataxia (FA) and spinocerebellar ataxia (SCA). 11 , 12 In the early stages of SCA, wearable sensor measurement of gait ataxia was shown to be superior to the scale for the assessment and rating of ataxia (SARA) scale in detecting changes in gait parameters. 12
Utilization of wearable technology confers an additional advantage in that the system can be sent to participants' homes for remote assessment. The barriers to collecting longitudinal outcome measures for natural history studies and clinical trials are well‐known, with limitations in terms of recruitment, enrollment, and retention. 13 This concern looms even larger for studies in rare neurological diseases, since patients must often travel significant distances to academic centers to participate in research, adding burdens of cost and time.
The aim of this study was to establish evidence for the feasibility of using wearable technology to remotely obtain quantitative sensory motor performance measures that distinguish individuals with LBSL from individuals with no neurological disease. We first hypothesized that quantitative gait and balance measures obtained using wearable sensors will demonstrate concurrent validity in comparison with a standardized ataxia rating scale. We next hypothesized that performance on gait and balance tests quantified using the wearable sensors will detect gait and sway abnormalities consistent with ataxia and spasticity that differentiate LBSL patients from controls.
Methods
Study recruitment and eligibility
This study was registered on clinicaltrials.gov (NCT 03624374) and underwent review and approval by the local Institutional Review Board. Participants were recruited from the Moser Center for Leukodystrophies at the Kennedy Krieger Institute (KKI) with the assistance of leukodystrophy advocacy groups. Patients aged 5–99 years with confirmed DARS2 mutations and age‐ and sex‐matched healthy controls without neurological disease were eligible and informed consent and/or assent was obtained by phone.
Demographic information and participant disease characteristics were obtained by parental proxy or participant report and medical records review (Table 1). Neurological exam documentation was also obtained by chart review. Parents or participants were interviewed during the study visit to determine the overall level of daily functional ability in gross and fine motor domains.
Table 1.
LBSL clinical desmographics.
| LBSL subject | Age (year) | Age symptom onset (year) | Sex | GMFCS | MACS | SARA | MRI score | Motor crises |
|---|---|---|---|---|---|---|---|---|
| 1 | 5 | Asymptomatic | M | 1 | 1 | 4.5 | 7.5 | Y |
| 2 | 6 | 1.5 | M | 2 | 2 | 11 | 1 | Y |
| 3 | 9 | 8 | M | 1 | 1 | 6.5 | 3 | N |
| 4 | 10 | 5 | F | 1 | 1 | 14.5 | 22 | Y |
| 5 | 10 | 1.5 | F | 1 | 1 | 10.5 | 10 | Y |
| 6 | 18 | 2 | F | 1 | 1 | 7 | 11 | N |
| 7 | 20 | 16 | M | 1 | 1 | 0 | 8 | Y |
| 8 | 23 | 4 | M | 2 | 1 | 16 | 6.5 | Y |
| Summary | 10 | 4.5 | 37.5% F | 1.3 | 1.1 | 8.7 | 10.6 | 75% Y |
GMFCS, Gross Motor Function Classification System: 1–5 (mild to severe impairment); MACS, Manual Ability Classification System: 1–5 (mild to severe impairment); SARA, scale for the assessment and rating of ataxia Scale: 0–40 (mild to severe ataxia); LBSL, leukoencephalopathy with brainstem and spinal cord involvement and lactate elevation.
Data not obtained. Mean values presented unless otherwise specified.
Ataxia rating scale
The scale for the assessment and rating of ataxia (SARA) is a brief, semi‐quantitative clinical scale used to assess a range of different impairments in ataxia. 14 , 15 This scale was administered to determine the concurrent validity of the wearable sensor data for quantification of ataxia. There are eight test items, including gait, stance, sitting, speech, finger‐chase test, nose‐finger test, fast alternating movements, and the heel‐shin test. The items have a cumulative score ranging from 0 (no ataxia) to 40 (most severe ataxia).
MRI severity score
We adapted an MRI severity score previously used in X‐ALD that correlates with the severity of neurologic involvement in the disorder. 16 A visual scoring method was based on a point system (range, 0–40) derived from the location of white matter involvement and the presence of any atrophy. The score was modified for LBSL to include more specific regions of the projection fibers and cerebellum (Table S1). All T2‐weighted MR images were scored by a neuroradiologist who was blinded to the participants' neurologic exams.
Neuromotor tests
Walking and balance tests were performed during remote visits at participants' homes using wearable sensor technology (OPAL™ System; APDM, Portland, OR). For remote visits, a laptop, web camera, and an OPAL system kit were mailed to participants prior to the prescheduled visit date. A written manual was provided to the participant prior to testing that included step‐by‐step instructions on the setup and operation of all equipment and an accompanying picture‐based guide. The walking and balance tests and the ataxia rating scale were also depicted in the manual. Visits took place via secure connection through Zoom™. Zoom allows the study staff to remotely control the operation of the OPAL system software during testing. Trials were supervised by two trained study staff members remotely via web camera, so although study staff were not present on site, it was possible to repeat a test as needed if a sensor alert occurred, or if the test instructions were not executed according to protocol.
During the 1‐h scheduled visit, quantitative measures of gait and balance were obtained using the OPAL sensors. The system consists of three watch‐sized battery‐based accelerometers that submit synchronized signals to a central sensor through ultra‐low power radio frequency waves not known to cause any harm. The accelerometers were placed on the participants' waist and feet during the assessments. Two trials were collected for each walking and balance test during the visit following the established OPAL System protocols. 8
To setup the Walk Test, participants were instructed to designate a level, unobstructed walking path of 20 ft in their home and mark the start/stop points with a marker and measuring tape provided in the kit. To assess gait, a 2‐min Walk Test was performed, during which the participant walks in a straight line at a comfortable, natural pace, turns around at the stop point, and walks back to the original start point over a duration of 2 min. MobilityLab software was used to analyze the walk trials according to proprietary algorithms (APDM).
Four variations of the Balance Test were conducted to measure the participants' postural sway while standing still for 30 sec. The participants stood with their eyes open with their feet apart, eyes open with their feet together, eyes closed with their feet apart, and eyes closed with their feet together. The OPAL kit included a foot plate that was used to standardize stance width with the feet apart. MobilityLab software was also used for the analysis of the balance trials (APDM).
Quality of life assessment
A web‐based quality of life survey, the Neuro‐QOL™ (Quality of Life in Neurological Disorders, Health Measures, Bethesda, MD), was administered to participants via secure REDCap software (Research Electronic Database Capture, Vanderbilt, TN). The Neuro‐QOL consists of norm‐referenced scales addressing the physical, emotional, and social impacts of neurological disease. Physical health subscores included fatigue, pain, lower extremity function (mobility), and upper extremity function (fine motor, ADL). Mental Health subscores included anxiety, depression, anger, cognitive function, and stigma. Social health queried social relationships (Interaction with Peers). Depending on participant age, the survey was completed by either the participant or their caregiver.
Statistical analyses
Given the small sample size, statistical analyses were performed using nonparametric tests, and data points for each individual participant were displayed in the walking and sway figures. Mann–Whitney U tests and Kruskall–Wallis tests were employed to compare differences between LBSL and control participant gait and sway parameters, respectively. Spearman's rank order correlations were used to test the concurrent validity of the OPAL sensor data in comparison with the SARA ataxia score. Statistical significance was determined by p < 0.05.
Results
Study cohort clinical characteristics
Eight patients out of 11 recruited are included in this paper, three were excluded due to young age and/or ability to follow‐instructions (for which we have full complement of walking and sway data) Table 1 outlines the clinical characteristics of the LBSL cohort of eight patients. The median age range of the group was 10 years (range 5–23 years) consisting of five males and three female subjects, while the median age of the control cohort was 9 years (range 5–23 years). The mean age of onset of motor symptoms was 4.5 years of age, and the majority of patients had mild impairment in gross and fine motor function scores (mean GMFCS 1.3, MACS 1.1) and mild–moderate ataxia scores (mean SARA 8.7). The modified Loes MRI scores ranged from 3 to 22 with a mean of 10.6 (total scale of 0–40). Five of eight patients reported transient, episodic worsening of motor symptoms during a fever, viral illness, or concussion with return to baseline within days. All participants were able to follow study instructions without difficulty. Neurological exam findings from chart review for each patient are further detailed in Figure S2. In summary, many patients exhibited muscle weakness, hypotonia, and hyperreflexia. Nearly all exhibited dysmetria, ataxia, a positive Romberg sign, and decreased vibration sense.
Quality of life in LBSL
Neuro‐QOL results demonstrated that one participant experienced Fatigue 1.8 SD below the population reference mean, indicating low energy and fatigue that limits participation in household, social, or community activities. Cognitive complaints between 1 and 2 SD below the population average were reported for three participants which encompasses trouble focusing or concentrating, forgetting things, difficulty following complex tasks, or instructions and managing daily activities. The Mobility score assesses the ability to move well enough to make practical mobile transitions at home and in the community, and the stigma score assesses self‐reported embarrassment, limited inclusion in activities, negative perceptions of others or avoidance of forming new relationships related to one's illness. Although these scores were in the average range for the participants (mobility mean T‐score = 50 [range 43–58]), stigma mean T‐score = 45 [range 37–53]), higher SARA ataxia scores (mean 8.7, SD 4.9) were correlated with poorer Mobility scores (r = −0.93, p = 0.008) and a greater perception of stigma (r = 0.64, p = 0.173).
Gait variables obtained at home
During Walk Tests performed at home, the LBSL cohort did not exhibit significant differences (p < 0.05) compared with the control cohort in stride length (1.11 ± 0.02 vs. 1.05 ± 0.02 m, p = 0.10), gait cycle duration (1.02 ± 0.01 vs. 1.05 ± 0.02 sec, p = 0.37), or stride velocity (1.11 ± 0.03 vs. 1.02 ± 0.03 m/sec, p = 0.06) compared with age and sex‐matched controls (Fig. 1A). While not statistically significant, in the small sample size, between the groups there was a mean difference of 0.09 m/sec for walk velocity. Importantly, a stride velocity difference of 0.1 m/sec has been agreed upon as clinically meaningful. 17 Overall, the cadence (steps/min) during the 2 min trial was similar for LBSL patients compared with control subjects (121 ± 1.9 vs. 116 ± 1.9 s/m, p = 0.413) (Fig. 1B). A greater percentage of the total gait cycle time spent in double support (both feet in contact with the ground during the stance phase) versus single support (one foot in contact with the ground during the swing phase) has been used as an indicator of gait instability or ataxia. 18 However, the LBSL and control cohorts spent an equal percentage of the gait cycle time in double support (18.8 ± 0.7% vs. 18.9 ± 1%, p = 0.75) and single support (40.8 ± 0.7% vs. 40.8 ± 0.4%, p = 0.93) (Fig. 1C).
Figure 1.
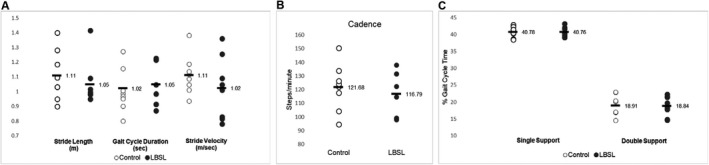
Individual values of control and LBSL participants are plotted for the (A) stride length (forward distance travelled by the foot during a gait cycle), gait cycle duration (duration of a full gait cycle, measured from the left foot's initial contact to the next initial contact of the left foot) and stride velocity (forward speed of the subject, measured as the stride length divided by the gait cycle duration), (B) cadence (number of steps per minute), and (C) single support (percentage of the gait cycle in which the opposite foot is not touching the ground) and double support (percentage of the gait cycle in which both feet are on the ground) time during a 2‐min walking test. The horizontal black bar is labeled with the cohort mean value. LBSL, leukoencephalopathy with brainstem and spinal cord involvement and lactate elevation.
During three consecutive steps of the same foot, the lateral step variability (LSV) is calculated from the medial and lateral deviations of the 2nd foot placement from an imagined straight line connecting the 1st and 3rd foot placement, and higher values indicate a veering or stumbling gait pattern. The LBSL subjects demonstrated greater LSV compared to age and sex‐matched controls (5.6 ± 0.6 vs. 3.7 ± 0.4 cm, p < 0.001) (Fig. 2A). The elevation of the foot at mid‐swing was increased for LBSL patients versus controls (2.5 ± 0.2 vs. 2.0 ± 0.2 cm, p = 0.02). Gait circumduction, the maximum lateral distance of the foot as it travels forward during the swing phase of the gait cycle, is typically seen when spasticity or leg weakness are present. Differences in circumduction did not reach statistical significance (3.5 ± 0.7 vs. 3.0 ± 0.5 cm, p = 0.60) (Fig. 2B).
Figure 2.
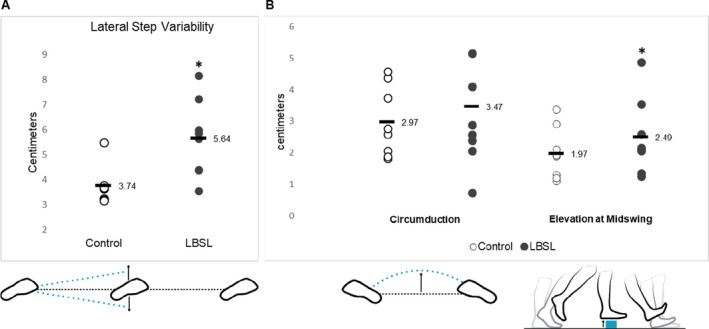
Individual values of control and LBSL participants are plotted for the (A) lateral step variability (when considering three consecutive foot placements made by the same foot, this describes the variability of perpendicular deviations of the middle foot placement from the line connecting the first and the third, with positive values indicating movement to the outside), (B) circumduction (the maximum amount that the foot travels perpendicular to forward movement during an individual stride, with positive values indicating movement to the outside) and (C) elevation at midswing (the height of the foot sensor measured at midswing, relative to its start position while standing) during the 2‐min walking test. The horizontal black bar is labeled with the cohort mean value. *p < 0.01. Illustrations reprinted with permission from APDM an ERT Company 2019, Mobility Lab White Paper, retrieved from https://www.apdm.com/. LBSL, leukoencephalopathy with brainstem and spinal cord involvement and lactate elevation. [Colour figure can be viewed at wileyonlinelibrary.com]
Balance variables obtained at home
For all balance variables reported there were differences between the LBSL and control cohort means, and the effect sizes were greatest in the stance conditions in which participants' eyes were closed. The mean cohort sway paths plotted over a 30‐sec trial in each condition are visually represented in Figure 3A. Quantification of the LBSL cohort sway in the sagittal (anteroposterior) plane averaged over a 30‐sec trial compared with the sway of age‐matched controls show a robust increase in the LBSL cohort's sway path length and sway area in the feet apart eyes closed (path 33 ± 8 vs. 8 ± 1 m/sec2, p < 0.001, area 0.9 ± 0.4 vs. 0.07 ± 0.02 m2/s4, p < 0.001) and feet together eyes closed (path 55 ± 15 vs. 13 ± 3 m/sec2, p < 0.001, area 2.1 ± 0.6 vs. 0.3 ± 0.1 m2/s4, p = <0.001) conditions (Fig. 3B and C). The sway jerk was also robustly increased for LBSL patients in feet apart, eyes closed and feet together eyes closed stances, respectively (90 ± 36 vs. 5 ± 2 m2/s5, p < 0.001) and 266 ± 109 vs. 15 ± 6 m2/s5, p = 0.001) (Fig. 3D). To further evaluate the impact of removing visual input on sway, a mean Romberg quotient was calculated for both cohorts. The Romberg quotient was significantly increased for LBSL participants (5.8 ± 1.9 vs. 1.7 ± 0.5, p < 0.001) (Fig. 3E).
Figure 3.

(A) The mean sway paths of the control and LBSL cohorts are plotted across four postural sway conditions, feet apart eyes open (FAEO), feet apart eyes closed (FAEC), feet together eyes open (FTEO), and feet together eyes closed (FTEC). Trial duration is 30 sec. (B–D) Graphs represent the quantified mean path length (total length of the sway path in the anterior/posterior direction), jerk (smoothness of sway from the time derivative of the sway path in the anterior/posterior direction), and sway area (the area of an ellipse covering 95% of the sway angle in the coronal and sagittal planes) of the control and LBSL cohorts. (E) A Romberg Quotient was calculated for each individual as the sway area with the feet apart eyes closed divided by the sway area with the feet apart and eyes open. The graph represents the mean Romberg Quotient for the control and LBSL groups. *p < 0.01 control versus LBSL. LBSL, leukoencephalopathy with brainstem and spinal cord involvement and lactate elevation.
Ataxia score correlations
There was a moderate positive association (R = 0.84, p < 0.01) between LSV and the ataxia score (Fig. S2A). The SARA score was also positively associated (R = 0.83, p = 0.01) with the sway area during sway in the feet together, eyes closed condition, which challenges both cerebellar function and proprioception (Fig. S2B). A relationship was not found between the MRI score and the SARA score (R = 0.21, p = 0.65) (Fig. S2C).
Discussion
This study describes a novel and feasible approach for performing clinical rating scales and assessing quantitative gait and balance measures using wearable technology at home without the assistance of any on‐site staff. This approach is accessible, because data acquisition requires only minimal set up and basic instructions. The equipment is portable, making it useful in different settings and over serial visits. Furthermore, this is the first study to investigate accelerometer‐based quantitative assessments in patients with a leukodystrophy, and we anticipate that this approach will be applicable to related leukodystrophies.
The OPALs sensors detected several gait parameter differences between LBSL subjects and controls. Of these parameters, the LSV was strongly associated with the SARA score, and thus likely reflects cerebellar or sensory ataxia. Variability in step placement, which the LSV estimates, is the hallmark of ataxia. Cerebellar ataxia in particular is characterized by the inability to control the rate and range of stepping movements, which is usually manifested by an exaggerated step. 19 The LSV may also be a compensatory adjustment during gait to preserve balance. Lateral balance may depend on integrative sensorimotor control through adjustment of step width, such that greater balance instability is associated with greater variability in step width, even after accounting for walking speed. 20 Lateral (side‐to‐side) movements in walking are important because humans are inherently more unstable laterally, which contributes to sideways falls and fractures in older adults. A balance preservation strategy is to redirect lateral center of mass accelerations in the opposite direction, which can be easily accomplished by lateral placement of the foot on the next step. 21 Furthermore, lateral balance during walking appears to require active control and exact an energetic cost. 22 , 23
Decreases in stride length, velocity, and cadence are commonly reported in other ataxic disorders such as spinocerebellar degeneration, FA, and other cerebellar ataxias. 24 , 25 Each of these mean values were decreased in LBSL, but significant differences were not seen, which may reflect a contribution of the small sample size. Similarly, the double and single support times were in the normal range. It is possible that these patients with mild disease are using compensatory strategies (i.e., variability in foot placement and angle) effectively to preserve many of the typical features of a normal gait cycle. Since variability is a hallmark of ataxia, measures that focus on variability of gait between gait cycles rather than mean differences in gait parameter values for a full walk trial may be more salient in LBSL.
An increase in the elevation of the step at mid‐swing, also called a high steppage gait, has been reported in a wide range of disorders in addition to cerebellar ataxia, 18 including those featuring a peripheral neuropathy, such as diabetes and Charcot–Marie Tooth disease as well as those with spinal cord lesions such as MS, compressive myelopathy, or spastic hemiplegia. High steppage gait is likely due to one of two reasons, (1) poor proprioception, so individuals lift their legs higher because they cannot sense where their foot is in space and this avoids tripping over an obstacle; and (2) a movement in cerebellar ataxia because of difficulty coordinating multiple joints in a controlled manner. 26
Dorsal column involvement as potentially key factor in disease severity
Overall, our postural sway data showed that LBSL patients exhibit significant sway instability compared to controls while standing, especially when the eyes are closed. This may suggest that LBSL patients exhibit significant sensory ataxia, which is supported by our finding of a large Romberg quotient during postural sway testing. This is interesting considering that there are extensive T2 signal abnormalities involving the entire length of the spinal cord dorsal columns in all reported LBSL cases. 27 Furthermore, the finding of no linear association between the MRI severity score and the ataxia score is not surprising, since the MRI score quantifies white matter changes in the brain but not the spinal cord. Sway instability during standing has also been observed in adrenomyeloneuropathy and MS that is directly correlated to DTI measures of white matter integrity of the dorsal columns and clinical disability scores. 28 , 29 Furthermore, in MS, an increased Romberg quotient (sway area with eyes closed/sway area with eyes open) is reflective of proprioceptive contributions of dorsal column‐medial lemniscus pathway fibers. 30 Therefore, the myelopathy seen in LBSL may be an important contributor to the overall motor disability experienced by these patients. However, in a study of patients with Friedreich's ataxia, in subjects with lower vermis lesions and hemispheric cerebellar lesions, the most effective parameters to detect postural instability were the sway path and sway area when the stabilizing effect of vision was suppressed by eye closure. 31 In LBSL, white matter T2 changes in the cerebellum, spinocerebellar connections of the inferior cerebellar peduncle, and the spinal cord are present in this disease, so correlating the quantitative sensory motor data with the MRI lesion burden throughout the neuroaxis may more specifically localize the gait and balance deficits.
The finding that signs of ataxia can be detected with wearable accelerometers during walking and sway tests is important information to provide patients to guide appropriate interventions with their physical therapist and neurologist. For instance, balance and coordination exercises have been shown to help children with cerebellar ataxia improve their walking. 32 Use of the wearable sensors may also allow improvements to be measured post‐intervention. Furthermore, unlike a clinical scale, the use of accelerometry is quantitative and limits the subjectivity of measuring ataxia.
A long‐term objective of this research is to identify clinically meaningful disease outcome measures at the end of a 5‐year longitudinal study, which will be necessary for future clinical trials. In this cross‐sectional study, we found that the degree of ataxia is correlated with a patient's perception of their own mobility and how they are viewed by peers as being impaired (stigma). As a next step, we will evaluate if this impact on quality of life is persistent, or changes over time in response to quantitative worsening of ataxia. It has also been widely reported that walking speed is related to quality of life in other neurological disorders. 33 , 34
Study limitations
A limitation of this study is the small sample size. However, we acknowledge that this is primarily a feasibility study, a goal of which is to demonstrate that collection of these walking and sway variables is possible in patients with a wide age range. We continue recruiting for a longitudinal study, and anticipate that a larger sample size and repeated measures will further delineate the optimal gait and balance parameters to measure change over time in this population. Another limitation is the age of our youngest participants. While the OPAL variables have shown validity in a cohort of approximately 200 children as young as 5 years of age, 35 , 36 the validity of SARA testing has not been established in participants younger than 8 years of age; we therefore are conservative in our conclusions, although this is the only clinical ataxia measure available for children. 37 All participants had typical cognitive ability and no difficulty following the instructions. Furthermore, the age‐matched healthy control comparisons reported for all OPALs variables is expected to account for any minor differences in the ability to comply with instructions solely based on age.
Finally, it is important to acknowledge that in accelerometer‐based systems compared with other systems that quantify gait and balance parameters, the time (seconds) captured by the accelerometers during a trial is actual, but the length (meters) is estimated based on integration of the acceleration signal statistical parameters, magnetometer, and gyroscope parameters using a causal Kalman filter. 38 This must be considered against the value of a low‐cost, reliable tool for quantifying neuromotor variables for remote studies.
Conclusion
In summary, this study demonstrates the feasibility of using wearable accelerometers to measure walking and balance impairment in LBSL patients without requiring a visit on‐site for data collection. This approach can be applied to related rare diseases that feature ataxia, in which study numbers are low, and removing barriers to participation is critical for research and biomarker development to continue. The gait and balance results appear to reflect the contribution of both cerebellar and dorsal column pathology to ataxia in LBSL, which is useful information with the potential to inform clinical therapeutic interventions.
Conflict of Interests
Amena Smith Fine: Employment – Kennedy Krieger Institute – Assistant Professor; Miriam Kaufman: None; Jordan Goodman: Employment – Kennedy Krieger Institute – Research Coordinator; Bela Turk: Employment – Kennedy Krieger Institute – Postdoctoral Fellow; Amy Bastian: Honoraria for invited talks: Stanford: 1500; Vanderbilt: 200; Grants: NIH T32 HD007414; NIH R01 HD040289; NIH R37 NS090610; Joey’s Foundation; Employment – Kennedy Krieger Institute – Chief Science Officer; Doris Lin: Employment – Johns Hopkins University School of Medicine – Associate Professor; Consultant/Independent Contractor – ICON Medical Imaging; Grants – DOD/CDMRP W81XWH2010819; S. Ali Fatemi: Employment – Kennedy Krieger Institute – Chief Medical Officer; Paid member of drug safety monitoring board – Bluebird Bio; NIH US4HD079123, NIH U54NS115052, A Cure for Ellie Foundation; Jennifer Keller: Employment – Kennedy Krieger Institute – research physical therapist, no independent funding; Independent Contractor – New Beginning Pediatric Rehabilitation.
Supporting information
Figure S1. Representative T2 weighted MR images of the brain and spinal cord in LBSL.
Figure S2. The scale for the assessment and rating of ataxia (SARA) score is plotted on the x‐axis against the (A) lateral step variability, (B) 95% Ellipse Sway Area, and (C) the modified Loes score on the y‐axis, with each line of best fit shown.
Table S1. Italicized regions represent expansions of the original Loes score to quantify white matter changes commonly reported in LBSL.
Acknowledgment
The authors would like to acknowledge Chris Joseph, DPT for his contributions to logistical planning of the virtual visits and consultation regarding the wearable technology chosen for this study.
Funding InformationThis work was supported by NIH (grant/award number: “T32 HD007414”, “U54NS115052”, “US4HD079123”).
Funding Statement
This work was funded by NIH grants T32 HD007414, U54NS115052, and US4HD079123.
References
- 1. Scheper GC, van der Klok T, van Andel RJ, et al. Mitochondrial aspartyl‐tRNA synthetase deficiency causes leukoencephalopathy with brain stem and spinal cord involvement and lactate elevation. Nat Genet. 2007;39:534‐539. [DOI] [PubMed] [Google Scholar]
- 2. van Berge L, Hamilton EM, Linnankivi T, et al. Leukoencephalopathy with brainstem and spinal cord involvement and lactate elevation: clinical and genetic characterization and target for therapy. Brain. 2014;137:1019‐1029. [DOI] [PubMed] [Google Scholar]
- 3. van Berge L, Dooves S, van Berkel CG, Polder E, van der Knaap MS, Scheper GC. Leukoencephalopathy with brain stem and spinal cord involvement and lactate elevation is associated with cell‐type‐dependent splicing of mtAspRS mRNA. Biochem J. 2012;441:955‐962. [DOI] [PubMed] [Google Scholar]
- 4. van der Knaap MS, van der Voorn P, Barkhof F, et al. A new leukoencephalopathy with brainstem and spinal cord involvement and high lactate. Ann Neurol. 2003;53:252‐258. [DOI] [PubMed] [Google Scholar]
- 5. Fine AS, Nemeth CL, Kaufman ML, Fatemi A. Mitochondrial aminoacyl‐tRNA synthetase disorders: an emerging group of developmental disorders of myelination. J Neurodev Disord. 2019;11:29. [DOI] [PMC free article] [PubMed] [Google Scholar]
- 6. O'Sullivan M, Blake C, Cunningham C, Boyle G, Finucane C. Correlation of accelerometry with clinical balance tests in older fallers and non‐fallers. Age Ageing. 2009;38:308‐313. [DOI] [PubMed] [Google Scholar]
- 7. Maetzler W, Mancini M, Liepelt‐Scarfone I, et al. Impaired trunk stability in individuals at high risk for Parkinson's disease. PLoS One. 2012;7:e32240. [DOI] [PMC free article] [PubMed] [Google Scholar]
- 8. Mancini M, King L, Salarian A, Holmstrom L, McNames J, Horak FB. Mobility lab to assess balance and gait with synchronized body‐worn sensors. J Bioeng Biomed Sci. 2011;suppl 1:007. [DOI] [PMC free article] [PubMed] [Google Scholar]
- 9. Mancini M, Salarian A, Carlson‐Kuhta P, et al. ISway: a sensitive, valid and reliable measure of postural control. J Neuroeng Rehabil. 2012;9:59. [DOI] [PMC free article] [PubMed] [Google Scholar]
- 10. Mancini M, Carlson‐Kuhta P, Zampieri C, Nutt JG, Chiari L, Horak FB. Postural sway as a marker of progression in Parkinson's disease: a pilot longitudinal study. Gait Posture. 2012;36:471‐476. [DOI] [PMC free article] [PubMed] [Google Scholar]
- 11. Burk K, Sival DA. Scales for the clinical evaluation of cerebellar disorders. Handb Clin Neurol. 2018;154:329‐339. [DOI] [PubMed] [Google Scholar]
- 12. Shirai S, Yabe I, Takahashi‐Iwata I, et al. The responsiveness of triaxial accelerometer measurement of gait ataxia is higher than that of the Scale for the Assessment and Rating of Ataxia in the early stages of spinocerebellar degeneration. Cerebellum. 2019;18:721‐730. [DOI] [PubMed] [Google Scholar]
- 13. Dorsey ER, Venuto C, Venkataraman V, Harris DA, Kieburtz K. Novel methods and technologies for 21st‐century clinical trials: a review. JAMA Neurol. 2015;72:582‐588. [DOI] [PMC free article] [PubMed] [Google Scholar]
- 14. Weyer A, Abele M, Schmitz‐Hubsch T, et al. Reliability and validity of the scale for the assessment and rating of ataxia: a study in 64 ataxia patients. Mov Disord. 2007;22:1633‐1637. [DOI] [PubMed] [Google Scholar]
- 15. Lawerman TF, Brandsma R, Verbeek RJ, et al. Construct validity and reliability of the SARA gait and posture sub‐scale in early onset ataxia. Front Hum Neurosci. 2017;11:605. [DOI] [PMC free article] [PubMed] [Google Scholar]
- 16. Loes DJ, Fatemi A, Melhem ER, et al. Analysis of MRI patterns aids prediction of progression in X‐linked adrenoleukodystrophy. Neurology. 2003;61:369‐374. [DOI] [PubMed] [Google Scholar]
- 17. Fritz S, Lusardi M. White paper: “walking speed: the sixth vital sign”. J Geriatr Phys Ther. 2009;32:46‐49. [PubMed] [Google Scholar]
- 18. Stolze H, Klebe S, Petersen G, et al. Typical features of cerebellar ataxic gait. J Neurol Neurosurg Psychiatry. 2002;73:310‐312. [DOI] [PMC free article] [PubMed] [Google Scholar]
- 19. Morton SM, Bastian AJ. Cerebellar control of balance and locomotion. Neuroscientist. 2004;10:247‐259. [DOI] [PubMed] [Google Scholar]
- 20. Collins SH, Kuo AD. Two independent contributions to step variability during over‐ground human walking. PLoS One. 2013;8:e73597. [DOI] [PMC free article] [PubMed] [Google Scholar]
- 21. Dingwell JB, Cusumano JP. Humans use multi‐objective control to regulate lateral foot placement when walking. PLoS Comput Biol. 2019;15:e1006850. [DOI] [PMC free article] [PubMed] [Google Scholar]
- 22. Dean JC, Alexander NB, Kuo AD. The effect of lateral stabilization on walking in young and old adults. IEEE Trans Biomed Eng. 2007;54:1919‐1926. [DOI] [PubMed] [Google Scholar]
- 23. Kuo AD, Donelan JM. Dynamic principles of gait and their clinical implications. Phys Ther. 2010;90:157‐174. [DOI] [PMC free article] [PubMed] [Google Scholar]
- 24. Shirai S, Yabe I, Matsushima M, Ito YM, Yoneyama M, Sasaki H. Quantitative evaluation of gait ataxia by accelerometers. J Neurol Sci. 2015;358:253‐258. [DOI] [PubMed] [Google Scholar]
- 25. Buckley E, Mazza C, McNeill A. A systematic review of the gait characteristics associated with cerebellar ataxia. Gait Posture. 2018;60:154‐163. [DOI] [PubMed] [Google Scholar]
- 26. Bastian AJ. Mechanisms of ataxia. Phys Ther. 1997;77:672‐675. [DOI] [PubMed] [Google Scholar]
- 27. Kassem H, Wafaie A, Abdelfattah S, Farid T. Leukoencephalopathy with brainstem and spinal cord involvement and lactate elevation (LBSL): assessment of the involved white matter tracts by MRI. Eur J Radiol. 2014;83:191‐196. [DOI] [PubMed] [Google Scholar]
- 28. Zackowski KM, Dubey P, Raymond GV, Mori S, Bastian AJ, Moser HW. Sensorimotor function and axonal integrity in adrenomyeloneuropathy. Arch Neurol. 2006;63:74‐80. [DOI] [PubMed] [Google Scholar]
- 29. Reich DS, Smith SA, Jones CK, et al. Quantitative characterization of the corticospinal tract at 3 T. AJNR Am J Neuroradiol. 2006;27:2168‐2178. [PMC free article] [PubMed] [Google Scholar]
- 30. Fling BW, Dutta GG, Schlueter H, Cameron MH, Horak FB. Associations between proprioceptive neural pathway structural connectivity and balance in people with multiple sclerosis. Front Hum Neurosci. 2014;8:814. [DOI] [PMC free article] [PubMed] [Google Scholar]
- 31. Diener HC, Dichgans J, Bacher M, Gompf B. Quantification of postural sway in normals and patients with cerebellar diseases. Electroencephalogr Clin Neurophysiol. 1984;57:134‐142. [DOI] [PubMed] [Google Scholar]
- 32. Schatton C, Synofzik M, Fleszar Z, Giese MA, Schols L, Ilg W. Individualized exergame training improves postural control in advanced degenerative spinocerebellar ataxia: a rater‐blinded, intra‐individually controlled trial. Parkinsonism Relat Disord. 2017;39:80‐84. [DOI] [PubMed] [Google Scholar]
- 33. Pirpiris M, Gates PE, McCarthy JJ, et al. Function and well‐being in ambulatory children with cerebral palsy. J Pediatr Orthop. 2006;26:119‐124. [DOI] [PubMed] [Google Scholar]
- 34. Pirpiris M, Wilkinson AJ, Rodda J, et al. Walking speed in children and young adults with neuromuscular disease: comparison between two assessment methods. J Pediatr Orthop. 2003;23:302‐307. [PubMed] [Google Scholar]
- 35. Voss S, Joyce J, Biskis A, et al. Normative database of spatiotemporal gait parameters using inertial sensors in typically developing children and young adults. Gait Posture. 2020;80:206‐213. [DOI] [PMC free article] [PubMed] [Google Scholar]
- 36. Voss S, Zampieri C, Biskis A, et al. Normative database of postural sway measures using inertial sensors in typically developing children and young adults. Gait Posture. 2021;90:112‐119. [DOI] [PMC free article] [PubMed] [Google Scholar]
- 37. Lawerman TF, Brandsma R, Burger H, et al. Age‐related reference values for the pediatric Scale for Assessment and Rating of Ataxia: a multicentre study. Dev Med Child Neurol. 2017;59:1077‐1082. [DOI] [PubMed] [Google Scholar]
- 38. El‐Gohary M, McNames J. Human joint angle estimation with inertial sensors and validation with a robot arm. IEEE Trans Biomed Eng. 2015;62:1759‐1767. [DOI] [PubMed] [Google Scholar]
Associated Data
This section collects any data citations, data availability statements, or supplementary materials included in this article.
Supplementary Materials
Figure S1. Representative T2 weighted MR images of the brain and spinal cord in LBSL.
Figure S2. The scale for the assessment and rating of ataxia (SARA) score is plotted on the x‐axis against the (A) lateral step variability, (B) 95% Ellipse Sway Area, and (C) the modified Loes score on the y‐axis, with each line of best fit shown.
Table S1. Italicized regions represent expansions of the original Loes score to quantify white matter changes commonly reported in LBSL.