Abstract
Ferroptosis plays a key role in the death of cells including cardiomyocytes, and it is related to a variety of cardiac diseases. However, the role of ferroptosis‐related genes (FRGs) in coronary artery disease (CAD) is not well characterized. We downloaded CAD‐related information and FRGs from the gene expression omnibus (GEO) database and Ferroptosis Database (FerrDb) respectively. A total of 10 CAD‐related DE‐FRGs were obtained, which were closely linked to autophagy regulation and immune response. Subsequently, CA9, CBS, CEBPG, HSPB1, SLC1A4, STMN1 and TRIB3 among the 10 DE‐FRGs were identified as marker genes by LASSO and SVM‐RFE algorithms, which had tolerable diagnostic capabilities. Subsequent functional enrichment analysis showed that these marker genes may play a corresponding role in CAD by participating in the regulation of immune response, amino acid metabolism, cell cycle and multiple pathways related to the pathogenesis of CAD. Furthermore, a total of 58 drugs targeting 7 marker genes had been obtained. On the contrary, the ceRNA network revealed a complex regulatory relationship based on the marker genes. Also, CIBERSORT analysis showed that the changes in the immune microenvironment of CAD patients may be related to CBS, HSPB1 and CEBPG. We developed a diagnostic potency and provided an insight for exploring the mechanism for CAD. Before clinical application, further research is needed to test its diagnostic value for CAD.
Keywords: bioinformatics, cardiac, coronary artery disease, diagnostic, ferroptosis, immune microenvironment
1. INTRODUCTION
Coronary artery disease (CAD) is a type of disease in which the lumen is narrowed or blocked due to atherosclerotic lesions in the coronary artery, resulting in myocardial ischaemia, oxygen deprivation and necrosis. CAD is one of the highest mortality diseases in the world, with an estimated 12 million deaths due to coronary atherosclerosis by the end of 2030, including non‐ST‐segment elevation myocardial infarction and ST segment elevation myocardial infarction. 1 The pathogenesis of CAD is complex, and there are no obvious symptoms in the early stage, only abnormal ST‐T changes during exercise plate electrocardiogram examination. Therefore, it is an urgent need for biomarkers that can be detected in peripheral blood to facilitate the early detection of CAD.
Ferroptosis is an iron‐dependent programmed cell death mode newly discovered in 2012, 2 with its mechanism different from apoptosis, necrosis, pyroptosis and autophagy. Ferroptosis is characterized by mitochondrial atrophy and increased mitochondrial membrane density, the accumulation of iron and lipid reactive oxygen species (L‐ROS) and the involvement of a unique set of genes. 3 , 4 The biochemical mechanism of iron is catalysed by the formation of lipid radicals and the depletion of glutathione (GSH) or the inactivation of lipid peroxidase 4 (GPX4). 5 Circulating iron plays a key role in the development of iron death. The use of iron chelating agents can inhibit iron death induced by Erastin, and the expression of transferrin on the cell membrane also increases the sensitivity of cells to iron death. 2
Ferrostatin 1 (FER‐1), a specific inhibitor of ferroptosis, significantly reduced the cardiotoxicity induced by doxorubicin (DOX) and effectively improved the survival rate in mice treated with cell death inhibition and cell death pathway‐related gene knockout, revealing that ferroptosis is an important mechanism of myocardial injury. 6 In addition, high levels of L‐ferritin were observed in the coronary arteries of patients with coronary heart disease, indicating iron accumulation in atherosclerotic plaques. 7 Non‐transferrin‐bound iron (NTBI) is thought to be the pathologic trigger of iron overload, and iron in NTBI is more likely to be utilized by various plaque cell types, including endothelial cells, macrophages and vascular smooth muscle cells. 8 The use of deferoxamine can inhibit the development of atherosclerotic lesions and reduce ferroptosis of cardiomyocytes following cardiac ischaemic‐reperfusion. 9 , 10 Therefore, we analysed and verified the accuracy of iron death‐related genes as biomarkers of CAD and their roles in the cardiac immune microenvironment via bioinformatics analysis.
2. MATERIALS AND METHODS
2.1. Data source
In this study, the gene expression data for CAD and normal samples were obtained from the GEO database. The GSE20680 dataset embodied a total of 139 samples, including 52 normal samples and 87 CAD samples. This dataset was considered as a training set for analysis by the main body of this research. The GSE20681 dataset containing 99 normal samples and 99 CAD samples was used to verify the expression of the marker genes. Additionally, the FRGs (n = 259) used in this study were obtained from FerrDb, and the detailed genes were shown in Table S1.
Drug Gene Interaction Database (DGIdb) was used to predict drugs targeting marker genes. Also, the structural information of the targeted drugs of the marker gene was retrieved from the DrugBank database.
2.2. Differential expression analysis
We first extracted expression data of 237 FRGs (only 237 FRGs expressed in this dataset) in normal samples and CAD samples from the GSE20680 database. Subsequently, the student's t‐test in R was used to detect the FRGs that were differentially expressed in two different samples (Table S2). Genes with p < 0.05 were considered significant.
2.3. Functional enrichment performed in Metascape
Metascape (http://metascape.org/) was used to analyse the potential functions associated with DE‐FRGs. These analyses included Gene Ontology (GO), Reactome pathway enrichment, and Immunologic Signatures enrichment analysis (Table S3). Among them, Immunologic Signatures database used in the immunologic signatures enrichment analysis is based on the integration of the immune‐related enrichment analysis of the target gene in the published literature. In addition, Reactome is a database of articles written by experts and peer‐reviewed on various reactions and biological pathways in the human body.
2.4. Identification of optimal diagnostic gene biomarkers for CAD
The least absolute shrinkage and selection operator (LASSO) algorithm was applied with the glmnet package to reduce the dimensions of the data. 11 , 12 The DE‐FRGs between CAD patients and normal samples were retained for feature selection, and gene biomarkers for CAD were identified with the LASSO algorithms. Meanwhile, a support vector machine‐recursive feature elimination (SVM‐RFE) model was established with a SVM package, which was compared by the average misjudgement rates of their 10‐fold cross‐validations. 13 Furthermore, optimal gene biomarkers for CAD were identified by overlapping biomarkers derived from the two algorithms. The diagnostic ability of the optimal gene biomarkers was assessed by calculating the receiver operating characteristic (ROC) curve, and measuring the area under the curve (AUC), accuracy, sensitivity and specificity. Furthermore, a logistic regression model based on seven marker genes was constructed to predict the sample types in the GSE20680 dataset using the predict function through the R package glm. Similarly, the diagnostic power of the logistic regression model was evaluated using ROC curves.
2.5. Single‐gene Gene Set Enrichment Analysis (GSEA) enrichment analysis
This analysis is implemented in the GSEA (V.4.1.0) package in R. To further explore the related pathways of the seven marker genes, we calculated the correlation between the marker genes and all other genes in the GSE20680 dataset. Subsequently, all genes were sorted according to their correlations from high to bottom, and these sorted genes were considered to be the gene set to be tested. Meanwhile, the KEGG signalling pathway set was invoked as a predefined set to detect its enrichment in the gene set. Specific enrichment results of each marker gene were integrated into Table S4.
2.6. Single‐gene Gene Set Variation Analysis (GSVA) enrichment analysis
This analysis was implemented in the GSVA (V.1.38.0) package in R. GSVA is a gene set variation analysis. 14 In this study, we utilized the KEGG pathway set as the background gene set to perform GSVA analysis on each marker gene. Simultaneously, we applied the limma package to analyse the difference in GSVA score of the marker gene's high‐ and low‐expression group samples. The difference screening condition was |t| >2, p < 0.05. If t > 0, we considered the pathway to be activated in the high‐expression group, on the contrary, if t < 0, we considered the pathway to be activated in the low‐expression group. Specific enrichment results of each marker gene were integrated into Table S5.
2.7. Immune infiltration analysis
CIBERSORT, a method to characterize the cell composition of complex tissues from the gene expression profile. 15 In this study, we predicted the proportion of 22 types of infiltrating immune cell types in each tissue from the GSE20680 dataset by CIBESORT software (Table S6). For each sample, the sum of all evaluated immune cell type fractions equalled 1. 16
2.8. Construction of ceRNA network
The starBase database was used to predict mRNA‐miRNA interaction pairs based on the 7 marker genes. Meantime, RNA sequences of 7 marker genes were downloaded from National Center for Biotechnology Information (NCBI), and the human miRNA sequences were obtained from miRbase. The miranda software predicted the binding of mRNA‐miRNA nucleic acid, and the binding score threshold was increased to 170 (the default was 140). Then, we searched the predicted miRNA in starBase and screened miRNA‐lncRNA so that we obtained the ceRNA network of mRNA‐miRNA‐lncRNA.
2.9. Statistical analysis
The comparison between the two groups used the Student's t‐test. Pearson correlation analysis was used to reveal the relationship between 10 DE‐FRGs. The drawing of the Venn diagram was achieved through the Jvenn package. Cytoscape was used to visualize the ceRNA network. p < 0.05 was regarded as significant. All analyses were performed in R.
3. RESULTS
3.1. Identification of DE‐FRGs in the GSE20680 cohort
Ten of 237 FRGs were differentially expressed between CAD and normal samples, including 5 up‐regulated and 5 down‐regulated genes, which were identified from the GSE20680 dataset (Table 1). The clustering heatmap showed the expression pattern of DE‐FRGs among samples (Figure 1A). The correlation between these genes was presented in Figure 1B. HSPB1 had a negative correlation with ALOX5, CBS, CEBPG, ATG3 and HMGB1. ATG3 was positively correlated with ALOX5, CBS, CEBPG and HMGB1. Interestingly, TRIB3 and CA9 were not correlated with any DE‐FRGs.
TABLE 1.
Ten of 237 FRGs were differentially expressed between CAD and normal samples, including 5 up‐regulated and 5 down‐regulated genes
| Gene | p‐Value | Expressing trend |
|---|---|---|
| STMN1 | 0.013295 | DN |
| HSPB1 | 0.013299 | DN |
| CBS | 0.020652 | UP |
| HMGB1 | 0.027065 | UP |
| SLC1A4 | 0.027545 | DN |
| CEBPG | 0.03259 | UP |
| TRIB3 | 0.034862 | DN |
| ATG3 | 0.037813 | UP |
| ALOX5 | 0.039414 | UP |
| CA9 | 0.048775 | DN |
FIGURE 1.

DE‐FRGs expression levels in CAD. (A) Violin plots show expression patterns of DE‐FRGs across samples. (B) The correlation of these genes. HSPB1 had a negative correlation with ALOX5, ATG3, CBS, CEBPG and HMGB1. ATG3 was positively correlated with ALOX5, CBS, CEBPG and HMGB1. Interestingly, TRIB3 and CA9 were not correlated with any DE‐FRGs
3.2. Functional analyses for the DE‐FRGs
To elucidate the biological functions and pathways that were associated with the DE‐FRGs, GO enrichment and Reactome pathway analyses were perform. Consequently, GO enrichment analyses indicated that DE‐FRGs were significantly related to the function of ‘positive regulation of binding’, ‘autophagy’ and ‘positive regulation of cytokine production’ (Figure 2A). Reactome pathway analyses indicated that the signalling by receptor tyrosine kinases, cellular responses to stress and external stimuli were enriched (Figure 2B). Interestingly, the DE‐FRGs were also obviously enriched in many immune‐related signatures (Figure 2C). These pieces of evidence indicated that DE‐FRGs may play a role in the pathogenesis of CAD by participating in the regulation of autophagy, immune cells, cytokines and a variety of kinases.
FIGURE 2.
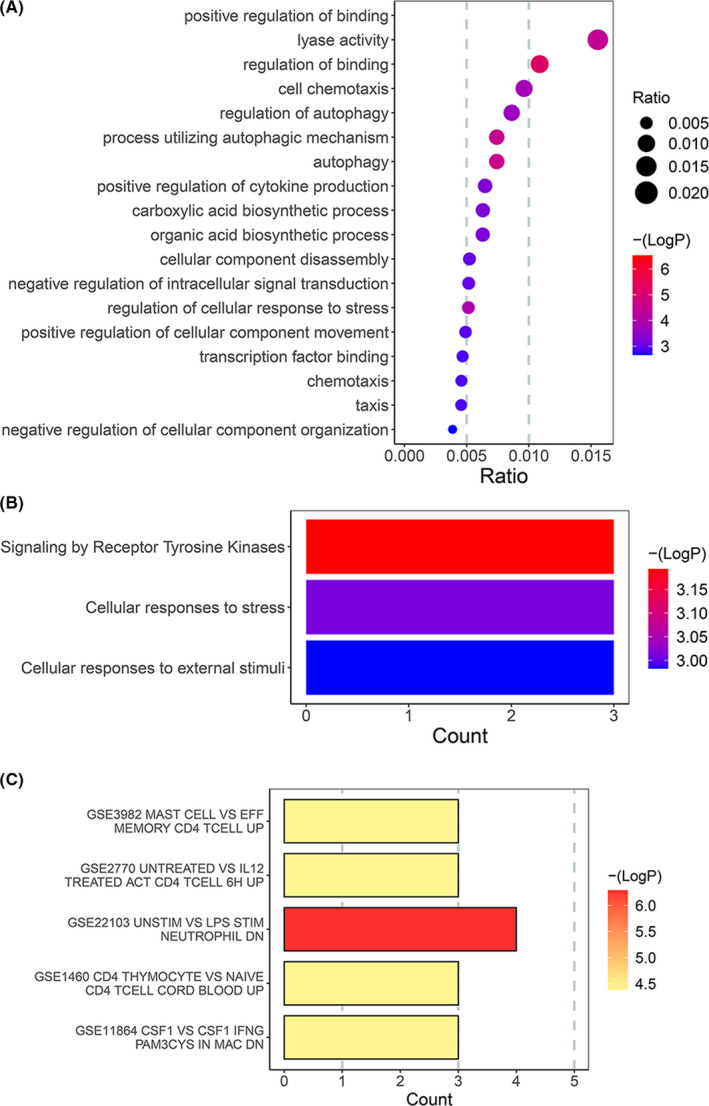
Functional analyses for the DE‐FRGs. (A) GO enrichment analyses indicated that DE‐FRGs were significantly related to the function of ‘positive regulation of binding’, ‘autophagy’ and ‘positive regulation of cytokine production’. (B) Reactome pathway analyses indicated that the cellular responses to stress, cellular responses to external stimuli, and signalling by receptor tyrosine kinases were enriched. (C) Enrichment analysis of immune characteristic gene sets
3.3. 7 DE‐FRGs were identified as diagnostic genes for CAD
For considering the variation between CAD patients and healthy people, we aimed to estimate the diagnostic potential of DE‐FRGs. Next, we performed two distinct machine learning algorithms in the GSE20680 dataset, the LASSO and SVM‐RFE, to screen the significant DE‐FRGs to distinguish CAD from normal people. LASSO logistic regression algorithm, with penalty parameter tuning conducted by 10‐fold cross‐validation, was used to select 9 CAD‐related features (Figure 3A,B). We then applied the SVM‐RFE algorithm to filter the 10 DE‐FRGs to identify the optimal combination of feature genes. Finally, 7 genes (maximal accuracy =0.759, minimal RMSE =0.241) were identified as the optimal feature genes (Figure 3C,D). The marker genes obtained from the LASSO and SVM‐RFE models were intersected, and 7 marker genes (CA9, CBS, CEBPG, HSPB1, SLC1A4, STMN1 and TRIB3) were identified for subsequent analysis (Figure 3E).
FIGURE 3.
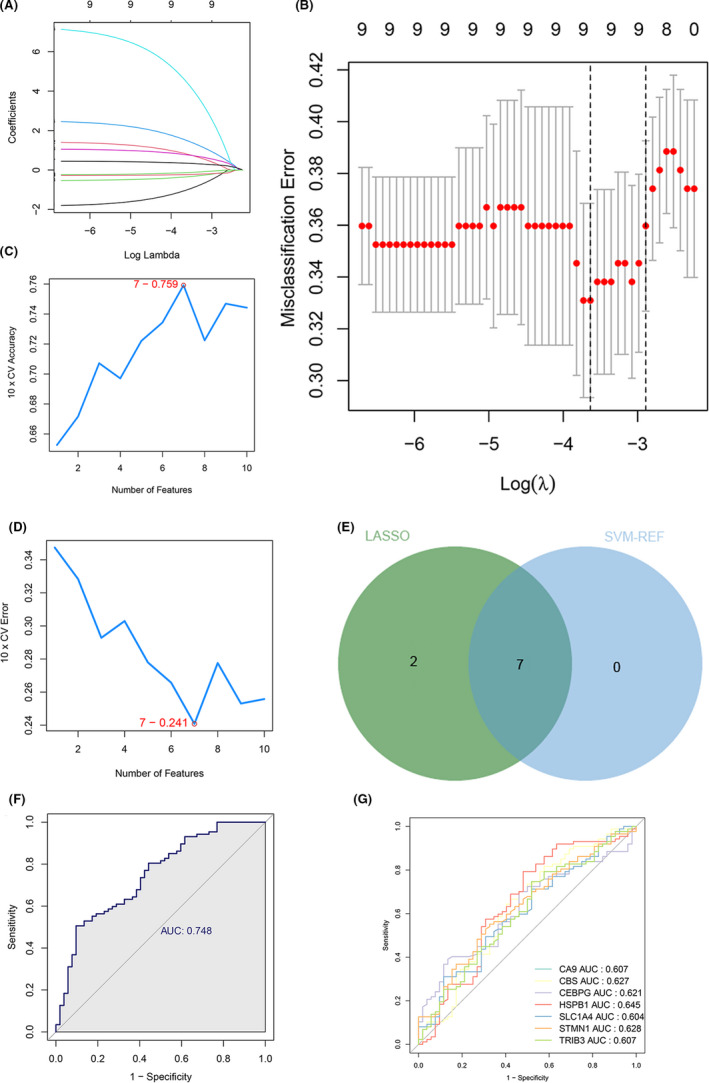
7 DE‐FGs were identified as diagnostic genes for CAD. (A and B) By LASSO logistic regression algorithm, with penalty parameter tuning conducted by 10‐fold cross‐validation, was used to select 9 CAD‐related features. (C and D) SVM‐RFE algorithm to filter the 10 DE‐FRGs to identify the optimal combination of feature genes. Finally, 7 genes (maximal accuracy =0.759, minimal RMSE =0.241) were identified as the optimal feature genes. (E) The marker genes obtained from the LASSO and SVM‐RFE models. (F) Logistic regression model to identify the AUC of disease samples. (G) ROC curves for the 7 marker genes
Based on the above 7 marker genes, we constructed a logistic regression model by R package glm, and the subsequent ROC curves indicated that the 7 marker gene‐based logistic regression model differentiated normal and CAD samples with AUC = 0.748 (Figure 3F). Moreover, to elucidate the ability of individual genes in distinguishing CAD from normal samples, ROC curves were generated for the 7 marker genes. As shown in Figure 3G, the AUC for all genes was greater than 0.6. The above evidence suggested that for differentiating CAD samples from normal samples, the logistic regression model provided a superior accuracy and specificity than the individual marker genes.
3.4. Marker genes were closely linked to a variety of CAD‐related pathways
To further explore the potential function of marker genes to distinguish diseased samples from normal samples, we conducted a single‐gene GSEA‐KEGG pathway analysis. The top10 pathways enriched for each marker gene were illustrated in Figure 4A–G. After a comprehensive analysis, we found that these genes were enriched in ribosomes, autophagy, lysosomes, cell cycle, immune response (‘Neutrophil extracellular trap formation’, ‘T‐cell receptor signalling pathway’, ‘ECM‐receptor interaction’ and ‘B‐cell receptor signalling pathway’), amino acid synthesis and metabolism (‘Caline, leucine and isoleucine degradation’, ‘Tyrosine metabolism’ and ‘Biosynthesis of amino acids’) and various disease pathways (‘Renal cell carcinoma’, ‘Hepatitis B’, ‘Coronavirus disease—COVID‐19’ and ‘Alzheimer disease’). Moreover, we found that the marker genes were also enriched in the ‘TNF signalling pathway’, ‘MAPK signalling pathway’, ‘Rap1 signalling pathway’, ‘ErbB signalling pathway’, ‘JAK‐STAT signalling pathway’, ‘PI3K‐Akt signalling pathway’, ‘TGF‐beta signalling pathway’, ‘Wnt signalling pathway’, ‘Ras signalling pathway’ and ‘mTOR signalling pathway’. Besides, we also found that CEBPG was closely related to the ‘Regulation of actin cytoskeleton’ (also enriched in SLC1A4, STMN1 and CBS), ‘Vascular smooth muscle contraction’, ‘Dilated cardiomyopathy’, ‘Relaxin signalling pathway’, ‘Cardiac muscle contraction’ and ‘Hypertrophic cardiomyopathy’.
FIGURE 4.
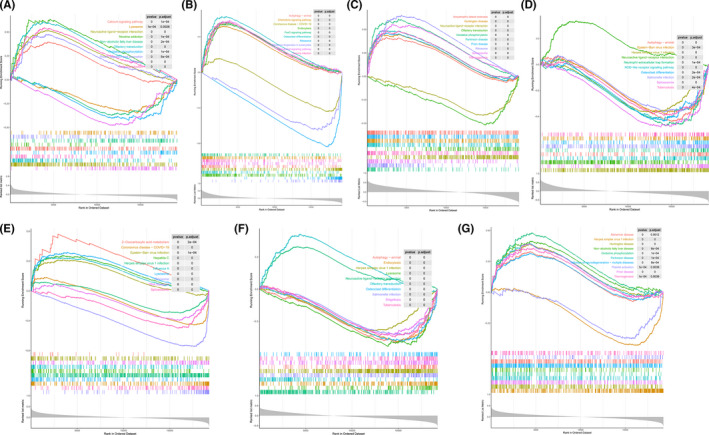
Single‐gene GSEA‐KEGG pathway analysis in CA9 (A), CBS (B), CEBPG (C), HSPB1 (D), SLC1A4 (E), STMN1(F) and TRIB3 (G)
Then, we observed the differentially activated pathways between the high‐ and low‐expression groups based on the expression levels of each marker gene combined with GSVA. The results showed that the low expression of CA9 in the disease may induce CDA by activating amino acid degradation, fatty acid metabolism, peroxidase and oxidative phosphorylation, while the overexpression of CA9 activated ‘VASCULAR SMOOTH MUSCLE CONTRACTION’ and ‘ARRHYTHMOGENIC RIGHT VENTRICULAR CARDIOMYOPATHY ARVC’ ( Figure S1A). The up‐regulation of CEBPG activated the amino acid metabolism/degradation and ‘CARDIAC MUSCLE CONTRACTION’ pathways (Figure S1B). Low‐expression of SLC1A4 was only related to ‘RIBOSOME’, while the high expression of this gene activated the ‘CELL CYCLE’, amino acid metabolism (arginine and proline) and ‘REGULATION OF ACTIN CYTOSKELETON’ (Figure S1C). Many CAD‐related pathways, such as Wnt, PPAR, TGF‐β, JAK‐STAT, mTOR and ErbB signalling pathways were activated by the low expression of STMN1. Incredibly, the highly expressed STMN1 was directly related to ‘CARDIAC MUSCLE CONTRACTION’ and ‘ARRHYTHMOGENIC RIGHT VENTRICULAR CARDIOMYOPATHY ARVC’ (Figure S1D). In the TRIB3 low‐expression group, ‘HYPERTROPHIC CARDIOMYOPATHY HCM’, ‘DILATED CARDIOMYOPATHY’ and immune‐related pathways (‘CELL ADHESION MOLECULES CAMS’, ‘CHEMOKINE SIGNALLING PATHWAY’, ‘LEUKOCYTE TRANSENDOTHELIAL MIGRATION’) were enriched. The highly expressed TRIB3 played a central role in the metabolism and degradation of amino acids (Figure S1E). It is worth noting that for CBS, a variety of pathways related to CAD pathogenesis were enriched in its high‐expression group, such as ‘JAK‐STAT SIGNALLING PATHWAY’, ‘ERBB SIGNALLING PATHWAY’, ‘PPAR SIGNALLING PATHWAY’, ‘MTOR SIGNALLING PATHWAY’, ‘MAPK SIGNALLING PATHWAY’ and ‘TGF BETA SIGNALLING PATHWAY’ (Figure 5A). Furthermore, HSPB1, whose expression was inhibited in CAD tissue, was more closely related to immune response (‘T‐CELL RECEPTOR SIGNALLING PATHWAY’, ‘B‐CELL RECEPTOR SIGNALLING PATHWAY’ and ‘NATURAL KILLER CELL‐MEDIATED CYTOTOXICITY’), ‘REGULATION OF AUTOPHAGY’ and amino acid metabolism pathway. Unreasonably, the high‐expression of HSPB1 activated the pathways such as ‘ARACHIDONIC ACID METABOLISM’, ‘STEROID HORMONE BIOSYNTHESIS’, ‘DILATED CARDIOMYOPATHY’, ‘VASCULAR SMOOTH MUSCLE CONTRACTION’, ‘TGF BETA SIGNALLING PATHWAY’, ‘HYPERTROPHIC CARDIOMYOPATHY HCM’ and ‘ARRHYTHMOGENIC RIGHT VENTRICULAR CARDIOMYOPATHY ARVC’ that may induce CAD (Figure 5B).
FIGURE 5.
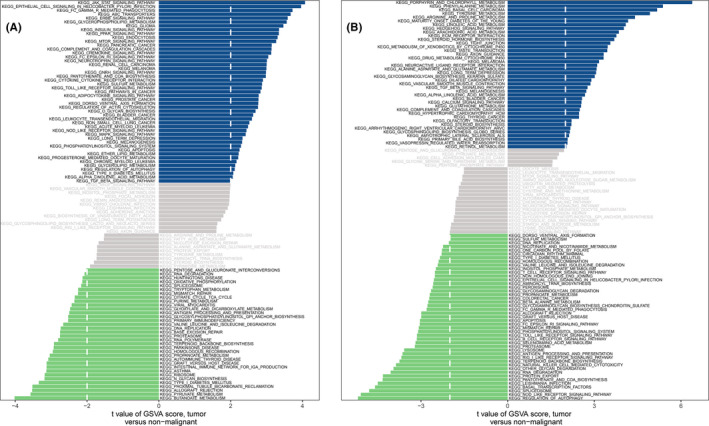
High‐ and low‐expression groups based on the expression levels of each marker gene combined with GSVA in CBS (A) and HSPB1 (B)
3.5. Immune landscape analysis
The previous results indicated that the marker genes were closely related to the immune response. Meanwhile, much pieces of evidence pointed to the inseparable connection between the immune microenvironment and CAD. 17 , 18 , 19 Therefore, we implemented the CIBERSORT algorithm to explore the differences in the immune microenvironment between CAD patients and normal samples. As shown in Figure 6A, the proportion of B‐cell naive in CAD samples was lower than that in normal samples, while T‐cell follicular helper and monocytes were more expressed in CAD samples. In addition, Pearson correlation analysis revealed that neutrophils had strong positive and negative correlations with CBS (r = 0.487659, p = 1.14E‐09) and HSPB1 (r = −0.31684, p = 0.000145) respectively. CEBPG was positively correlated with monocytes (r = 0.35092, p = 2.28E‐05) (Figure 6B; Table S7). These pieces of evidence indicated that changes in the immune microenvironment of CAD patients may be linked to CBS, HSPB1 and CEBPG.
FIGURE 6.
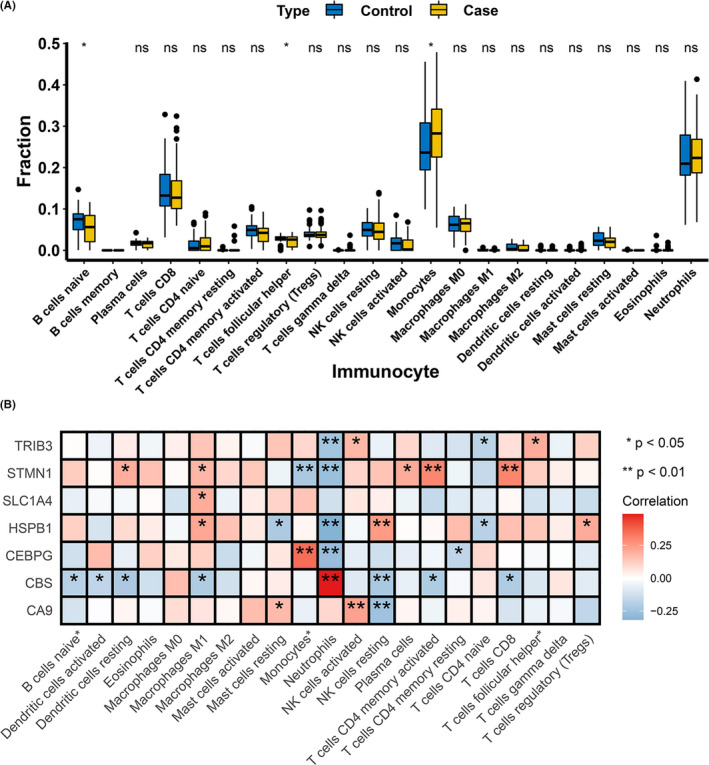
Immune landscape analysis. (A) Implemented the CIBERSORT algorithm to explore the differences in the immune microenvironment between CAD patients and normal samples. (B) Pearson correlation analysis revealed that neutrophils had strong positive and negative correlations with CBS and HSPB1 respectively. CEBPG was positively correlated with monocytes (*p < 0.05, **p < 0.01)
3.6. Prediction of marker gene‐targeted drugs
We further revealed the drugs that may target marker genes through the DGIdb database and analysed the interaction relationship between the two parameters were set to default values; (Table S8). The results visualized by Cytoscape software were shown in (Figure 7). We had queried 58 drugs targeting marker genes, including 17 for CA9, 5 for CBS, 33 for HSPB1, 1 for SLC1A4, STMN1 targeted 1 drug and TRIB3 targeted 1 drug. Unfortunately, we did not forecast CEBPG's targeted drugs. Moreover, we also used the DrugBank database to retrieve the structural formulas of the 58 drugs mentioned above. A total of 36 drug structures were retrieved. A total of 11 drug structures were retrieved from 17 CA9 targeted drugs. Among them, benzthiazide, ellagic acid, ethoxzolamide, hydroflumethiazide, sodium carbonate and zonisamide were known inhibitors of CA9. The structural formulas of CBS's five targeted drugs had been retrieved, and ademetionine and pyridoxal phosphate as its activator and cofactor respectively. 17 of 33 HSPB1 targeted drugs were displayed, of which apatorsen and artenimol were inhibitors and ligands of the gene respectively. The structural information of the targeted drugs of SLC1A4, STMN1 and TRIB3 was all revealed. The detailed results were illustrated in (Figure S2).
FIGURE 7.
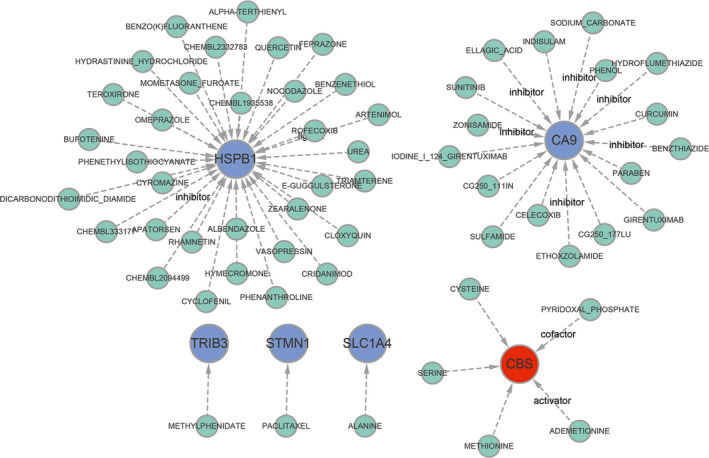
Prediction of marker gene‐targeted drugs. The drugs may target marker genes through the DGIdb database and the interaction relationship between the two
3.7. A ceRNA networks based on marker genes
Next, we constructed a ceRNA network based on 7 marker genes through starBase and miranda databases. The network included 408 nodes (7 marker genes, 74 miRNAs and 327 lncRNAs) and 688 edges (Figure 8). In detail, we found that a total of 170 lncRNAs could competitively bind hsa‐miR‐103a‐3p, hsa‐miR‐500a‐3p, hsa‐miR‐181b‐5p, hsa‐miR‐3681‐3p, hsa‐miR‐181d‐5p, hsa‐miR‐181a‐5p and hsa‐miR‐107 regulated SLC1A4. Among them, hsa‐miR‐103a‐3p and hsa‐miR‐107 were shared 48 lncRNAs. In addition, 57 shared lncRNAs could target hsa‐miR‐181a‐5p, hsa‐miR‐181b‐5p and hsa‐miR‐181d‐5p respectively. For TRIB3, we found that 28 lncRNAs could regulate the expression of TRIB3 through competitive binding with hsa‐miR‐1271‐5p. Meanwhile, hsa‐miR‐1271‐5p could be bound to 61 lncRNAs to exert its regulatory role in this gene. Among them, lncRNA EBLN3P could simultaneously target hsa‐miR‐1271‐5p and hsa‐miR‐1271‐5p. In the ceRNA network of STMN1, there were 40 and 56 lncRNAs that could combine with hsa‐miR‐138‐5p and hsa‐miR‐545‐3p to regulate the gene. Among these, lncRNAs, LINC00294, NEAT1 and LINC00665 were shared lncRNAs. A total of 34 lncRNAs could be competitively bound with hsa‐miR‐3173‐5p to affect the expression of CEBPG. The expression of CBS could be regulated by a competitive collection of 40 lncRNAs and hsa‐miR‐361‐3p. Specific details of the ceRNA network were shown in Table S9.
FIGURE 8.
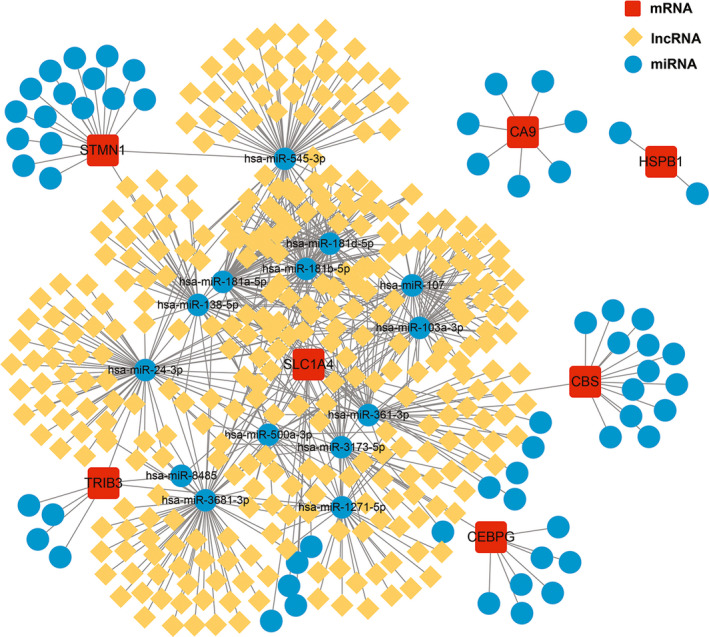
A ceRNA networks based on marker genes. The network included 408 nodes (7 marker genes, 74 miRNAs and 327 lncRNAs) and 688 edges
3.8. Expression of the marker gene in the validation set
Finally, we also verified the expression of marker genes in the GSE20681 dataset. We discovered that the expression trends of CBS, HSPB1 and STMN1 were consistent with the GSE20680 dataset. Among them, the expression of CBS (p = 0.0319) in CAD patients was greater than of normal samples, while the HSPB1 (p = 0.0279) and STMN1 (p = 0.0146) were lower in CAD samples (Figure 9).
FIGURE 9.
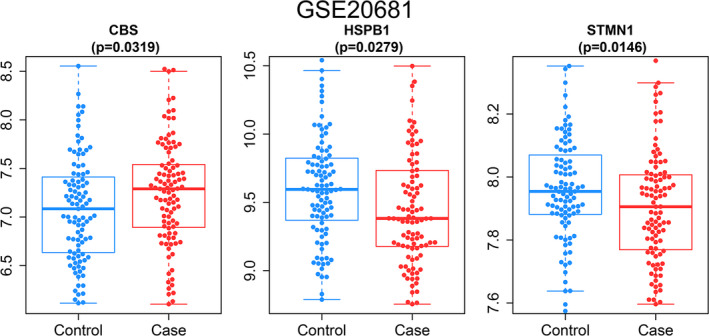
Expression of the marker gene in the validation set. The expression of marker genes in the GSE20681 dataset
4. DISCUSSION
Coronary atherosclerosis is a complex, persistent and progressive inflammatory disease characterized by remodelling of the coronary arteries that deliver oxygen and nutrition to the cardiac tissue. It has a variety of clinical manifestations, ranging from asymptomatic to stable angina, acute coronary syndrome (ACS), sudden cardiac death (SCD) or heart failure (HF). Due to the nature of the disease, most patients may suffer from coronary atherosclerosis for many years, even decades. 20 , 21
Atherosclerosis is the basic pathogenesis of CAD. Abnormal apoptosis of vascular endothelial cells (VECs), macrophages or vascular smooth muscle cells (VSMCs) is a common feature of atherosclerosis, which can lead to the formation of atherosclerotic plaques or plaque instability. 22 Endothelial cell repair after injury is associated with multiple genes, some of which are also involved in the maintenance of normal cardiac function and the formation of aortic aneurysms. 23 , 24 , 25 Autophagy is also involved in the process of coronary atherosclerosis, but its specific role is controversial. Some studies suggest that it is a protective factor against atherosclerosis, and that autophagy is inhibited in patients with cardiovascular disease, featured by the decrease of LC3 and Atg5 genes. 26 However, other contrary findings suggest that autophagy worsens coronary atherosclerosis. 27 It is worth noting that the relationship between coronary atherosclerosis and ferroptosis has not yet been reported. Thus it is important for the selection of gene chip data, two kinds of disease by gene expression data analysis, enrichment of single‐gene analysis, enrichment of bioinformatics methods, such as, finding a common point, to analyse genetic differences in CAD and normal ferroptosis, explore the molecular pathogenesis in CAD ferroptosis. In the present article, a large number of gene chips most suitable for this research was selected and the use of multiple samples of genes as well as a large number of microarray data makes the experimental results more reliable and reduces the error rate, thus providing a valuable clinical reference for the treatment and prevention of CAD.
A total of 7 differential genes related to ferroptosis were screened in this study, including CA9, CBS, CEBPG, HSPB1, SLC1A4, HSPB1 and TRIB3. The AUC values represented by the area under the ROC curve of the 7 genes are all greater than 0.6, indicating that these 7 genes have certain accuracy and specificity for distinguishing coronary artery disease samples from normal samples. Among them, the AUC values of CEPBG, HSPB1 and CBS rank the top 3. HSPB1 is considered to be a molecular companion involved in regulating the composition of the cytoskeleton. 28 After phosphorylation, the oligomer of HSPB1 is dissociated into monomer, which then acts as an inhibitor of apoptosis and an inducer of autophagy, 29 , 30 The GSAV analysis of HSPB1 also confirmed that the autophagy regulatory pathway was activated in the low‐expression group. HSPB1 is a key regulator of ferroptosis in cancer cells, and HSPB1 is a negative regulator of ferroptosis by reducing iron‐mediated production of lipid reactive oxygen species. 31 Other studies have shown that HSPB1 plays an important role in the progression of liver cancer and ferroptosis, and that HSPB1 may be regulated by transcription factor ATF3. 32 Studies have found that protease degradation is more abundant in atherosclerosis than in normal arteries. 33 Therefore, the decrease of HSPB1 in serum of patients with coronary artery disease may be caused by over‐activation of protease, or excessive consumption of HSPB1 caused by anti‐ferroptosis in the body in the process of atherosclerosis plaque formation, which needs further study. CBS‐catalysed transsulfuration converts homocysteine to cysteine. Cysteine γ lyase converts homocysteine to cysteine. 34 Cysteine synthesis (or cysteine uptake by cells) is the rate‐limiting step in the production of glutathione, a ubiquitous antioxidant. Studies have shown that structural activation of NRF2/CBS signalling confers Erastin‐induced ferroptosis resistance, and that CBS overexpression increases intracellular cysteine, supplemental to the decrease in intracellular cysteine caused by Erastin inhibition of the System XC− system. 35 CBS enzyme deficiency can lead to hyperhomocysteinemia, leading to premature development of cardiac and cerebrovascular disease. 36 H2S is also produced from the transsulfuration of homocysteine into cysteine catalysed by CBS. H2S has been proved to play an important role in the process of anti‐atherosclerosis. 37 Thus, CBS plays a role in both atherosclerosis and ferroptosis. Our study found that CBS is highly expressed in the CAD group, which may be a protective mechanism of the body against the disease and control the continued development of the disease.
Immune cells maintain the homeostasis of the heart and all kinds of immune cells that reside or penetrate into the heart tissue play an important role in the process of injury repair. 17 The immune cells identified in the heart include macrophages, monocytes, neutrophils, dendritic cells (DC), T and B cells, eosinophils and mast cells, which also play an important role in maintaining heart function. 38 Our analysis shows that T‐cell helper and monocytes are highly expressed in the CAD group, while B‐cell naive is lower than the normal group. Circulating monocytes and resident vascular macrophages are the first white blood cells known as early atherosclerotic plaques. 39 Local inflammation is caused by damaged endothelial cells that release monocyte chemotactic protein‐1 (also known as C‐C motifchemotactic factor ligand 2 (CCl2)). Monocyte chemokine protein‐1 interacts with chemokine receptor 2 and chemokine receptor 4 expressed on circulating monocytes to recruit them to the lesions. 40 , 41 Migrating monocytes differentiate into macrophages, leading to inflammation and plaque development. 42 Another study shows that T‐cell follicular helper promotes atherosclerosis, and its consumption reduces atherosclerosis. 43 These studies have been confirmed in our analysis. CBS was positively correlated with neutrophils among different iron death‐related genes. CBS is a key enzyme for H2S production in vivo, and H2S can stimulate neutrophils adhesion and neutrophils tissue infiltration. These effects are associated with the up‐regulation of various adhesion receptors and proinflammatory mediators. 44 , 45 Other studies have found that H2S inhibits neutrophil tissue infiltration. 46 , 47 Whether the positive correlation between CBS and neutrophils in CAD patients is mediated by H2S remains to be verified. HSPB1 has been shown to have a cell protective effect. 48 HSPB1 is involved in a number of important physiological functions, including inhibition of cytokine expression and inhibition of neutrophil infiltration. 49 My study found that HSPB1 was negatively correlated with neutrophils, and the expression of HSPB1 was decreased in CAD patients. Therefore, HSPB1 may be a potential target for improving cardiac immune microenvironment in CAD patients.
Finally, we analysed the marker gene for gene‐targeted drugs and the ceRNA network. Among the five CBS target drugs retrieved, ademetionine was confirmed to be an allosteric activator of CBS. 50 The drug has been used in mentally related diseases and liver diseases, 51 , 52 and its application in cardiovascular diseases has not been reported. Pyridoxal phosphate acts as a cofactor for CBS in the body, and its deficiency will lead to the loss of CBS activity. 53 The combination of the antisense oligonucleotide Apatorsen of HSPB1 mRNA and a variety of anti‐cancer drugs enhances the effect of anti‐cancer drugs. 54 , 55 As a predictive targeted drug of HSPB1, cloxyquin has been proved to play a cardioprotective effect by regulating autophagy, 56 but the study of whether HSPB1plays a role in this process has not been clarified. Non‐coding RNA plays an important role in the development of atherosclerosis, miR‐18a‐5p, miR‐27a‐3p, miR199a‐3p, miR‐223‐3p and miR‐652‐3p abundance and atherosclerosis Closely related to cardiovascular‐related reocclusion. 57 Whether our predicted gene‐targeted drugs and non‐coding RNA can play a role is unclear, and the specific pathways need to be further studied. Therefore, the selected drugs and non‐coding RNA can be prospectively studied.
CA9, CBS, CEBPG, HSPB1, SLC1A4, HSPB1 and TRIB3 are genes that we have screened for iron death in coronary heart disease samples. Among them, we focus on the two genes—CBS and HSPB1. These two genes are not only related to iron death. In addition to being closely related, it may also be involved in the regulation of the cardiac immune microenvironment of CAD patients. Although gene expression may not be directly equivalent to protein expression, the biomarkers in this study should be regarded as genes, not proteins, but the significance of its research cannot be denied. We will continue to pay attention to these genes to deepen our understanding of the pathogenesis and treatment of coronary heart disease.
CONFLICT OF INTEREST
The authors declare that they have no competing interests.
AUTHOR CONTRIBUTIONS
Xun Wu: Data curation (equal); Formal analysis (equal); Methodology (equal); Software (equal); Writing – original draft (equal); Writing – review & editing (equal). Kele Qin: Methodology (equal); Writing – review & editing (equal). Chukwuemeka Daniel Iroegbu: Data curation (equal); Writing – review & editing (equal). Kun Xiang: Methodology (equal); Writing – review & editing (equal). Jun Peng: Investigation (equal); Writing – review & editing (equal). Jianjun Guo: Investigation (equal); Writing – review & editing (equal). Jinfu Yang: Investigation (equal); Writing – review & editing (equal). Chengming Fan: Investigation (equal); Project administration (equal); Supervision (equal); Writing – review & editing (equal).
Supporting information
Figure S1
Figure S2
Table S1
Table S2
Table S3
Table S4
Table S5
Table S6
Table S7
Table S8
Table S9
Wu X, Qin K, Iroegbu CD, et al. Genetic analysis of potential biomarkers and therapeutic targets in ferroptosis from coronary artery disease. J Cell Mol Med. 2022;26:2177–2190. doi: 10.1111/jcmm.17239
Funding information
The science and technology innovation Program of Hunan Province (2021RC2106 to Chengming Fan).
DATA AVAILABILITY STATEMENT
The datasets generated and/or analysed during the current study are available in the following locations: the gene expression data for CAD and normal samples were obtained from the GEO database: ttp://www.ncbi.nlm.nih.gov/geo/query/acc.cgi?acc=GSE20680 and http://www.ncbi.nlm.nih.gov/geo/query/acc.cgi?acc=GSE20681. Additionally, the FRGs (n = 259) used in this study were obtained from FerrDb: http://www.zhounan.org/ferrdb/. Drug Gene Interaction Database (http://biogps.org/plugin/1136/dgidb‐the‐drug‐gene‐interaction‐database/) was used to predict drugs targeting marker genes. Lastly, the structural information of the targeted drugs of the marker gene was retrieved from the DrugBank database (https://go.drugbank.com/).
REFERENCES
- 1. Cassar A, Holmes DR Jr, Rihal CS, Gersh BJ. Chronic coronary artery disease: diagnosis and management. Mayo Clin Proc. 2009;84:1130‐1146. [DOI] [PMC free article] [PubMed] [Google Scholar]
- 2. Dixon SJ, Lemberg KM, Lamprecht MR, et al. Ferroptosis: an iron‐dependent form of nonapoptotic cell death. Cell. 2012;149:1060‐1072. [DOI] [PMC free article] [PubMed] [Google Scholar]
- 3. Xie Y, Hou W, Song X, et al. Ferroptosis: process and function. Cell Death Differ. 2016;23:369‐379. [DOI] [PMC free article] [PubMed] [Google Scholar]
- 4. Angeli JPF, Shah R, Pratt DA, Conrad M. Ferroptosis inhibition: mechanisms and opportunities. Trends Pharmacol Sci. 2017;38:489‐498. [DOI] [PubMed] [Google Scholar]
- 5. Cao JY, Dixon SJ. Mechanisms of ferroptosis. Cell Mol Life Sci. 2016;73:2195‐2209. [DOI] [PMC free article] [PubMed] [Google Scholar]
- 6. Fang X, Wang H, Han D, et al. Ferroptosis as a target for protection against cardiomyopathy. Proc Natl Acad Sci USA. 2019;116(7):2672‐2680. [DOI] [PMC free article] [PubMed] [Google Scholar]
- 7. You SA, Archacki SR, Angheloiu G, et al. Proteomic approach to coronary atherosclerosis shows ferritin light chain as a significant marker: evidence consistent with iron hypothesis in atherosclerosis. Physiol Genomics. 2003;13:25‐30. [DOI] [PubMed] [Google Scholar]
- 8. Brissot P, Ropert M, Le Lan C, Loréal O. Non‐transferrin bound iron: a key role in iron overload and iron toxicity. Biochem Biophys Acta. 2012;1820:403‐410. [DOI] [PubMed] [Google Scholar]
- 9. Zhang WJ, Wei H, Frei B. The iron chelator, desferrioxamine, reduces inflammation and atherosclerotic lesion development in experimental mice. Exp Biol Med (Maywood). 2010;235(5):633‐641. [DOI] [PMC free article] [PubMed] [Google Scholar]
- 10. Gao M, Monian P, Quadri N, Ramasamy R, Jiang X. Glutaminolysis and transferrin regulate ferroptosis. Mol Cell. 2015;59:298‐308. [DOI] [PMC free article] [PubMed] [Google Scholar]
- 11. Yang C, Ren J, Li B, et al. Identification of gene biomarkers in patients with postmenopausal osteoporosis. Mol Med Rep. 2019;19:1065‐1073. [DOI] [PMC free article] [PubMed] [Google Scholar]
- 12. Friedman J, Hastie T, Tibshirani R. Regularization paths for generalized linear models via coordinate descent. J Stat Softw. 2010;33:1‐22. [PMC free article] [PubMed] [Google Scholar]
- 13. Qiu J, Peng B, Tang Y, et al. CpG methylation signature predicts recurrence in early‐stage hepatocellular carcinoma: results from a multicenter study. J Clin Oncol. 2017;35:734‐742. [DOI] [PubMed] [Google Scholar]
- 14. Hänzelmann S, Castelo R, Guinney J. GSVA: gene set variation analysis for microarray and RNA‐seq data. BMC Bioinformatics. 2013;14:7. [DOI] [PMC free article] [PubMed] [Google Scholar]
- 15. Newman AM, Liu CL, Green MR, et al. Robust enumeration of cell subsets from tissue expression profiles. Nat Methods. 2015;12:453‐457. [DOI] [PMC free article] [PubMed] [Google Scholar]
- 16. Zhang S, Zhang E, Long J, et al. Immune infiltration in renal cell carcinoma. Cancer Sci. 2019;110:1564‐1572. [DOI] [PMC free article] [PubMed] [Google Scholar]
- 17. Sun K, Li YY, Jin J. A double‐edged sword of immuno‐microenvironment in cardiac homeostasis and injury repair. Signal Transduct Target Ther. 2021;6:79. [DOI] [PMC free article] [PubMed] [Google Scholar]
- 18. Schrottmaier WC, Mussbacher M, Salzmann M, Assinger A. Platelet‐leukocyte interplay during vascular disease. Atherosclerosis. 2020;307:109‐120. [DOI] [PubMed] [Google Scholar]
- 19. Bobryshev YV. Dendritic cells and their role in atherogenesis. Lab Invest. 2010;90:970‐984. [DOI] [PubMed] [Google Scholar]
- 20. Stone GW, Maehara A, Lansky AJ, et al. A prospective natural‐history study of coronary atherosclerosis. N Engl J Med. 2011;364:226‐235. [DOI] [PubMed] [Google Scholar]
- 21. Holzmann MJ, Rathsman B, Eliasson B, et al. Long‐term prognosis in patients with type 1 and 2 diabetes mellitus after coronary artery bypass grafting. J Am Coll Cardiol. 2015;65:1644‐1652. [DOI] [PubMed] [Google Scholar]
- 22. Tsukano H, Gotoh T, Endo M, et al. The endoplasmic reticulum stress‐C/EBP homologous protein pathway‐mediated apoptosis in macrophages contributes to the instability of atherosclerotic plaques. Arterioscler Thromb Vasc Biol. 2010;30:1925‐1932. [DOI] [PubMed] [Google Scholar]
- 23. Xu X, Xu X, Mao Y, et al. Knockout of the NONO gene inhibits neointima formation in a mouse model of vascular injury. Arterioscler Thromb Vasc Biol. 2021;41:1428‐1445. [DOI] [PubMed] [Google Scholar]
- 24. Xu X, Jiang H, Lu Y, et al. Deficiency of NONO is associated with impaired cardiac function and fibrosis in mice. J Mol Cell Cardiol. 2019;137:46‐58. [DOI] [PubMed] [Google Scholar]
- 25. Xu X, Zhang F, Lu Y, et al. Silencing of NONO inhibits abdominal aortic aneurysm in apolipoprotein E‐knockout mice via collagen deposition and inflammatory inhibition. J Cell Mol Med. 2019;23:7449‐7461. [DOI] [PMC free article] [PubMed] [Google Scholar]
- 26. Khalil H, Abd El Maksoud AI, Alian A, et al. Interruption of autophagosome formation in cardiovascular disease, an evidence for protective response of autophagy. Immunol Invest. 2020;49:249‐263. [DOI] [PubMed] [Google Scholar]
- 27. Jia G, Cheng G, Gangahar DM, Agrawal DK. Insulin‐like growth factor‐1 and TNF‐alpha regulate autophagy through c‐jun N‐terminal kinase and Akt pathways in human atherosclerotic vascular smooth cells. Immunol Cell Biol. 2006;84:448‐454. [DOI] [PubMed] [Google Scholar]
- 28. Carver JA, Rekas A, Thorn DC, Wilson MR. Small heat‐shock proteins and clusterin: intra‐ and extracellular molecular chaperones with a common mechanism of action and function? IUBMB Life. 2003;55:661‐668. [DOI] [PubMed] [Google Scholar]
- 29. Huot J, Houle F, Spitz DR, Landry J. HSP27 phosphorylation‐mediated resistance against actin fragmentation and cell death induced by oxidative stress. Can Res. 1996;56:273‐279. [PubMed] [Google Scholar]
- 30. Tang D, Kang R, Livesey KM, et al. High‐mobility group box 1 is essential for mitochondrial quality control. Cell Metab. 2011;13:701‐711. [DOI] [PMC free article] [PubMed] [Google Scholar]
- 31. Sun X, Ou Z, Xie M, et al. HSPB1 as a novel regulator of ferroptotic cancer cell death. Oncogene. 2015;34:5617‐5625. [DOI] [PMC free article] [PubMed] [Google Scholar]
- 32. Fei Z, Lijuan Y, Jing Z, Xi Y, Yuefen P, Shuwen H. Molecular characteristics associated with ferroptosis in hepatocellular carcinoma progression. Hum Cell. 2021;34:177‐186. [DOI] [PubMed] [Google Scholar]
- 33. Martin‐Ventura JL, Nicolas V, Houard X, et al. Biological significance of decreased HSP27 in human atherosclerosis. Arterioscler Thromb Vasc Biol. 2006;26:1337‐1343. [DOI] [PubMed] [Google Scholar]
- 34. Nozaki T, Shigeta Y, Saito‐Nakano Y, Imada M, Kruger WD. Characterization of transsulfuration and cysteine biosynthetic pathways in the protozoan hemoflagellate, Trypanosoma cruzi. Isolation and molecular characterization of cystathionine beta‐synthase and serine acetyltransferase from Trypanosoma. J Biol Chem. 2001;276:6516‐6523. [DOI] [PubMed] [Google Scholar]
- 35. Liu N, Lin X, Huang C. Activation of the reverse transsulfuration pathway through NRF2/CBS confers erastin‐induced ferroptosis resistance. Br J Cancer. 2020;122:279‐292. [DOI] [PMC free article] [PubMed] [Google Scholar]
- 36. Pushpakumar S, Kundu S, Sen U. Endothelial dysfunction: the link between homocysteine and hydrogen sulfide. Curr Med Chem. 2014;21:3662‐3672. [DOI] [PMC free article] [PubMed] [Google Scholar]
- 37. Wang Y, Zhao X, Jin H, et al. Role of hydrogen sulfide in the development of atherosclerotic lesions in apolipoprotein E knockout mice. Arterioscler Thromb Vasc Biol. 2009;29(2):173‐179. [DOI] [PubMed] [Google Scholar]
- 38. Swirski FK, Nahrendorf MJNRI. Cardioimmunology: the immune system in cardiac homeostasis and disease. Nat Rev Immunol. 2018;18:733‐744. [DOI] [PubMed] [Google Scholar]
- 39. Camici PG, Rimoldi OE, Gaemperli O, Libby P. Non‐invasive anatomic and functional imaging of vascular inflammation and unstable plaque. Eur Heart J. 2012;33(11):1309‐1317. [DOI] [PubMed] [Google Scholar]
- 40. Combadiere C, Potteaux S, Rodero M, et al. Combined inhibition of CCL2, CX3CR1, and CCR5 abrogates Ly6C(hi) and Ly6C(lo) monocytosis and almost abolishes atherosclerosis in hypercholesterolemic mice. Circulation. 2008;117(13):1649‐1657. [DOI] [PubMed] [Google Scholar]
- 41. Lin J, Kakkar V, Lu X. Impact of MCP‐1 in atherosclerosis. Curr Pharm Des. 2014;20:4580‐4588. [DOI] [PubMed] [Google Scholar]
- 42. Swirski FK, Libby P, Aikawa E, et al. Ly‐6C hi monocytes dominate hypercholesterolemia‐associated monocytosis and give rise to macrophages in atheromata. J Clin Invest. 2007;117:195‐205. [DOI] [PMC free article] [PubMed] [Google Scholar]
- 43. Gaddis DE, Padgett LE, Wu R, et al. Apolipoprotein AI prevents regulatory to follicular helper T cell switching during atherosclerosis. Nat Commun. 2018;9:1095. [DOI] [PMC free article] [PubMed] [Google Scholar]
- 44. Zhang H, Hegde A, Ng SW, Adhikari S, Moochhala SM, Bhatia M. Hydrogen sulfide up‐regulates substance P in polymicrobial sepsis‐associated lung injury. J Immunol. 2007;179:4153‐4160. [DOI] [PubMed] [Google Scholar]
- 45. Tamizhselvi R, Koh YH, Sun J, Zhang H, Bhatia M. Hydrogen sulfide induces ICAM‐1 expression and neutrophil adhesion to caerulein‐treated pancreatic acinar cells through NF‐kappaB and Src‐family kinases pathway. Exp Cell Res. 2010;316:1625‐1636. [DOI] [PubMed] [Google Scholar]
- 46. Elrod JW, Calvert JW, Morrison J, et al. Hydrogen sulfide attenuates myocardial ischemia‐reperfusion injury by preservation of mitochondrial function. Proc Natl Acad Sci USA. 2007;104:15560‐15565. [DOI] [PMC free article] [PubMed] [Google Scholar]
- 47. Sivarajah A, Collino M, Yasin M, et al. Anti‐apoptotic and anti‐inflammatory effects of hydrogen sulfide in a rat model of regional myocardial i/r. Shock. 2009;31(3):267‐274. [DOI] [PubMed] [Google Scholar]
- 48. Landry J, Chrétien P, Lambert H, Hickey E, Weber LA. Heat shock resistance conferred by expression of the human HSP27 gene in rodent cells. J Cell Biol. 1989;109(1):7‐15. [DOI] [PMC free article] [PubMed] [Google Scholar]
- 49. Crowe J, Aubareda A, McNamee K, et ak. Heat shock protein B1‐deficient mice display impaired wound healing. PLoS One. 2013;8:e77383. [DOI] [PMC free article] [PubMed] [Google Scholar]
- 50. Pey AL, Majtan T, Sanchez‐Ruiz JM, Kraus JP. Human Cystathionine β‐Synthase (CBS) contains two classes of binding sites for S‐Adenosylmethionine (SAM): complex regulation of CBS activity and stability by SAM. Biochem J. 2013;449:109‐121. [DOI] [PubMed] [Google Scholar]
- 51. Sharma A, Gerbarg P, Bottiglieri T, et al. S‐Adenosylmethionine (SAMe) for neuropsychiatric disorders: a clinician‐oriented review of research. J Clin Psychiatry. 2017;78:e656‐e667. [DOI] [PMC free article] [PubMed] [Google Scholar]
- 52. Ivashkin VT, Maevskaya MV, Kobalava ZD, et al. Open‐label study of ademetionine for the treatment of intrahepatic cholestasis associated with alcoholic liver disease. Minerva Gastroenterol Dietol. 2018;64:208‐219. [DOI] [PubMed] [Google Scholar]
- 53. Gregory JF, DeRatt BN, Rios‐Avila L, Ralat M, Stacpoole PW. Vitamin B6 nutritional status and cellular availability of pyridoxal 5'‐phosphate govern the function of the transsulfuration pathway's canonical reactions and hydrogen sulfide production via side reactions. Biochimie. 2016;126:21‐26. [DOI] [PMC free article] [PubMed] [Google Scholar]
- 54. Spigel DR, Shipley DL, Waterhouse DM, et al. A randomized, double‐blinded, phase ii trial of carboplatin and pemetrexed with or without apatorsen (OGX‐427) in patients with previously untreated stage IV non‐squamous‐non‐small‐cell lung cancer: the SPRUCE trial. Oncologist. 2019;24:e1409‐e1416. [DOI] [PMC free article] [PubMed] [Google Scholar]
- 55. Rosenberg JE, Hahn NM, Regan MM, et al. Apatorsen plus docetaxel versus docetaxel alone in platinum‐resistant metastatic urothelial carcinoma (Borealis‐2). Br J Cancer. 2018;118:1434‐1441. [DOI] [PMC free article] [PubMed] [Google Scholar]
- 56. Zhang J, Nadtochiy SM, Urciuoli WR, Brookes PS. The cardioprotective compound cloxyquin uncouples mitochondria and induces autophagy. Am J Physiol Heart Circ Physiol. 2016;310:H29‐H38. [DOI] [PMC free article] [PubMed] [Google Scholar]
- 57. Vegter EL, Ovchinnikova ES, van Veldhuisen DJ, et al. Low circulating microRNA levels in heart failure patients are associated with atherosclerotic disease and cardiovascular‐related rehospitalizations. Clin Res Cardiol. 2017;106:598‐609. [DOI] [PMC free article] [PubMed] [Google Scholar]
Associated Data
This section collects any data citations, data availability statements, or supplementary materials included in this article.
Supplementary Materials
Figure S1
Figure S2
Table S1
Table S2
Table S3
Table S4
Table S5
Table S6
Table S7
Table S8
Table S9
Data Availability Statement
The datasets generated and/or analysed during the current study are available in the following locations: the gene expression data for CAD and normal samples were obtained from the GEO database: ttp://www.ncbi.nlm.nih.gov/geo/query/acc.cgi?acc=GSE20680 and http://www.ncbi.nlm.nih.gov/geo/query/acc.cgi?acc=GSE20681. Additionally, the FRGs (n = 259) used in this study were obtained from FerrDb: http://www.zhounan.org/ferrdb/. Drug Gene Interaction Database (http://biogps.org/plugin/1136/dgidb‐the‐drug‐gene‐interaction‐database/) was used to predict drugs targeting marker genes. Lastly, the structural information of the targeted drugs of the marker gene was retrieved from the DrugBank database (https://go.drugbank.com/).


