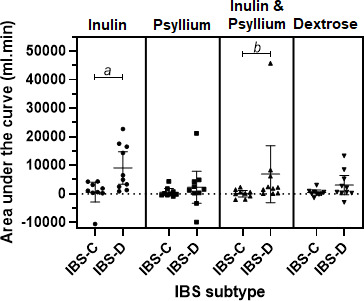
Figure 2.

Area under the curve (AUC) change in MRI colonic gas from fasting values for IBS-C versus IBS-D (n=19), demonstrating significantly greater AUCs for IBS-D after both inulin and inulin and psyllium coadministration test drinks. Data shown are mean±95% CI. a, p=0.01. b, p=0.03. IBS-C, constipation-predominant IBS; IBS-D, diarrhoea-predominant IBS.
