

Abstract
Diffusion-weighted imaging relies on the detection of the random microscopic motion of free water molecules known as Brownian movement. With the development of new magnetic resonance (MR) imaging technologies and stronger diffusion gradients, recent applications of diffusion-weighted imaging in whole-body imaging have attracted considerable attention, especially in the field of oncology. Diffusion-weighted imaging is being established as a pivotal aspect of MR imaging in the evaluation of specific organs, including the breast, liver, kidney, and those in the pelvis. When used in conjunction with apparent diffusion coefficient mapping, diffusion-weighted imaging provides information about the functional environment of water in tissues, thereby augmenting the morphologic information provided by conventional MR imaging. Detected changes include shifts of water from extracellular to intracellular spaces, restriction of cellular membrane permeability, increased cellular density, and disruption of cellular membrane depolarization. These findings are commonly associated with malignancies; therefore, diffusion-weighted imaging has many applications in oncologic imaging and can aid in tumor detection and characterization and in the prediction and assessment of response to therapy.
© RSNA, 2011
LEARNING OBJECTIVES
After completing this journal-based CME activity, participants will be able to:
-
•.
Describe the basic concepts of diffusion-weighted imaging.
-
•.
List the common indications for and applications of a diffusion-weighted sequence in whole-body imaging.
-
•.
Discuss the application of diffusion-weighted imaging for monitoring treatment response and predicting outcome in cancer patients.
Introduction
Diffusion-weighted imaging has been used to help detect early stroke and other neurologic diseases since the 1990s. Since that time, a growing number of studies have demonstrated the usefulness of this method in both the detection and characterization of lesions—more specifically, in the field of oncologic imaging. The application of a diffusion-weighted sequence in whole-body imaging has gained more popularity with new technical developments in magnetic resonance (MR) imaging, including multichannel coils, echoplanar imaging, and stronger gradients (1), leading to a reduction in the amount of time required for diffusion-weighted imaging to less than 1 minute. Therefore, these sequences can be added to the imaging protocol without significantly increasing overall acquisition time. Another benefit of diffusion-weighted imaging is its use of inherent tissue contrast; hence, no exogenous contrast material is required. The aforementioned improvements and a growing body of research have led to the ever-increasing utilization of diffusion-weighted imaging for specific applications, including oncologic imaging of the liver (2), prostate gland (3), and breast (4), as well as whole-body imaging (5).
In this article, we review the principles of diffusion-weighted imaging and apparent diffusion coefficient (ADC) mapping as an imaging biomarker for tissue characterization, cancer detection and staging, and assessment of treatment response.
Principles of Diffusion-weighted Imaging
To understand the concept of diffusion-weighted imaging, one must understand the principles of free versus restricted diffusion in the cellular microenvironment. Free water molecules are in constant random motion, known as Brownian motion, which is related to thermal kinetic energy. In contrast, the motion of water molecules within the cellular microenvironment is impeded by their interaction with cellular compartments, including the cell wall and intracellular organelles (6). In other words, restriction in the diffusion of water molecules is directly proportional to the degree of cellularity of the tissue. This restricted diffusion is observed primarily in malignancies, hypercellular metastases, and fibrosis, which contain a greater number of cells with intact cell walls than does healthy tissue (Fig 1 ). In contrast, in a microenvironment with fewer cells and a defective cell membrane (eg, the necrotic center of a large mass), water molecules are able to move freely (ie, diffusion is less restricted) (1).
Relationship between degree of cellularity and restricted diffusion. (a) High-power photomicrograph (original magnification, ×400; hematoxylin-eosin stain) of normal liver parenchyma demonstrates abundant space for the motion of water molecules. (b) High-power photomicrograph (original magnification, ×400; hematoxylin-eosin stain) of a hepatocellular carcinoma shows a greater number of cellular elements, resulting in less space for the motion of water molecules. (Courtesy of Hui Guan, MD, Johns Hopkins Medical Institutions, Baltimore, Md.)
Figure 1a.

Figure 1b.

Diffusion-weighted Imaging Technique
The most common method used for diffusion-weighted imaging is to incorporate two symmetric motion-probing gradient pulses into a single-shot spin-echo (SE) T2-weighted sequence, one on either side of the 180° refocusing pulse (Stejskal-Tanner sequence) (Fig 2). This can be explained at the molecular level by the fact that a diffusion gradient causes the phase shift to vary with position, with all spins that remain at the same location (ie, restricted diffusion microenvironment) along the gradient axis during the two pulses returning to their initial state. However, spins that have moved (ie, free water molecules) will be subjected to a different field strength during the second pulse and therefore will not return to their initial state, but will instead undergo a total phase shift, resulting in decreased intensity of the measured MR signal (7). The degree of signal attenuation depends on multiple factors as shown in the following equation:
where SI 0 is the signal intensity of the T2-weighted image with no diffusion gradient applied, b is the degree of diffusion weighting (b value), and D is the diffusion coefficient (5). The sensitivity of diffusion-weighted imaging to diffusion can be incrementally increased by increasing the amplitude, duration, and temporal spacing of the two motion-probing gradients. These gradient properties determine the b value (expressed in seconds per square millimeter), an index of the degree of diffusion weighting (Fig 2). In clinical practice, multiple b values are used to reduce the error in ADC calculation for improved characterization of tissue (Fig 3 ).
Use of multiple b values to improve tissue characterization. (a) On an axial diffusion-weighted image (b = 300 sec/mm2) obtained in a 20-year-old man with a history of mesenchymal chondrosarcoma of the skull who presented with abdominal pain and multiple hepatic lesions, the liver lesions appear bright (arrowheads). It is not possible to distinguish between the solid and cystic components of these lesions without using a higher b value or an ADC map. (b) Axial diffusion-weighted image (b = 600 sec/mm2) shows a decrease in signal intensity at the center of the lesions, as well as peripheral restricted diffusion. (c) Axial ADC map reconstructed from images obtained at b values of 0 and 750 sec/mm2 shows a peripheral dark rim (arrow) representing viable tumor.
Figure 3a.

Figure 3b.

Figure 3c.

Figure 2.
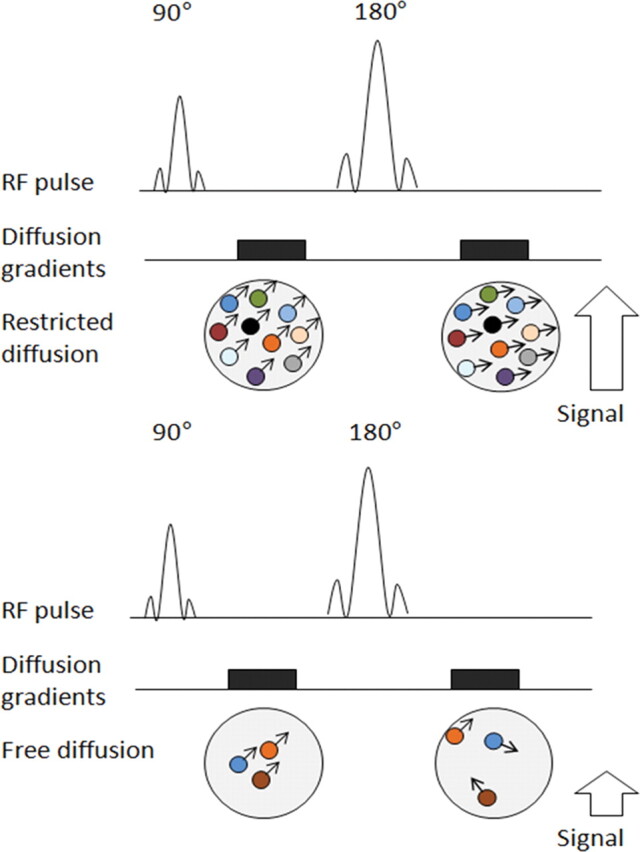
Pulse sequence diagrams illustrate how a diffusion-weighted sequence incorporates two symmetric motion-probing gradient pulses into a single-shot SE T2-weighted sequence, one on either side of the 180° refocusing pulse. Restricted diffusion (top) manifests as retained signal, whereas free diffusion (bottom) translates into signal loss. The sensitivity of diffusion-weighted imaging to diffusion can be incrementally increased by increasing the amplitude, duration, and temporal spacing of the two motion-probing gradients. RF = radiofrequency.
Quantitative Analysis with Diffusion weighted Imaging–ADC Mapping
ADC is calculated during postprocessing with use of at least two different b values. The ADC value is the slope of the line that is superimposed on the plot of the logarithm of relative signal intensity (y-axis) versus b value (x-axis) (Fig 4). A more accurate ADC value can be obtained by using more diffusion-weighted images with different b values. The final image with different ADC values calculated for each pixel of an image is referred to as an ADC map. By drawing regions of interest within a lesion, the ADC value for the lesion can be ascertained. The regions with more restricted diffusion and, therefore, higher diffusion-weighted signal show lower ADC values (8). It is important to remember that ADC maps have poor anatomic detail and should be analyzed in conjunction with other MR images, including different b-value diffusion-weighted images, higher-resolution anatomic images, and, if available, contrast material–enhanced images.
Figure 4.

Graph illustrates the logarithm of relative signal intensity (SI) (y-axis) versus b value (in this case, 0 and 500 sec/mm2) (x-axis) for tumor and normal tissue. The slope of the “tumor line” is less than that of the line representing normal tissue, which translates into lower signal on the ADC map.
Artifacts and Pitfalls of Diffusion-weighted Imaging
T2 Shine-Through Effect
The SE sequence used in diffusion-weighted imaging is T2 weighted, and the signal intensity of the tissue depends on both the T2 signal and the degree of signal attenuation after applying the motion-probing gradient pulses. Therefore, in tissues with very long T2 relaxation times, the strong T2 signal may be mistaken for restricted diffusion, a phenomenon known as T2 shine-through effect. The easiest way to distinguish between restricted diffusion and T2 shine-through is to generate an ADC map, on which the former appears as an area of low signal intensity (low ADC values) and the latter as a high-signal-intensity area (Fig 5 ). There are other techniques for reducing T2 shine-through, such as using (a) a high b value and a short echo time to decrease the T2 signal, or (b) an exponential imaging technique in which a new image is generated by using the ratio of the diffusion-weighted image divided by the nonweighted image (b = 0). This calculation is based on the signal attenuation equation shown earlier (see “Diffusion-weighted Imaging Technique”).
T2 shine-through effect in a 53-year-old woman with a history of islet cell tumor of the pancreas who presented with hepatic metastasis. (a) Axial diffusion-weighted image (b = 300 sec/mm2) shows a mass with restricted diffusion (arrow) in the pancreatic head. Hepatic metastasis (arrowheads) with central increased signal intensity is also noted. (b) Axial diffusion-weighted image (b = 600 sec/mm2) demonstrates persistent high signal intensity within both the necrotic mass (arrow) and an adjacent liver cyst (arrowhead), a finding that is compatible with T2 shine-through. (c) Axial ADC map helps confirm the presence of T2 shine-through, showing high signal intensity in the area of necrosis and low signal intensity in the truly malignant tissue in the pancreatic head.
Figure 5a.

Figure 5b.

Figure 5c.

Susceptibility Artifact
An echoplanar sequence is used for diffusion-weighted image acquisition and is especially susceptible to magnetic field heterogeneities. The use of an echoplanar sequence in abdominal imaging is particularly challenging due to the presence of air within the gastrointestinal tract and lung bases (9). Other sources of susceptibility artifact include medical devices (eg, metallic stents, surgical clips) and grafts. One way to reduce susceptibility artifact is to shorten the echo time and increase the bandwidth.
Motion Artifact
Motion artifact due to multiple constantly moving organs is a major source of image degradation in whole-body diffusion-weighted imaging. Motion artifact is more pronounced along the phase-encoding direction, where it creates “ghost” images. Therefore, generated signal is not confined to the original voxel and is spread throughout the image, creating a potential error in estimated ADC values. Increasing the speed of image acquisition, which is now possible with single-shot echoplanar imaging, and using parallel imaging are possible ways to decrease this artifact.
Effect of Contrast Material
When performing whole-body diffusion-weighted imaging, one must consider the effect of contrast material in the quantitative evaluation of diffusion parameters—specifically, ADC values. This effect appears to be most pronounced in the renal parenchyma due to a high concentration of contrast material and the paramagnetic effects of contrast material excreted into the collecting system. In a recent study of 50 patients, Wang et al (10) demonstrated that the ADC signal of the renal parenchyma is significantly lower on postcontrast diffusion-weighted images (obtained an average of 11 minutes after contrast material injection) than on precontrast images. There was no significant decrease in ADC values for the liver, pancreas, or spleen after injection (10).
Applications of Diffusion-weighted Imaging
Breast Evaluation
Diffusion-weighted imaging was first introduced in the field of breast MR imaging more than 2 decades ago, but it was not until 2002 that Sinha et al (4) demonstrated that the average ADC value of normal tissue and benign lesions is higher than that of malignant lesions (Fig 6 ). However, the optimum range of b values for the evaluation of breast malignancies remains a critical question. Multiple combinations of b values have been proposed for the accurate differentiation of benign and malignant lesions, yielding different calculated ADC values and cutoff points (Table) (11–13). Two studies have compared the use of multiple combinations of b values. The first study concluded that there was no significant difference in the diagnostic utility of ADC values obtained with different combinations of b values; however, the study did suggest that ADC values calculated using b values of 0 and 750 sec/mm2 were slightly more useful than those calculated using other combinations (14). The other study suggested that the use of b values of 50 and 850 sec/mm2 resulted in the highest accuracy (95%) (15). A recent study by Pereira et al (12) showed that the optimum ADC cutoff value for differentiating malignant from benign tissue was different for different combinations of b values (Table).
Poorly differentiated invasive ductal breast carcinoma in a 44-year-old woman. (a) Sagittal diffusion-weighted image (b = 800 sec/mm2) shows two nodules with restricted diffusion (arrowheads). (b) Sagittal ADC map shows restricted diffusion throughout the upper (solid) tumor and in the peripheral rim of the lower (necrotic) mass, with higher ADC values in the center of the mass. (c) Dynamic contrast-enhanced MR image with superimposed color coding shows increased permeability in the region of the cancer. The image was reconstructed on the basis of pharmacokinetic modeling and reflects the perfusion parameters of the malignant tissue, especially increased permeability, which corresponds to the regions with low ADC values in b.
Figure 6a.

Figure 6b.

Figure 6c.

Recent Studies of the Application of Diffusion-weighted Imaging and ADC Values in the Evaluation of Breast Tissue
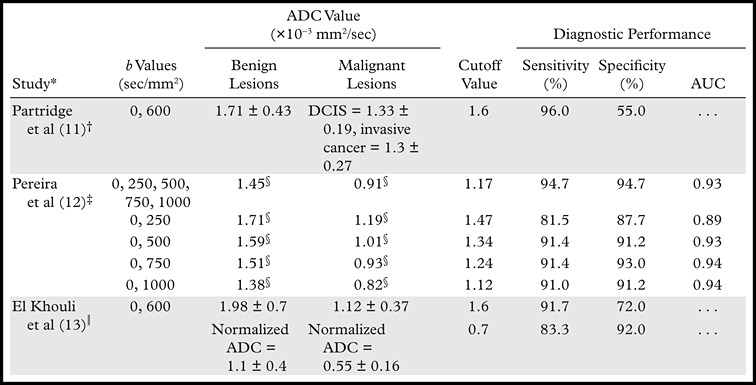
Note.—AUC = area under the receiver operating characteristic curve, DCIS = ductal carcinoma in situ.
Numbers in parentheses indicate reference numbers.
Year of study, 2010; total number of lesions, 118 (91 benign, 27 malignant); 1.5-T imager.
Year of study, 2011; total number of lesions, 138 (57 benign, 81 malignant); 1.5-T imager.
Median value.
Year of study, 2010; total number of lesions, 101 (33 benign, 68 malignant); 3.0-T imager.
The mean ADC value of benign lesions is significantly higher than that of malignant lesions. When using optimum cutoff points suggested in the literature, one must exercise caution regarding the combination of b values used. The role of ADC value in differentiating benign from malignant breast lessions is well established. A recent study has shown that when b values of 0 and 1000 sec/mm2 are used, ADC values show an inverse relationship to tumor grade, with less aggressive tumors (ie, grade 1 and in situ lesions) showing an average ADC value of 1.19 × 10⁻³ mm2/sec and more aggressive tumors (ie, grade 2 and 3 lesions) showing an average ADC value of 0.96 × 10⁻³ mm2/sec (16). Another study showed that the average ADC value of invasive ductal carcinoma of the breast correlated significantly with the expression of estrogen receptors and human epidermal growth factor receptor 2 (13).
Normalizing the ADC values of breast lesions to that of the ipsilateral remote glandular tissue (13) has shown promise in helping to minimize the effect of (a) variations in ADC value across the menstrual cycle that were suggested previously in the literature (17), and (b) variations in the scanning parameters used. Use of a normalized ADC value has led to significant improvement in the diagnostic performance of diffusion-weighted imaging in discriminating between benign and malignant lesions. A normalized ADC cutoff point of 0.7 for better tissue characterization has been proposed in the literature (18).
Diffusion-weighted imaging of the breast has shown promise for the evaluation of tumor response to neoadjuvant chemotherapy. Various reports have shown ADC value to be more useful in assessing tumor response after the first cycle of neoadjuvant chemotherapy and late tumor response after the third cycle than morphologic parameters such as tumor volume and dynamic contrast-enhanced MR imaging parameters (18). In a 2009 study of patients with locally advanced breast cancer, Sharma et al (18) reported a mean percentage increase in ADC value of 51% ± 31.5 in responders, compared with 14.3% ± 13.1 in nonresponders, and they suggested a cutoff value of 15.7% after the second cycle (sensitivity = 81%, specificity = 88%, area under the receiver operating characteristic [ROC] curve = 0.93) and an increased cutoff value of 23.8% after the third cycle (sensitivity = 79%, specificity = 80%, area under the ROC curve = 0.87) to differentiate patients who responded to neoadjuvant chemotherapy from those who did not. In their study of breast cancer patients, Park et al (19) reported similar values, with a mean percentage increase in ADC value of 47.9% ± 4.8 in responders, compared with 18.1% ± 4.5 in nonresponders. Recent reports have investigated the usefulness of pretreatment ADC values in the prediction of tumor response to neoadjuvant chemotherapy. Park et al (19) concluded that the pretreatment ADC value in responders was significantly lower than that in nonresponders, and they suggested a cutoff value of 1.17 × 10⁻³ mm2/sec (sensitivity = 94%, specificity = 71%, area under the ROC curve = 0.89).
Hepatic Evaluation
Recent studies have shown diffusion-weighted imaging to be superior to T2-weighted imaging in the detection of new liver lesions (20). Low-b-value images on which the background blood signal is suppressed are better able to help detect liver lesions than are images obtained at a b value of 0 (21), whereas a higher-b-value sequence yields better characterization of the lesions (Fig 7 ). In a recent study of 53 patients, Parikh et al (20) found that the sensitivity of diffusion-weighted imaging (b = 50 sec/mm2) for the detection of liver lesions was significantly higher than that of standard breath-hold T2-weighted imaging (87.7% versus 70.1%). The percentage of malignant focal liver lesions detected with diffusion-weighted imaging was higher than that detected with T2-weighted imaging (86.4% versus 62.9%) (P < .001) (20).
Cholangiocarcinoma in a 29-year-old man with a history of ulcerative colitis and sclerosing cholangitis who presented with abdominal pain and worsening jaundice. (a) Fat-suppressed fast SE T2-weighted MR image reveals a heterogeneous, hyperintense mass (arrowheads) in the right hepatic lobe, with distal biliary duct dilatation. (b) Axial diffusion-weighted image (b = 500 sec/mm2) shows the mass (arrow) with bright signal intensity against a suppressed background. (c) ADC map shows the mass with peripheral restricted diffusion and a central area of necrosis (arrow). Biopsy findings were compatible with cholangiocarcinoma.
Figure 7a.

Figure 7b.

Figure 7c.

Another area of interest is the use of diffusion-weighted imaging as an alternative to gadolinium-enhanced imaging for the detection of metastatic or primary malignancies of the liver. In recent years,liver-specific contrast agents such as superparamagnetic iron oxide, which targets the reticuloendothelial system and is taken up by Kupffer cells, have shown increased tumor-to-liver contrast resulting from signal suppression in normal liver tissue. A recent study by Nishie et al (22) of 30 patients with 50 hepatocellular carcinoma nodules showed that the use of superparamagnetic iron oxide−enhanced MR imaging together with diffusion-weighted imaging yields a larger area under the ROC curve than does the use of the former imaging technique alone (0.870 ± 0.04 versus 0.820 ± 0.05 [P = .025]). Similarly, a study by Koh et al (23) of the detection of colorectal metastases to the liver showed that the addition of diffusion-weighted imaging to MR imaging with use of the liver-specific contrast agent mangafodipir trisodium yields significantly higher diagnostic accuracy (the area under the ROC curve increased to 0.96 and 0.94, respectively, for two observers) than when either technique is used alone.
Another role of diffusion-weighted imaging is in the characterization of tissue when higher b values (>500 sec/mm2) and ADC quantifications are used. After a liver lesion has been detected, high-b-value diffusion-weighted imaging in combination with contrast-enhanced MR imaging and ADC mapping can be used to further assess the lesion morphologically (Fig 8 ) (6). False-positive identification of a lesion as a malignancy can occur with T2 shine-through effect and with highly cellular benign lesions such as adenoma, focal nodular hyperplasia, or abscess. On the other hand, false-negative characterization of the tumor can occur in cases of necrotic or cystic tumors such as mucinous adenocarcinoma or well-differentiated hepatocellular adenocarcinoma (2). The application of ADC mapping in differentiating benign from malignant lesions has been the subject of a growing body of research in recent years. In a recent study of 382 patients by Miller et al (24), the mean ADC values for benign and malignant liver lesions were 2.5 × 10⁻³ mm2/sec and 1.52 × 10⁻³ mm2/sec, respectively. Whereas cysts and hemangiomas are easily distinguishable from other lesions, the ADC values of solid benign and malignant lesions overlap. Highly cellular benign lesions such as focal nodular hyperplasia and adenoma are the most problematic because they have intermediate ADC values close to those of malignant lesions, including hepatocellular carcinoma. Different studies have demonstrated variations in ADC cutoff values for different disease entities owing to significant variations in hardware, diffusion-weighted imaging techniques, and b value. At our institution, liver ADC maps are reconstructed from images obtained at b values of 0 and 750 sec/mm2.
Differentiation between malignant and benign hepatic lesions. (a–c) Hemangioma in a 58-year-old woman. (a) Fat-suppressed fast SE T2-weighted MR image shows a mass in the left hepatic lobe (arrow) with hyperintense signal. (b) Axial ADC map reconstructed from images obtained at b values of 0 and 750 sec/mm2 shows restricted diffusion due to slow-flowing blood. (c) Gadolinium-enhanced T1-weighted MR image shows the mass with centripetal enhancement (arrowheads), a finding that is characteristic of hemangioma. (d–f) Hepatocellular carcinoma in a 62-year-old woman. (d) Fat-suppressed fast SE T2-weighted MR image shows two large hypointense masses (arrows) in the left and right hepatic lobes. (e) ADC map reconstructed from images obtained at b values of 0 and 750 sec/mm2 shows restricted diffusion with low ADC values. (f) Gadolinium-enhanced T1-weighted MR image shows a heterogeneous pattern of contrast enhancement, a finding that is compatible with hepatocellular carcinoma.
Figure 8a.

Figure 8b.

Figure 8c.

Figure 8d.

Figure 8e.

Figure 8f.

Assessing posttreatment tumor response with imaging biomarkers is essential for evaluating tumor behavior, planning future therapies, and assessing tumor relapse. Tumor changes are analyzed both qualitatively and quantitatively with diffusion-weighted imaging. Qualitative analysis is based on visually assessed changes in signal intensity due to tumor treatment response—for example, an increase in ADC signal in lesions that have responded to treatment or new areas of abnormal signal intensity due to disease progression. Spatial evaluation of tumor treatment response can be achieved with use of functional diffusion maps created with registration of pre- and posttreatment ADC maps, thereby allowing the comparison of changes in ADC values at the voxel-to-voxel level (25). Response to therapy often manifests as an increase in ADC values relative to a low ADC value of the tumor at baseline (Fig 9 ). Posttreatment diffusion-weighted imaging shows different signal intensity behaviors depending on the tissue component and the type of therapy used. After transarterial chemoembolization (26) or radioembolization with yttrium-90–labeled microspheres (27), the ADC values of a hepatocellular carcinoma may show an early decrease followed by consistent increases, findings that resemble cystic or necrotic changes. Transient decreases in ADC values have also been observed after the initiation of therapy secondary to cellular swelling, decreased blood flow, or decreased volume of extracellular space.
Response to therapy administered to a 19-year-old man who presented with leiomyosarcoma of the left hepatic lobe. (a) Diffusion-weighted image (b = 600 sec/mm2) shows a mass (arrow) with restricted diffusion. (b) On an axial ADC map, the mass demonstrates decreased ADC values relative to normal liver tissue. (c) On an axial diffusion-weighted image obtained after transarterial chemoembolization, the mass (arrow) shows a lesser degree of restricted diffusion. (d) ADC map shows areas of increased signal intensity compatible with less restricted diffusion. Note the presence of necrosis (arrows) and the interval decrease in the size of the mass after therapy.
Figure 9a.

Figure 9b.

Figure 9c.

Figure 9d.

Along with contrast-enhanced MR imaging, spectroscopy, and elastography, diffusion-weighted imaging has shown promise in the evaluation of diffuse liver disease. Imaging of diffuse liver disease is based on the collagen-rich fibrotic replacement of normal liver tissue, which restricts the free diffusion of water molecules, thereby decreasing the ADC value relative to normal liver tissue (Fig 10 ). In a recent study of 78 patients with liver cirrhosis, Sandrasegaran et al (28) demonstrated that ADC values are significantly lower in patients with a higher degree of fibrosis than those in patients with less or no liver fibrosis. A correlation between ADC value and degree of fibrosis has been demonstrated in multiple studies. However, determination of the ADC cutoff value for the diagnosis or prediction of liver fibrosis and its cause is still a matter of debate. Recent studies have shown that normalized ADC values are superior to net ADC values in the diagnosis of liver fibrosis. Do et al (29) examined the feasibility of normalizing the ADC values of the liver to those of the spleen for the evaluation of liver fibrosis. They concluded that using a normalized ADC value is a potentially reproducible method with a higher diagnostic accuracy in the detection of cirrhosis and fibrosis (29).
Alcoholic cirrhosis in a 67-year-old man. (a) Gadolinium-enhanced T1-weighted MR image shows a small, nodular liver. (b) Axial diffusion-weighted image shows restricted diffusion between bands of fibrosis (arrowheads). (c) ADC map shows overall darkening of the liver parenchyma, a finding that is compatible with cirrhosis, along with diffuse fibrosis and scarring.
Figure 10a.

Figure 10b.

Figure 10c.

Renal Evaluation
The accurate characterization of renal masses is essential to ensure appropriate staging and prognosis. In addition, different subtypes of renal cell carcinoma (RCC) respond differently to molecularly targeted therapies (30). Two-time-point clinical dynamic contrast-enhanced MR imaging has shown high sensitivity and specificity in differentiating various subtypes of RCC (31). However, the corroboration of these results with those obtained with other techniques and in patients with compromised renal function remains a challenge. The pattern of increased signal intensity at diffusion-weighted imaging and decreased ADC values at ADC mapping in RCC is similar to that in solid malignant lesions of other organs (Fig 11 ). Taouli et al (31) found significantly lower ADCs in solid RCCs than in simple or mildly complex cysts and oncocytomas, and another study demonstrated higher ADC values in RCC than in transitional cell carcinoma (2.71 × 10⁻³ mm2/sec versus 1.61 × 10⁻³ mm2/sec) (32). A recent study showed sensitive and specific differentiation between clear cell, papillary, and chromophobic RCCs and suggested the use of b values of 0 and 800 sec/mm2 at 3.0 T and a threshold ADC value of 1.281 × 10⁻³ mm2/sec, with clear cell RCC showing the largest mean ADC (1.698 × 10⁻³ mm2/sec) of the three subtypes (33).
Renal disease in a 51-year-old man who presented with an asymptomatic right renal mass that had been detected at ultrasonography. (a) Axial contrast-enhanced T1-weighted MR image shows a heterogeneously enhancing mass (arrow) within the lower pole of the right kidney. (b) Axial diffusion-weighted image (b = 750 sec/mm2) shows an area of restricted diffusion (arrow) within the enhancing mass. (c) Axial ADC map of the right kidney shows restricted diffusion with low signal intensity in the lower pole (arrow), a finding that is suggestive of malignancy.
Figure 11a.

Figure 11b.

Figure 11c.

Pelvic Evaluation
Male Pelvis. —The use of diffusion-weighted imaging for the evaluation of the male pelvis focuses on the assessment of the prostate gland. There is increasing evidence that diffusion-weighted imaging improves sensitivity and specificity in the detection of prostate cancer. Recent studies have also shown diffusion-weighted imaging to have a positive impact on tumor staging and the assessment of tumor aggressiveness and treatment response. The usefulness of diffusion-weighted imaging as a biomarker for local recurrence of prostate cancer and in the evaluation of metastatic disease has also been demonstrated. Like other cancers, prostate cancer tends to have higher cellular density and an excess of intra- and intercellular membranes compared with normal glandular tissue (3). Prostate MR imaging interpretation requires review of the diffusion-weighted images and their comparison with the T2-weighted images and ADC maps. Cancer tissue has higher signal intensity on high-b-value diffusion-weighted images than does healthy prostate tissue and will demonstrate decreased ADC values (Fig 12 ). On source diffusion-weighted images, prostate cancer is usually not appreciable at b values of less than 500 sec/mm2. For prostate MR imaging, b values of 0 and 800–1500 sec/mm2 have typically been used, depending on scanning parameters. ADC maps are especially useful because of the T2 shine-through from the normal high-signal-intensity peripheral zone seen on diffusion-weighted images. The lower ADC values of prostate cancer correlate with higher cellularity at histologic analysis. Sato et al (34) compared the ADC values of normal and cancerous tissue in both the peripheral and transition zones at 1.5 T. In both zones, the ADC values of prostate cancer were significantly lower than those of benign tissue. Average ADC values calculated from diffusion-weighted imaging data acquired with a single-shot echoplanar sequence at 1.5 T for the normal peripheral zone, central portion of the prostate gland, and prostate cancer were 1.992 × 10⁻³ mm2/sec ± 0.208, 1.518 × 10⁻³ mm2/sec ± 0.126, and 1.214 × 10⁻³ mm2/sec ± 0.254, respectively (34).
Prostate cancer in a 58-year-old man who presented for evaluation of a prostate mass. MR imaging at 3.0 T was performed with an endorectal coil. (a) Axial T2-weighted MR image shows a dominant hypointense area in the right midperipheral zone (arrow). (b) Axial ADC map reconstructed from images obtained at b values of 0 and 750 mm2/sec shows a dark area (arrow) corresponding to the hypointense area seen in a with low ADC values (mean, 0.6 × 10⁻³ mm2/sec), a finding that is suggestive of prostate cancer with a high Gleason score. Histologic analysis of a specimen obtained at transrectal ultrasonography–guided biopsy revealed a dominant nodule in the right posterolateral midperipheral zone with a Gleason score of 9 (4 + 5).
Figure 12a.

Figure 12b.

Kim et al (35) imaged patients at 3.0 T with a phased-array coil and a single-shot echoplanar diffusion-weighted sequence at b values of 0 and 1000 sec/mm2. They found that the ADC values of malignant tissues were significantly lower than those of benign tissues in both the peripheral zone (1.32 × 10⁻³ mm2/sec ± 0.24 versus 1.97 × 10⁻³ mm2/sec ± 0.25) and the transition zone (1.37 × 10⁻³ mm2/sec ± 0.29 versus 1.79 × 10⁻³ mm2/sec ± 0.19). For tumor diagnosis, the use of cutoff values of 1.67 × 10⁻³ mm2/sec for the peripheral zone and 1.61 × 10⁻³ mm2/sec for the transition zone resulted in sensitivities of 94% and 91%, respectively, and specificities of 90% and 84%, respectively (35).
Although studies have shown improved sensitivity and specificity for diffusion-weighted imaging in the diagnosis of prostate cancer, tumors smaller than 5 mm are difficult to detect. In addition, inflammation may cause lower ADC values. In the transition zone, an additional challenge is posed by benign hyperplastic nodules, which can have low ADC values and thereby mimic tumor. However, when T2-weighted image interpretation is used in conjunction with ADC maps, the detection of tumor foci in the transition zone is improved (36). Postbiopsy hemorrhage in the prostate gland may result in low-signal-intensity foci on T2-weighted images and can mimic tumor on diffusion-weighted images, leading to a false-positive interpretation. However, the inclusion of T1-weighted sequences in the routine prostate MR imaging protocol allows detection of hemorrhage and direct correlation with T2- and diffusion-weighted imaging findings. Hemorrhage may decrease ADC values in benign tissues and reduce the contrast between benign and malignant tissues. In addition, hemorrhage may induce susceptibility artifacts (37).
Tumor ADC values may help identify those patients with low-risk, localized prostate cancer who may benefit from radical treatment. van As et al (38) evaluated the use of diffusion-weighted imaging–ADC mapping as a prognostic biomarker in a cohort of patients who had been (a) diagnosed with prostate cancer and (b) enrolled in an active surveillance program. The baseline ADC of cancer was shown to be an independent predictor of (a) adverse results at repeat prostate biopsy and (b) time to radical treatment (38). In a retrospective study by Park et al (39) of men who had undergone prostatectomy, the ADC was also shown to be a potential prognostic marker when multivariate analysis helped identify tumor ADC value as the only independent predictor of biochemical relapse.
For prostate cancer staging, diffusion-weighted imaging may be helpful in the assessment of seminal vesicle involvement by demonstrating low ADC values in that region (provided no hemorrhage is present on T1-weighted images), as well as in the staging of lymph nodes, since malignant nodes tend to have lower ADC values (40). Improved detection of metastatic nodes with diffusion-weighted imaging may aid in treatment planning.
ADC values have been shown to be a promising imaging biomarker for monitoring patients treated with radiation therapy. In a study by Song et al (41), the mean ADC value of tumor was shown to increase after radiation therapy, whereas the mean posttherapy ADC values of benign peripheral and transition zones were lower than their pretherapy values. In patients with biochemical relapse after undergoing radiation therapy, the use of diffusion-weighted imaging together with T2-weighted imaging showed greater sensitivity for the detection of recurrence than did T2-weighted imaging alone (42). In patients with metastatic bone disease, an increase in tumor ADC value correlated with decreasing prostate-specific antigen levels in those who were treated with androgen deprivation therapy (43).
Female Pelvis. —The addition of diffusion-weighted imaging to the conventional MR imaging protocol allows the assessment of oncologic entities in the female pelvis, from lesion detection and characterization to staging of malignancies. MR imaging has been shown to be superior to conventional imaging methods and clinical examination for the staging of cervical cancer (44). Cervical cancer demonstrates lower ADC values (ie, more restricted diffusion) than does normal cervical tissue, thereby increasing the detection power of diffusion-weighted imaging (Fig 13 ). Naganawa et al (45) studied 12 patients with cervical cancer and found the ADC value of cancerous tissue to be significantly lower than that of normal cervical tissue (1.09 × 10⁻³ mm2/sec ± 0.20 versus 1.79 × 10⁻³ mm2/sec ± 0.24) (P < .0001). However, the ADC cutoff value for differentiation between cancer and normal cervical tissue and between different types of cancer has varied widely among institutions, a fact that can be attributed to variability in the hardware and image analysis techniques used. Diffusion-weighted imaging has shown promise for the staging of cervical cancer by allowing more accurate determination of depth of invasion and status of nodal involvement (Fig 13) (46). In a 3.0-T MR imaging study of 50 patients, Lin et al (46) demonstrated that metastatic lymph nodes had significantly lower ADC values than did intact lymph nodes (0.06 × 10⁻³ mm2/sec versus 0.21 × 10⁻³ mm2/sec) (P < .001). The authors also found that the sensitivity of combined node size and ADC value was higher than that of conventional MR imaging (83% versus 25%), with equal specificity (98% and 99%, respectively) (46). The role of diffusion-weighted imaging is more controversial in distinguishing ovarian cancer from benign ovarian lesions. There is additional benefit when diffusion-weighted imaging is combined with conventional MR imaging for the staging of ovarian cancer and peritoneal metastases. In a study of 34 patients with ovarian cancer by Low et al (47), a combination of diffusion-weighted imaging and conventional contrast-enhanced MR imaging had a higher sensitivity and accuracy for the detection of metastatic peritoneal implants than did either method alone. Peritoneal implants demonstrate restricted diffusion on diffusion-weighted images and, consequently, low ADC values. The presence of ascites can help improve the delineation and conspicuity of implant lesions (47). Moreover, the addition of diffusion-weighted imaging to conventional MR imaging methods has proved beneficial for the detection and staging of endometrial cancer, including assessment of the depth of invasion as an indicator of potential metastatic spread of malignancy. In a study of 48 patients with endometrial cancer, Lin et al (48) showed that the addition of diffusion-weighted imaging to T2-weighted and dynamic contrast-enhanced MR imaging increased accuracy in the detection of myometrial involvement compared with any of these methods alone.
FIGO (International Federation of Gynecology and Obstetrics) IIB–stage 3A cervical carcinoma (stage determined on the basis of the presence of right hydronephrosis) in a 30-year-old woman. At clinical examination, a mass involving the upper half of the vagina was noted, with the cervix pulled to the right. Metastatic adenopathy was detected at 1.5-T MR imaging performed with a body matrix coil. (a) Axial T2-weighted MR image (repetition time msec/echo time msec = 5790/84) shows a hyperintense tumor (arrow) involving the cervix and extending to the right upper vagina. (b) Axial diffusion-weighted image (b = 50, 400, and 800 sec/mm2)–ADC map shows restricted diffusion in the region of the cancer with an ADC value of 0.7 × 10⁻³ mm2/sec (circled area). (c) Axial diffusion-weighted image–ADC map shows a focus of restricted diffusion within an enlarged left common iliac node (arrow) with an ADC value of 0.6 × 10⁻³ mm2/sec.
Figure 13a.

Figure 13b.

Figure 13c.

Whole-Body Diffusion-weighted Imaging
There are a few reports in the literature about the feasibility of whole-body diffusion-weighted imaging in the assessment of cancer patients (49). It is clear that by combining anatomic imaging (eg, T1- and T2-weighted imaging) with whole-body diffusion-weighted imaging, early changes within the primary tumor and metastatic sites can be visualized, which can provide important information about treatment response and permit the development of individualized treatment regimens. Therefore, use of these whole-body diffusion-weighted imaging methods for the detection and classification of cancer and the monitoring of treatment are goals that are clearly attainable in the near future (Fig 14 ). A whole-body diffusion-weighted imaging technique known as “diffusion-weighted whole-body imaging with background body signal suppression” was first described by Takahara et al (49) in a study performed at 1.5 T. This technique makes use of a free breathing approach during imaging, multiple thin axial sections, and a large number of signals acquired. In addition, fat suppression is applied with either short inversion time inversion-recovery or some other robust method. In essence, diffusion-weighted imaging with background body signal suppression exploits both coherent and incoherent intravoxel motion, making use of free breathing during imaging to help visualize the organ of interest (50). It should be noted that for accurate background suppression, both large b values (>500 sec/mm2) and a large number of signals acquired are necessary, thereby increasing acquisition times.
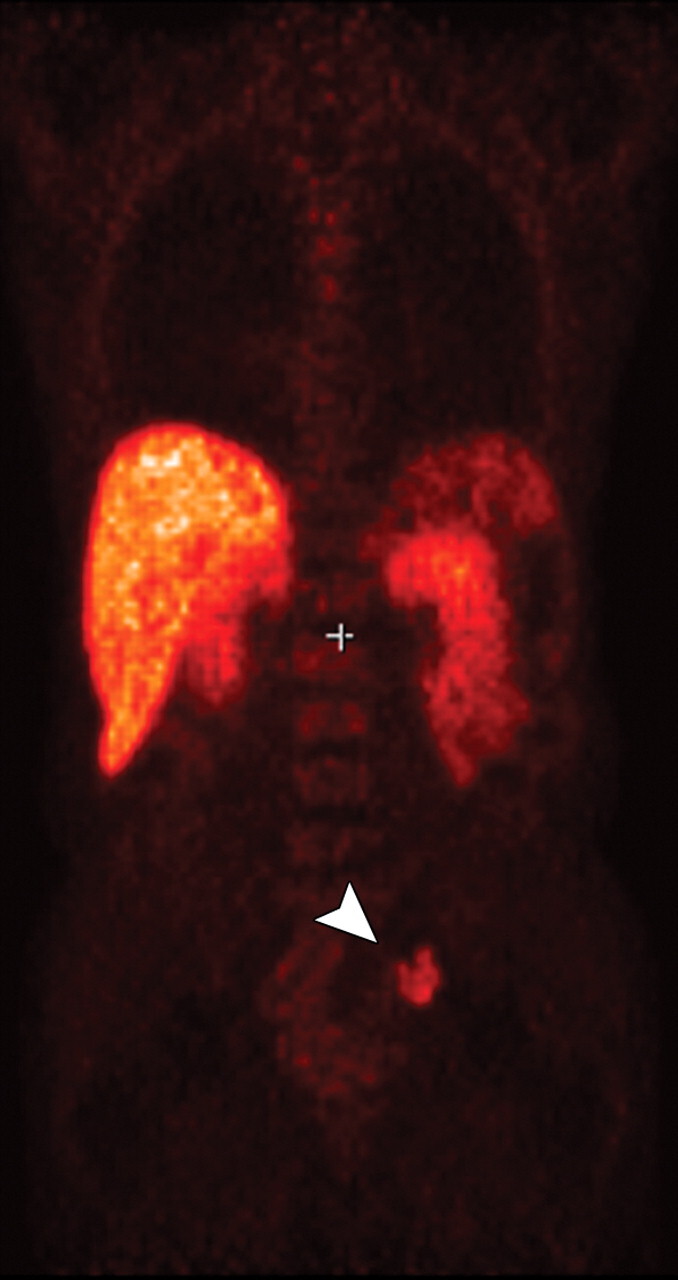
Metastatic adenopathy in a 71-year-old man with a history of prostate cancer who presented with a rising prostate-specific antigen level. (a) Whole-body T2-weighted MR image shows an area of slightly increased signal intensity (arrowhead) in the left side of the pelvis. (b) Whole-body ADC map shows restricted diffusion within the lesion (arrowhead), a finding that is compatible with metastatic left iliac adenopathy. The lesion has an ADC value of 0.83 × 10⁻³ mm2/sec ± 0.08. (c) Carbon-11 positron emission tomographic image shows the lesion (arrowhead) with increased radiotracer activity and an increased standardized uptake value of 5.6.
Figure 14a.
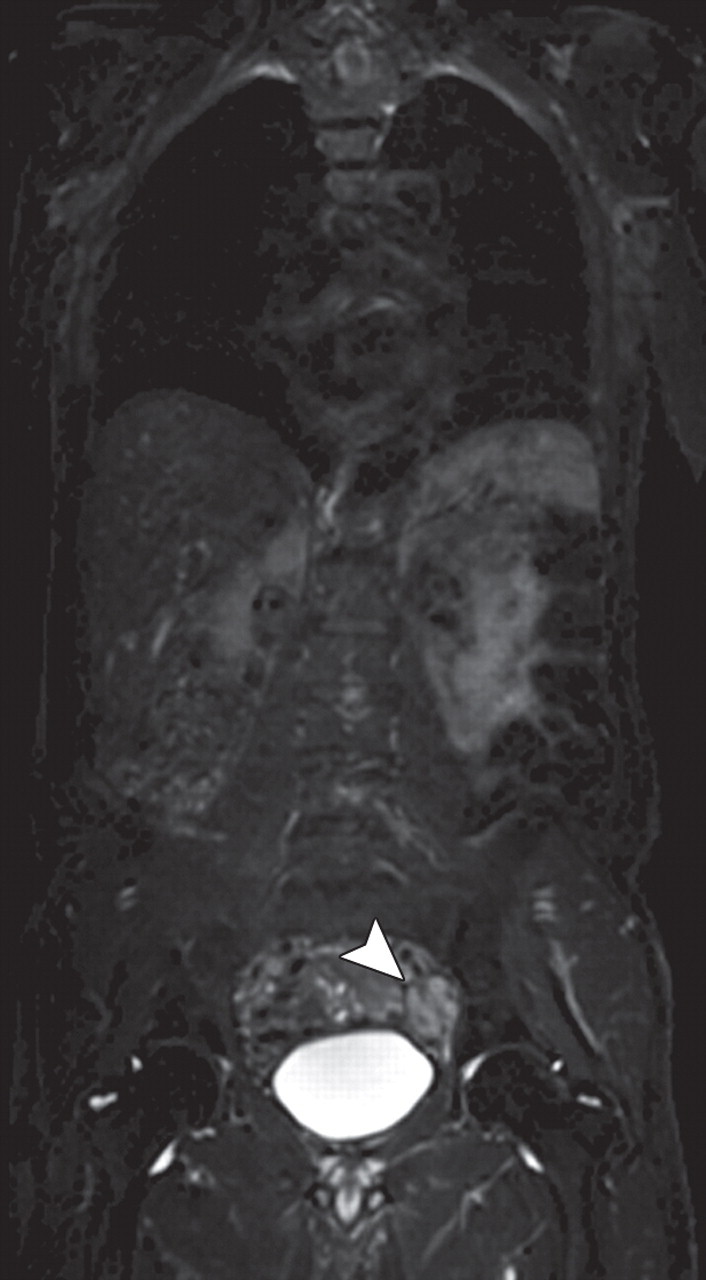
Figure 14b.
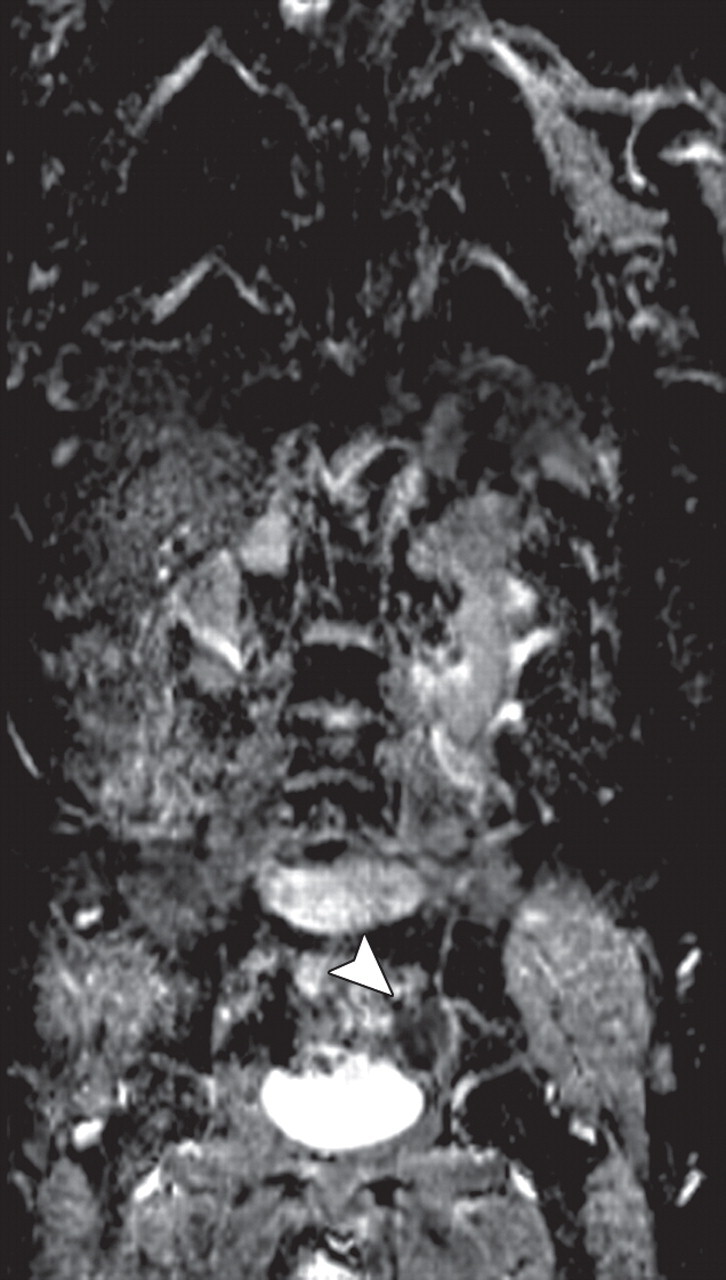
Figure 14c.
Conclusions
Diffusion-weighted imaging–ADC mapping provides information about the functional environment of water in tissues, thereby augmenting the morphologic information provided by conventional MR imaging. Detected changes include shifts of water from extracellular to intracellular spaces, restriction of cellular membrane permeability, increased cellular density, and disruption of cellular membrane depolarization. These findings are commonly associated with malignancies; therefore, diffusion-weighted imaging has many applications in oncologic imaging, providing functional information to complement the excellent anatomic detail provided by MR imaging, and thereby aiding in tumor detection and characterization and in the prediction and assessment of response to therapy.
Acknowledgments
Disclosures of Potential Conflicts of Interest.—I.R.K.: Related financial activities: patent with Siemens Medical. Other financial activities: none. K.J.M.: Related financial activities: grant from Siemens Medical. Other financial activities:
Recipient of a Certificate of Merit award for an education exhibit at the 2010 RSNA Annual Meeting.
For this journal-based CME activity, the authors I.R.K. and K.J.M. have disclosed various financial relationships (see p 1790); all other authors, the editor, and reviewers have no relevant relationships to disclose.
Abbreviations:
- ADC
- apparent diffusion coefficient
- RCC
- renal cell carcinoma
- ROC
- receiver operating characteristic
- SE
- spin-echo
References
- 1. Koh DM, Collins DJ. Diffusion-weighted MRI in the body: applications and challenges in oncology. AJR Am J Roentgenol 2007;188(6):1622–1635. [DOI] [PubMed] [Google Scholar]
- 2. Taouli B, Koh DM. Diffusion-weighted MR imaging of the liver. Radiology 2010;254(1):47–66. [DOI] [PubMed] [Google Scholar]
- 3. desouza NM, Reinsberg SA, Scurr ED, Brewster JM, Payne GS. . Magnetic resonance imaging in prostate cancer: the value of apparent diffusion coefficients for identifying malignant nodules. Br J Radiol 2007;80(950):90–95. [DOI] [PubMed] [Google Scholar]
- 4. Sinha S, Lucas-Quesada FA, Sinha U, DeBruhl N, Bassett LW. In vivo diffusion-weighted MRI of the breast: potential for lesion characterization. J Magn Reson Imaging 2002;15(6):693–704. [DOI] [PubMed] [Google Scholar]
- 5. Kwee TC, Takahara T, Ochiai R, et al. Whole-body diffusion-weighted magnetic resonance imaging. Eur J Radiol 2009;70(3):409–417. [DOI] [PubMed] [Google Scholar]
- 6. Qayyum A. Diffusion-weighted imaging in the abdomen and pelvis: concepts and applications. RadioGraphics 2009;29(6):1797–1810. [DOI] [PMC free article] [PubMed] [Google Scholar]
- 7. Neil JJ. Diffusion imaging concepts for clinicians. J Magn Reson Imaging 2008;27(1):1–7. [DOI] [PubMed] [Google Scholar]
- 8. Le Bihan D, Breton E, Lallemand D, Aubin ML, Vignaud J, Laval-Jeantet M. Separation of diffusion and perfusion in intravoxel incoherent motion MR imaging. Radiology 1988;168(2):497–505. [DOI] [PubMed] [Google Scholar]
- 9. Le Bihan D, Poupon C, Amadon A, Lethimonnier F. Artifacts and pitfalls in diffusion MRI. J Magn Reson Imaging 2006;24(3):478–488. [DOI] [PubMed] [Google Scholar]
- 10. Wang CL, Chea YW, Boll DT, et al. Effect of gadolinium chelate contrast agents on diffusion weighted MR imaging of the liver, spleen, pancreas and kidney at 3T. Eur J Radiol 2010 Jun 18. [Epub ahead of print] [DOI] [PubMed] [Google Scholar]
- 11. Partridge SC, Mullins CD, Kurland BF, et al. Apparent diffusion coefficient values for discriminating benign and malignant breast MRI lesions: effects of lesion type and size. AJR Am J Roentgenol 2010;194(6):1664–1673. [DOI] [PubMed] [Google Scholar]
- 12. Pereira FP, Martins G, Carvalhaes de Oliveira RdeV. Diffusion magnetic resonance imaging of the breast. Magn Reson Imaging Clin N Am 2011;19(1): 95–110. [DOI] [PubMed] [Google Scholar]
- 13. El Khouli RH, Jacobs MA, Mezban SD, et al. Diffusion-weighted imaging improves the diagnostic accuracy of conventional 3.0-T breast MR imaging. Radiology 2010;256(1):64–73. [DOI] [PMC free article] [PubMed] [Google Scholar]
- 14. Pereira FP, Martins G, Figueiredo E, et al. Assessment of breast lesions with diffusion-weighted MRI: comparing the use of different b values. AJR Am J Roentgenol 2009;193(4):1030–1035. [DOI] [PubMed] [Google Scholar]
- 15. Bogner W, Gruber S, Pinker K, et al. Diffusion-weighted MR for differentiation of breast lesions at 3.0 T: how does selection of diffusion protocols affect diagnosis? Radiology 2009;253(2):341–351. [DOI] [PubMed] [Google Scholar]
- 16. Costantini M, Belli P, Rinaldi P, et al. Diffusion-weighted imaging in breast cancer: relationship be-tween apparent diffusion coefficient and tumor ag-gressiveness. Clin Radiol 2010;65(12):1005–1012. [DOI] [PubMed] [Google Scholar]
- 17. Partridge SC, McKinnon GC, Henry RG, Hylton NM. Menstrual cycle variation of apparent diffusion coefficients measured in the normal breast using MRI. J Magn Reson Imaging 2001;14(4):433–438. [DOI] [PubMed] [Google Scholar]
- 18. Sharma U, Danishad KK, Seenu V, Jagannathan NR. Longitudinal study of the assessment by MRI and diffusion-weighted imaging of tumor response in patients with locally advanced breast cancer undergoing neoadjuvant chemotherapy. NMR Biomed 2009;22(1):104–113. [DOI] [PubMed] [Google Scholar]
- 19. Park SH, Moon WK, Cho N, et al. Diffusion-weighted MR imaging: pretreatment prediction of response to neoadjuvant chemotherapy in patients with breast cancer. Radiology 2010;257(1):56–63. [DOI] [PubMed] [Google Scholar]
- 20. Parikh T, Drew SJ, Lee VS, et al. Focal liver lesion detection and characterization with diffusion-weighted MR imaging: comparison with standard breath-hold T2-weighted imaging. Radiology 2008; 246(3):812–822. [DOI] [PubMed] [Google Scholar]
- 21. Bruegel M, Gaa J, Waldt S, et al. Diagnosis of hepatic metastasis: comparison of respiration-triggered diffusion-weighted echo-planar MRI and five t2-weighted turbo spin-echo sequences. AJR Am J Roentgenol 2008;191(5):1421–1429. [DOI] [PubMed] [Google Scholar]
- 22. Nishie A, Tajima T, Ishigami K, et al. Detection of hepatocellular carcinoma (HCC) using super paramagnetic iron oxide (SPIO)-enhanced MRI: added value of diffusion-weighted imaging (DWI). J Magn Reson Imaging 2010;31(2):373–382. [DOI] [PubMed] [Google Scholar]
- 23. Koh DM, Brown G, Riddell AM, et al. Detection of colorectal hepatic metastases using MnDPDP MR imaging and diffusion-weighted imaging (DWI) alone and in combination. Eur Radiol 2008;18(5): 903–910. [DOI] [PubMed] [Google Scholar]
- 24. Miller FH, Hammond N, Siddiqi AJ, et al. Utility of diffusion-weighted MRI in distinguishing benign and malignant hepatic lesions. J Magn Reson Imaging 2010;32(1):138–147. [DOI] [PubMed] [Google Scholar]
- 25. Padhani AR, Koh DM. Diffusion MR imaging for monitoring of treatment response. Magn Reson Imaging Clin N Am 2011;19(1):181–209. [DOI] [PubMed] [Google Scholar]
- 26. Kamel IR, Bluemke DA, Eng J, et al. The role of functional MR imaging in the assessment of tumor response after chemoembolization in patients with hepatocellular carcinoma. J Vasc Interv Radiol 2006; 17(3):505–512. [DOI] [PubMed] [Google Scholar]
- 27. Deng J, Miller FH, Rhee TK, et al. Diffusion-weighted MR imaging for determination of hepatocellular carcinoma response to yttrium-90 radioembolization. J Vasc Interv Radiol 2006;17(7): 1195–1200. [DOI] [PubMed] [Google Scholar]
- 28. Sandrasegaran K, Akisik FM, Lin C, et al. Value of diffusion-weighted MRI for assessing liver fibrosis and cirrhosis. AJR Am J Roentgenol 2009;193(6): 1556–1560. [DOI] [PubMed] [Google Scholar]
- 29. Do RK, Chandarana H, Felker E, et al. Diagnosis of liver fibrosis and cirrhosis with diffusion-weighted imaging: value of normalized apparent diffusion coefficient using the spleen as reference organ. AJR Am J Roentgenol 2010;195(3):671–676. [DOI] [PubMed] [Google Scholar]
- 30. Sun MR, Ngo L, Genega EM, et al. Renal cell carcinoma: dynamic contrast-enhanced MR imaging for differentiation of tumor subtypes—correlation with pathologic findings. Radiology 2009;250(3): 793–802. [DOI] [PubMed] [Google Scholar]
- 31. Taouli B, Thakur RK, Mannelli L, et al. Renal lesions: characterization with diffusion-weighted imaging versus contrast-enhanced MR imaging. Radiology 2009;251(2):398–407. [DOI] [PubMed] [Google Scholar]
- 32. Paudyal B, Paudyal P, Tsushima Y, et al. The role of the ADC value in the characterisation of renal carcinoma by diffusion-weighted MRI. Br J Radiol 2010;83(988):336–343. [DOI] [PMC free article] [PubMed] [Google Scholar]
- 33. Wang H, Cheng L, Zhang X, et al. Renal cell carcinoma: diffusion-weighted MR imaging for subtype differentiation at 3.0 T. Radiology 2010;257(1): 135–143. [DOI] [PubMed] [Google Scholar]
- 34. Sato C, Naganawa S, Nakamura T, et al. Differentiation of noncancerous tissue and cancer lesions by apparent diffusion coefficient values in transition and peripheral zones of the prostate. J Magn Reson Imaging 2005;21(3):258–262. [DOI] [PubMed] [Google Scholar]
- 35. Kim CK, Park BK, Han JJ, Kang TW, Lee HM. Diffusion-weighted imaging of the prostate at 3 T for differentiation of malignant and benign tissue in transition and peripheral zones: preliminary results. J Comput Assist Tomogr 2007;31(3):449–454. [DOI] [PubMed] [Google Scholar]
- 36. Yoshimitsu K, Kiyoshima K, Irie H, et al. Usefulness of apparent diffusion coefficient map in diagnosing prostate carcinoma: correlation with stepwise histopathology. J Magn Reson Imaging 2008;27(1): 132–139. [DOI] [PubMed] [Google Scholar]
- 37. Park BK, Lee HM, Kim CK, Choi HY, Park JW. Lesion localization in patients with a previous negative transrectal ultrasound biopsy and persistently elevated prostate specific antigen level using diffusion-weighted imaging at three Tesla before rebiopsy. Invest Radiol 2008;43(11):789–793. [DOI] [PubMed] [Google Scholar]
- 38. van As NJ, de Souza NM, Riches SF, et al. A study of diffusion-weighted magnetic resonance imaging in men with untreated localised prostate cancer on active surveillance. Eur Urol 2009;56(6):981–987. [DOI] [PubMed] [Google Scholar]
- 39. Park SY, Kim CK, Park BK, Lee HM, Lee KS. Prediction of biochemical recurrence following radical prostatectomy in men with prostate cancer by diffusion-weighted magnetic resonance imaging: initial results. Eur Radiol 2011;21(5):1111–1118. [DOI] [PubMed] [Google Scholar]
- 40. Eiber M, Beer AJ, Holzapfel K, et al. Preliminary results for characterization of pelvic lymph nodes in patients with prostate cancer by diffusion-weighted MR-imaging. Invest Radiol 2010;45(1):15–23. [DOI] [PubMed] [Google Scholar]
- 41. Song I, Kim CK, Park BK, Park W. Assessment of response to radiotherapy for prostate cancer: value of diffusion-weighted MRI at 3 T. AJR Am J Roentgenol 2010;194(6):W477–W482. [Published correction appears in AJR Am J Roentgenol 2010;195(2): 534.] [DOI] [PubMed] [Google Scholar]
- 42. Kim CK, Park BK, Lee HM. Prediction of locally recurrent prostate cancer after radiation therapy: incremental value of 3T diffusion-weighted MRI. J Magn Reson Imaging 2009;29(2):391–397. [DOI] [PubMed] [Google Scholar]
- 43. Reischauer C, Froehlich JM, Koh DM, et al. Bone metastases from prostate cancer: assessing treatment response by using diffusion-weighted imaging and functional diffusion maps—initial observations. Radiology 2010;257(2):523–531. [DOI] [PubMed] [Google Scholar]
- 44. Punwani S. Diffusion weighted imaging of female pelvic cancers: concepts and clinical applications. Eur J Radiol 2011;78(1):21–29. [DOI] [PubMed] [Google Scholar]
- 45. Naganawa S, Sato C, Kumada H, Ishigaki T, Miura S, Takizawa O. Apparent diffusion coefficient in cervical cancer of the uterus: comparison with the normal uterine cervix. Eur Radiol 2005;15(1):71–78. [DOI] [PubMed] [Google Scholar]
- 46. Lin G, Ho KC, Wang JJ, et al. Detection of lymph node metastasis in cervical and uterine cancers by diffusion-weighted magnetic resonance imaging at 3T. J Magn Reson Imaging 2008;28(1):128–135. [DOI] [PubMed] [Google Scholar]
- 47. Low RN, Sebrechts CP, Barone RM, Muller W. Diffusion-weighted MRI of peritoneal tumors: comparison with conventional MRI and surgical and histopathologic findings—a feasibility study. AJR Am J Roentgenol 2009;193(2):461–470. [DOI] [PubMed] [Google Scholar]
- 48. Lin G, Ng KK, Chang CJ, et al. Myometrial invasion in endometrial cancer: diagnostic accuracy of diffusion-weighted 3.0-T MR imaging—initial experience. Radiology 2009;250(3):784–792. [DOI] [PubMed] [Google Scholar]
- 49. Takahara T, Imai Y, Yamashita T, Yasuda S, Nasu S, Van Cauteren M. Diffusion weighted whole body imaging with background body signal suppression (DWIBS): technical improvement using free breathing, STIR and high resolution 3D display. Radiat Med 2004;22(4):275–282. [PubMed] [Google Scholar]
- 50. Le Bihan D, Breton E, Lallemand D, Grenier P, Cabanis E, Laval-Jeantet M. MR imaging of intravoxel incoherent motions: application to diffusion and perfusion in neurologic disorders. Radiology 1986; 161(2):401–407. [DOI] [PubMed] [Google Scholar]