Abstract
The segmentation of brain structures is a key component of many neuroimaging studies. Consistent anatomical definitions are crucial to ensure consensus on the position and shape of brain structures, but segmentations are prone to variation in their interpretation and execution. White‐matter (WM) pathways are global structures of the brain defined by local landmarks, which leads to anatomical definitions being difficult to convey, learn, or teach. Moreover, the complex shape of WM pathways and their representation using tractography (streamlines) make the design and evaluation of dissection protocols difficult and time‐consuming. The first iteration of Tractostorm quantified the variability of a pyramidal tract dissection protocol and compared results between experts in neuroanatomy and nonexperts. Despite virtual dissection being used for decades, in‐depth investigations of how learning or practicing such protocols impact dissection results are nonexistent. To begin to fill the gap, we evaluate an online educational tractography course and investigate the impact learning and practicing a dissection protocol has on interrater (groupwise) reproducibility. To generate the required data to quantify reproducibility across raters and time, 20 independent raters performed dissections of three bundles of interest on five Human Connectome Project subjects, each with four timepoints. Our investigation shows that the dissection protocol in conjunction with an online course achieves a high level of reproducibility (between 0.85 and 0.90 for the voxel‐based Dice score) for the three bundles of interest and remains stable over time (repetition of the protocol). Suggesting that once raters are familiar with the software and tasks at hand, their interpretation and execution at the group level do not drastically vary. When compared to previous work that used a different method of communication for the protocol, our results show that incorporating a virtual educational session increased reproducibility. Insights from this work may be used to improve the future design of WM pathway dissection protocols and to further inform neuroanatomical definitions.
Keywords: diffusion MRI, reproducibility, segmentation, tractography, virtual dissection, WM pathways
Structural connectivity reconstructed using diffusion magnetic resonance imaging tractography can isolate white‐matter pathways using a technique called virtual dissection. Human variability in the interpretation and execution of the virtual dissection causes a measurement error in the digital reconstruction of pathways. This work quantifies the variability of a specific protocol taught using an online course and the impact of repeating the procedures (practices) on variability.
1. INTRODUCTION
Effectively conveying information in a research setting is challenging. It is common to expect researchers to quickly understand complex information or to be able to fill in the gaps if the information is missing. When dealing with intricate tasks or software, this premise often leads to inefficient communication. For example, diffusion tractography is used to study the connections of the brain. A chosen protocol or method must be reproducible to facilitate studies of the white‐matter (WM) pathways of the brain. Teaching and conveying a protocol involves describing both complex anatomy and software usage. In our previous work (Rheault et al., 2020), we introduced a pyramidal tract (PYT) dissection protocol inspired by (Chenot et al., 2019) and evaluated the performance of collaborators executing the instructions. Collaborators were split into two groups: Experts with advanced knowledge in neuroanatomy and nonexperts with only basic/no knowledge in neuroanatomy. Tractostorm (V1) showed experts and nonexperts had similar levels of variability (between 0.60 and 0.65 for the voxel‐based Dice score) with a large deviation for the average.
In this work, we evaluate the efficacy of teaching an online education session for a WM dissection protocol. The purpose of this study is to help improve the future design of WM pathway dissection protocols and to further inform neuroanatomical definitions by evaluating quality improvement data from a conducted course. This is a step toward creating standardized definitions and improving the way they are taught. Expertise in bundles reproducibility analysis from the mentioned prior work allows us to expand the current analysis into WM pathways spatial agreement. In addition to the original protocol (Rheault, De Benedictis et al., 2020, which only included PYT), we add two bundles (the arcuate fasciculus [AF] and body of the corpus callosum [CC]) to the project. The investigation of the efficacy of teaching an online course (as opposed to basing learning only on written instructions) aims to help to understand the complexity of anatomical and software descriptions and assess where difficulties are and where clarifications could be needed.
Magnetic resonance imaging (MRI) has become the tool of choice for the in vivo investigation of the brain in neuroimaging studies due to its high resolution and variety of available contrasts. MRI has become the gold standard for manual and automatic segmentation of cerebral structures in the hope of finding relevant biomarkers (Boccardi et al., 2011; Fennema‐Notestine et al., 2009; Pagnozzi, Conti, Calderoni, Fripp, & Rose, 2018). However, this quest highlighted the heterogeneity of anatomical definitions (Frisoni et al., 2015; Gasperini et al., 2001; Rosario et al., 2011; Visser et al., 2019).
Diffusion MRI, and more specifically tractography, specializes in the virtual reconstruction of structural connectivity of the brain (Griffa, Baumann, Thiran, & Hagmann, 2013; Hagmann et al., 2008; Jones, Simmons, Williams, & Horsfield, 1998). As opposed to locally defined gray matter structures, WM pathways connect distant regions (Catani & De Schotten, 2008; Yeh et al., 2018), cross each other, and have a complex shape including fanning, torsion, long‐distance curvature, and sharp turns (Maier‐Hein et al., 2017; Rheault, Poulin, Caron, St‐Onge, & Descoteaux, 2020). Historically, anatomical definitions of WM pathways were scarce and came in a variety of languages, which led to coexisting definitions of the same, or similar, underlying structures. Disagreements in nomenclature (Mandonnet, Sarubbo, & Petit, 2018; Panesar & Fernandez‐Miranda, 2019), evolving knowledge of projection (Chenot et al., 2019; Nathan & Smith, 1955), association (Catani et al., 2007; Geschwind, 1970), or commissural (Benedictis et al., 2016; Witelson, 1985) pathways and debate over the existence (or lack thereof) of specific connections (Forkel et al., 2014; Meola, Comert, Yeh, Stefaneanu, & Fernandez‐Miranda, 2015; Türe, Yaşargil, & Pait, 1997) all have contributed to variations in anatomical definitions which have led to discrepancies in the WM pathways bearing the same name (Schilling et al., 2020; Vavassori, Sarubbo, & Petit, 2021).
The complex shape and inherent representation of tractography (streamlines) make the interpretation of anatomical definitions and the subsequent dissection of WM pathway, also named virtual dissection (Catani, Howard, Pajevic, & Jones, 2002; Mori & van Zijl, 2002), challenging. Additionally, the level of familiarity with software or with data and slight differences in decision‐making can all influence the dissection protocols carried out by a specific individual (intrarater reproducibility). The way the virtual dissection is performed will inherently vary across individuals performing it (interrater reproducibility). Moreover, the widespread use of tractography in population studies (e.g., aging or development) and surgery planning (e.g., deep‐brain stimulation or electrode placement for epilepsy) and the diversity of anatomical definitions made it difficult to interpret results and outcomes across publications (e.g., meta‐analyses). However, the need for standardization of clinical protocols is not unique to tractography (Boccardi et al., 2011; Frisoni et al., 2015) or even to neuroimaging (Sefcikova, Sporrer, Ekert, Kirkman, & Samandouras, 2020).
There are three key challenges to investigating virtual dissection reproducibility. First, clear and concise anatomical definition and dissection protocol are rarely agreed upon. Second, the time‐consuming nature of manual dissection makes data gathering burdensome. Third, the digital representation of WM pathways from tractography (streamlines) makes the quantification and interpretation of reproducibility difficult and creates computational challenges.
Our main goal is to assess the consistency of raters performing repeated virtual dissection tasks and to investigate variables that impact the results. The contributions of this study are threefold. First, we quantify intrarater and interrater reproducibility for raters performing the same dissection protocol on matched data. Second, we investigate the longitudinal relationship between reproducibility scores and protocol repetitions (i.e., practice). Third, we included an online educational session that encompasses an introduction to the project, software tutorials, and a live protocol demonstration to examine its impact against previous work that included written instruction only (pdf document).
2. METHODS
2.1. Study design
To perform the tasks required by the protocol, we formed a consortium of 20 collaborators (raters) from institutions in Canada, Italy, and the United States. Most collaborators are researchers familiar with tractography and the concept of virtual dissection but without any neuroanatomy background. A minority of collaborators had an advanced background in neuroanatomy. In the context of this work, collaborators' background was not part of the investigation. First, the purpose of this study is to conduct an evaluation of protocol quality after an online course. Second, as shown in the initial Tractostorm project, this distinction (presented as “nonexperts” and “experts”) had a limited impact on reproducibility scores. All collaborators in our study will be referred to as “raters” as they are manually annotating data sets. This study has been reviewed by the Internal Review Board of Vanderbilt University (#211156).
Raters attended a 2‐hr online educational session on the virtual dissection software (MI‐Brain; Rheault, Houde, Goyette, Morency, & Descoteaux, 2016) and followed instructions to perform the dissection protocol. The raters also had access to a detailed document on the dissection protocol (available at doi.org/10.5281/zenodo.5190145 and in Supplementary Materials). This document contains all the instructions related to the virtual dissection tasks and how to identify/locate landmarks. As the results of this work are directly related to the protocol used, reporting the exact instructions provided to the raters is crucial. This document was based on the original one from Rheault, De Benedictis, et al. (2020). Two new bundles of interest were added following the same template as the original document. To respect the experimental design, the raters were instructed to strictly follow the instructions, to perform the tasks on their own time in the 2 months following the online session, on the provided data, to follow the same data set ordering, and to use the same software.
Raters performed virtual dissection of the body of the CC, left AF, and left PYT on 20 data sets. Unknown to our raters, the 20 data sets were in fact five Human Connectome Project (HCP; Glasser et al., 2013) subjects that were duplicated four times (subject 1‐2‐3‐4‐5, 1‐2‐3‐4‐5, …). In this work, the four duplicates will be referred to as “timepoints” due to the fact that our study design requires raters to perform a sequential annotation of data sets. The duplicated data sets were not scan–rescan, they were identical copies of tractograms and maps already processed by the authors. By providing identical tractograms, only the variability induced by the manual segmentations was targeted rather than variability induced by the processing pipelines. The project involved no processing from the collaborators and aimed to quantify only how consistent the segmentation obtained from a specific protocol was. The raters were instructed to save the regions of interest (ROIs) defined by the segmentation as well as the resulting bundles. For this work, the relevant data submitted by each rater was composed of 3 (bundles) × 5 (HCP) × 4 (timepoints) = 60 files (trk file format).
The original data provided to the raters was the same as described in Rheault, De Benedictis, et al. (2020). Briefly, probabilistic particle filtering tractography (Girard, Whittingstall, Deriche, & Descoteaux, 2014) from constrained spherical deconvolution (Tournier et al., 2008) produced around 1.5 M streamlines for each data set. The decision to provide the same data was made to facilitate potential comparisons between both projects. Data quality and processing were adapted for the current study design. Since the data had already been used in a similar study, uncertainty related to computer performance during the virtual dissection was low.
2.2. Dissection protocol
Our goal is to evaluate the capacity of raters to perform repeated virtual dissection tasks. These tasks are limited to ROIs “drawing” (i.e., shape, size, and position) on provided data. The raters only had to open the software and load the preprocessed data (tractograms and maps), then follow instructions to identify anatomical landmarks as described.
One of the limiting factors in the initial Tractostorm project was the use of only one bundle of interest. This was due to the initial complexity of the study design and the number of unknown variables. Using the same template and aiming for the same level of clarity, a dissection protocol was defined for each of the three bundles of interest (CC, AF, and PYT). The prior work helped with refining the project and allowed us to expand the number of bundles. The decision to limit dissection to one hemisphere (left AF and left PYT) was made to reduce the workload for our raters.
As part of the protocol, 15 ROIs had to be drawn per data set. Then, three bundles had to be dissected using a subset of ROIs and rules such as inclusion and exclusion. Once a data set was dissected and the required files saved, modifications were not allowed. If a major mistake (e.g., mixing up left/right) was observed before the following data set was started, corrections were allowed.
To ensure a similar level of familiarity with the software used for the project among all raters, the software and protocol were introduced in a 2‐hr online educational session. The recording of the online educational session and a document describing in detail the protocol were made available to the raters. Collaboration between raters was not allowed. Minimal interaction with the principal investigator was allowed to confirm tasks' interpretation (software installation, data set ordering, files to save, how to submit, etc.). Following the course, the principal investigator stayed available for questions as well as encouraged to practice the protocol and experience the software if needed. However, due to time zone differences, some raters (in Europe) reached the end of their workday. Raters were allowed to ask general questions (that were emailed to everyone via email if necessary).
Raters had to complete the tasks on their own schedule within 2 months following the online course. This was considered a realistic timeline that would accommodate all collaborators considering the various stages of their academic career/schedule during the COVID‐19 pandemic and the fact that the expected duration of the task was estimated to be 10–20 hr. This personal freedom in the submission timeline was also allowed in the first Tractostorm project and justified because of the difficulty to supervise/control the schedule of 20 international researchers.
2.3. Analysis
To quantify the reproducibility between timepoints (intrarater) or across the group (interrater) within a single timepoint (Figure 1), metrics adapted to the data representation were chosen. To accurately portray agreement and for consistency with the prior work of Rheault, De Benedictis, et al. (2020), three metrics were chosen for the analysis.
FIGURE 1.
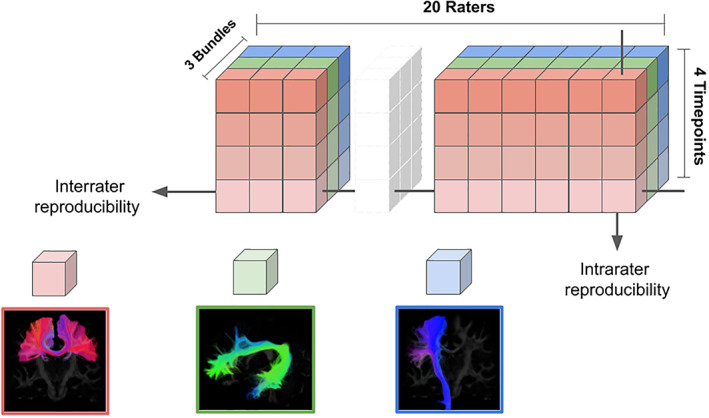
Representation of the study design. Twenty collaborators (raters) contributed by carrying out our protocol, each had three bundle dissections to perform for each of the 20 data sets. The 20 data sets were five HCP subjects (missing from the figure) each with four timepoints. The total submitted data consisted of 1,200 bundles and 6,000 ROIs. HCP, Human Connectome Project
2.3.1. Dice score of voxels
Quantify spatial agreement of the overall volume occupied by a dissection. From the bundle, any voxels traversed by at least one streamline are set to 1, resulting in a binarized volume of the bundle (mask). This is then compared to the binarized volume of another data set. The number of streamlines does not influence the results outside the volume they occupy. This metric is highly sensitive to outliers because outliers quickly increase the nonoverlapping volume.
2.3.2. Dice score of streamlines
Quantify the agreement of the exact selection of streamlines. Since compared data sets were matched across raters, streamlines can be compared directly. The value for this metric lies between 0 and 1 and represents the ratio of streamlines that are identical in both data sets to the total number of streamlines in both data sets. A perfect score is much harder to achieve since this metric is inherently linked to streamline count while Dice score of voxels is not.
2.3.3. Correlation of density maps
Measure the coherence between density maps. A large overlap between bundles' cores is more important than the sparse overlap of rare spurious streamline and/or outlier. The goal of this metric is to assess whether the distribution of streamlines in space is similar. This allows bundles with different streamline counts to reach high scores if their density maps are correlated.
Since no single rater can be said to have the right dissection, we rely on a group average (majority vote) to establish our gold standard. In the first Tractostorm project, only the experts' group was used to generate the gold standard and establish that nonexperts were closely similar to the gold standard (both groups delineated bundles that were very similar on average). These results demonstrated that expertise in neuroanatomy is not required to follow our segmentation protocol and achieve a gold standard that is anatomically meaningful (see Figure 2). Similar to Rheault, De Benedictis, et al. (2020), metrics that include true negatives in their computation were excluded as they tend to converge toward a perfect score because true positives are overrepresented by an order of magnitude or two. A typical volume (or tractogram) contains millions of voxels (or millions of streamlines), and the typical dissection contains only thousands of voxels (or thousands of streamlines). The chosen binary classification metrics are kappa, precision, and sensitivity for both the voxels and the streamline representations.
FIGURE 2.
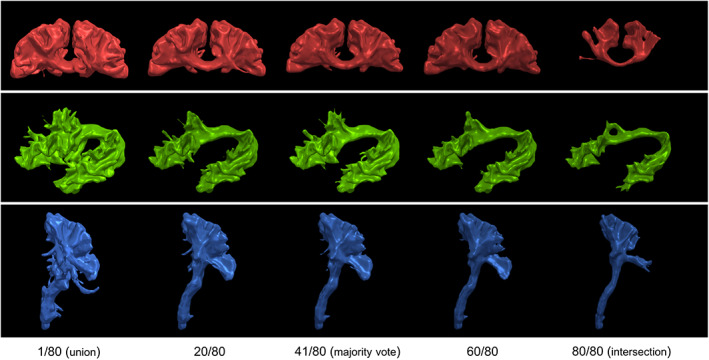
Example of gold‐standard generation obtained by using a voting approach. Each row shows the bundles of interest and represents a smooth isosurface at the selected threshold. From left to right, multiple voting ratios from 0.0125 (union) to 0.5125 (majority vote) to 1.0 (intersection) from 80 segmentations of the first subject. At each increase in the voting threshold, the number of voxels decreases. A minimal vote set at 1 out of 80 (1/80 or 0.0125; left) is equivalent to a union of all segmentations while a vote set at 80 out of 80 (right) is equivalent to an intersection between all segmentations. Both of these thresholds are prone to variations due to outliers in the submitted data. Thresholds at 25, 50, and 75% generate similar group averages due to the raters' high spatial consistency, a majority‐vote approach was selected for its intuitiveness and coherence with the first Tractostorm project
Statistical differences between HCP subjects or between bundles were tested using a Mann–Whitney rank test with a significance threshold of 0.01. Longitudinal trends were tested using a linear mixed model, using bundles as different groups and accounting for random effects from raters, where the null hypothesis is that the slope is zero (significance threshold of 0.01).
3. RESULTS
3.1. Qualitative
During the data‐gathering phase of the project, despite the protocol requiring a strict filename convention, various naming errors demonstrated that following instructions, even simple ones, is prone to errors. However, these kinds of errors were easy, but time‐consuming, to correct manually.
Upon reception of the data, each bundle was visually inspected (and naming convention verified). From prior experience, the PYTs seem to have been more consistently segmented than in the previous study (shown in the last row of Figure 3). Extreme variations were less common, and major outliers were rarer in the PYT than in the initial Tractostorm project.
FIGURE 3.
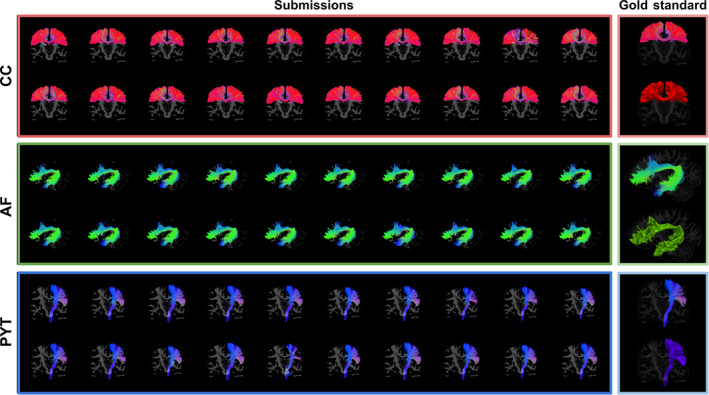
Mosaic of dissections of the first timepoint of the first HCP subject from 20 raters (left), all dissections look extremely similar. On the right, the average dissection (gold standard) in both the streamlines and the voxel representations. The coloring is based on the orientation of each streamline, where the X/Y/Z differences are mapped to R/G/B. To be considered part of the gold standard, elements had to be labeled in at least 50% of dissection associated with each subject. The PYT had a more consistent spatial coverage compared to the first Tractostorm project (only bundle in common). AF, Arculate fasciculus; CC, corpus callosum; HCP, Human Connectome Project; PYT, pyramidal tract
The vast majority of submissions were close to what was expected from anatomical knowledge. The general shape and position matched with the known anatomy the protocol attempted to dissect. As seen in Figure 3, no major misinterpretation or obviously mistaken dissection was found. Despite the noisy nature of probabilistic tractography and the admittedly difficult task of interpreting and executing the tasks, the submitted data appeared consistent and rarely contained spurious streamlines.
3.2. Quantitative
3.2.1. Scalar measurements
When performing the tasks on the exact same data, consistent measures are expected, but as shown in Figure 4, the resulting dissections cover a wide range of scalar measures. While some measures are consistent, that is, average fractional anisotropy (FA) or average length, others are much more variable, that is, streamline count and volume. Scalar measurements are disconnected from the spatial agreement, which is why one measure can be extremely stable (e.g., average FA) and another extremely variable (e.g., volume). Since some of the reported measures do not follow a Gaussian distribution, values are reported as (median ± interquartile range) for simplicity. The average FA is stable across bundles (0.45 ± 0.01), despite having a commissural, an association, and a projection pathway with variable volume (ranging from 40,000 mm3 to more than 125,000 mm3). This simply shows that drastically different bundles with variable size, shape, and location all lead to the same average FA (with little to no deviation).
FIGURE 4.
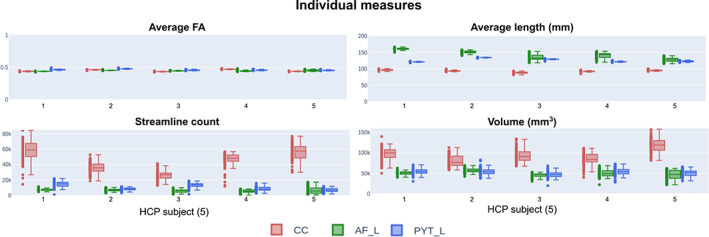
Individual measures for each HCP subject (1–5). Each dot represents one submitted bundle, and each box plot represents 80 files (20 raters × 4 timepoints = 80). This shows the impacts of dissection variability on observed measures. These are measures that are often reported in the literature but do not directly quantify spatial agreement (different volumes can lead to the same average FA). AF, Arculate fasciculus; CC, corpus callosum; FA, fractional anisotropy; HCP, Human Connectome Project; PYT, pyramidal tract
Some relationships between bundles are observable across HCP data sets (true at most/all of 20 timepoints). For example, the average length of the AF is systematically higher (143.45 ± 13.09) than both the CC (93.24 ± 3.43) and the PYT (126.00 ± 5.25) or the volume of the CC (94,827 ± 20,213 mm3) is higher and more variable than both the AF (50,101 ± 8,403 mm3) and PYT (52,282 ± 8,232 mm3).
3.2.2. Intrarater agreement
In Figure 5, the intrarater reproducibility scores show a high level of consistency for voxel‐based metrics (correlation of density maps and Dice score of voxels). The AF obtained lower scores on average for metrics that take into account streamlines (correlation of density maps and Dice score of streamlines), which indicates that the overall spatial agreement is good, but the streamlines themselves were not spatially distributed similarly.
FIGURE 5.
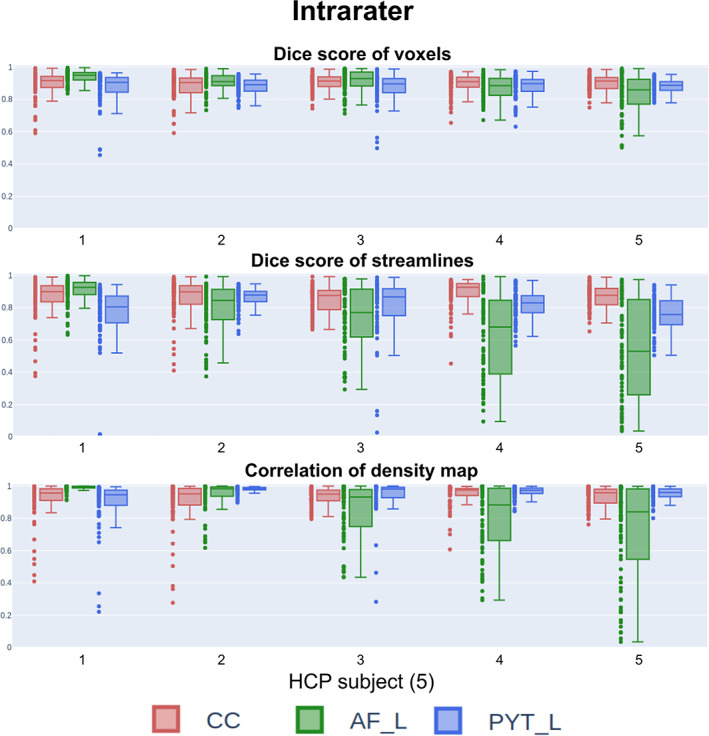
Reproducibility scores for intrarater agreements for all subjects. There is no longitudinal/temporal component to this figure, and all timepoints (per HCP subject) are needed to compute the intrarater scores. As expected, the voxel representation (Dice score) shows high reproducibility across bundles and HCP subjects. Only one bundle (AF) was highly impacted by anatomical differences (across subjects) for the streamline representation. AF, Arculate fasciculus; CC, corpus callosum; HCP, Human Connectome Project; PYT, pyramidal tract
On average, Dice scores of voxels achieve very close results for all bundles (CC 0.89 ± 0.06, AF 0.89 ± 0.08, and PYT 0.88 ± 0.07). However, as seen in Figure 5, these scores vary from subject to subject. This is particularly apparent for the streamline‐based metrics. When each rater was analyzed individually, it can be observed that reproducibility is not equal across all raters. However, no single rater systematically scored very high/low reproducibility.
3.2.3. Longitudinal interrater agreement
No statistically significant longitudinal difference in interrater reproducibility is observable when data are analyzed longitudinally (in the chronological order of dissection, for each HCP subject). As shown in Figure 6, no relationship between timepoints and any metrics can be distinguished.
FIGURE 6.
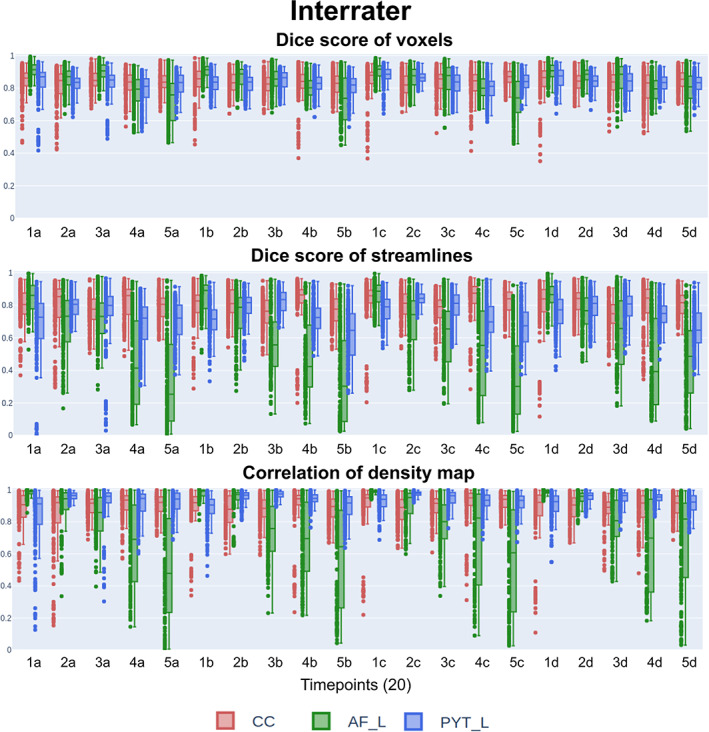
Reproducibility scores (interrater) for all timepoints showing agreement at the group level. The x‐axis represents first‐to‐last subject (1–5) and first‐to‐last repetition (a–d). No discernable temporal pattern can be observed, and interrater agreement remains stable as the amount of “practice” increases. Similar to the intrarater agreement, the AF reproducibility scores (streamline representation) seem to be more difficult to segment consistently at the group level depending on the HCP subject. AF, Arculate fasciculus; CC, corpus callosum; HCP, Human Connectome Project; PYT, pyramidal tract
No single rater was responsible for systematically different dissections. Submissions that are completely inconsistent with the group are rare. This leads to only a few reproducibility scores being much lower, which contributes to increasing the interquartile range. Voxel‐based representation produces higher and more stable reproducibility scores.
Reproducibility scores do not vary across bundles for voxel‐based metric (Dice score of voxels: CC 0.83 ± 0.08, AF 0.84 ± 0.10, and PYT 0.83 ± 0.07). The metrics that take streamline density into account do vary across bundles and across subjects. For example, the AF at timepoints associated with the first HCP subject achieve very high interrater scores for all metrics (e.g., a correlation of density maps of 0.97 ± 0.02). However, the timepoints associated with the last HCP subject are much lower and more variable across all metrics (e.g., a correlation of density maps of 0.64 ± 0.31). This is a similar observation to the patterns across bundles/subjects seen in the intrarater section.
3.2.4. Binary classification
To evaluate binary classification metrics, the dissection of each rater was compared to the group average (gold standard; Figure 7). Binary classification metrics show that the group of raters generally obtained high levels of spatial agreement. The stability of all binary classification metrics across timepoints indicates an absence of a relationship between protocol learning/practice and dissection agreement on the group level. No statistically significant longitudinal difference is observable (linear mixed model).
FIGURE 7.
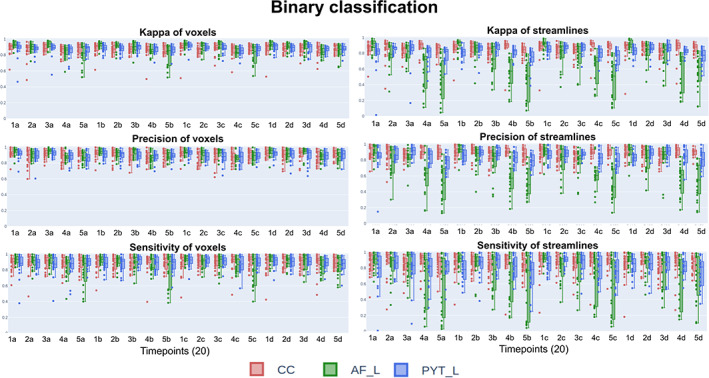
Reproducibility scores (gold standard) for all timepoints showing agreement with the group average. This shows that despite variation at the group level, on average, everyone segmented approximately the same bundle. This means that two raters can get variations of the same bundle and possibly be close to each other, but on average, a few raters performing the same task will always converge toward an average dissection. AF, Arculate fasciculus; CC, corpus callosum; PYT, pyramidal tract
The balance of high precision (how many selected elements are relevant) around 0.90 ± 0.07 for the voxel representation and high sensitivity (how many relevant elements are selected) around 0.89 ± 0.10 for the voxel representation indicates a very high spatial agreement at the group levels. As expected, the streamline representation produces lower scores on average than the voxel representation. Despite being lower and more variable, precision of streamlines (CC: 0.89 ± 0.08, AF: 0.72 ± 0.22, and PYT: 0.85 ± 0.09) and sensitivity of streamlines (CC: 0.85 ± 0.14, AF: 0.75 ± 0.27, and PYT: 0.81 ± 0.16) are well‐balanced. The pattern of lower scores for the AF associated with the first HCP subject to the last HCP subject is still observable.
4. DISCUSSION
Each execution of the protocol by the raters is slightly different, but there is no trend over the longitudinal component of our experiment. The stability of reproducibility scores over time (for each subject, across timepoints) shows that interpretation and execution did not change at the group level. The effect of practice had no observable importance in the process of virtual dissection. This is a reassuring result, once raters are introduced to the software and tasks at hand, their interpretation and execution (as a group) do not significantly vary (positively or negatively).
Results from the three bundles of interests show that reproducibility varies across pathways. This is in line with previous works (Boukadi et al., 2019; Cousineau et al., 2017; Wakana et al., 2007). It is unknown whether the dissection rules and landmarks are inherently harder to define or if some bundles are simply more prone to spurious streamlines and outliers (e.g., more ROIs needed to be defined, and therefore the small variations or “mistakes” add up). Future work involving a formal analysis of ROIs (saved by raters as part of this protocol) will aim to disentangle this question and to provide insight into good practice for future protocols development and/or inform anatomical definition at large. We believe such an investigation deserves its own line of analysis.
An interesting pattern is observable for the AF: The best and worst intrarater and interrater reproducibility scores were obtained in the first and the last HCP subject, respectively. Preliminary investigation shows more variability with some ROIs associated with the AF may be the cause. This indicates that anatomical differences can have an impact on the identification of landmarks and drastically influence the reproducibility/quality of dissection. Identifying the exact source of this unintuitive variability is crucial to improving the current protocol. It could be due to an ROI being misplaced and thousands of streamlines that generally overlap with the whole bundle to be discarded. This would affect the density map and the correlation metrics without a major impact on the overall volume of the bundle.
Raters' reproducibility scores were well distributed, but some outperformed others. Furthermore, some raters had closer similarities to the group average (which is considered anatomically meaningful). This could indicate there is such a thing as “good rater” and “bad rater”. Not only is a good rater expected to have a high intrarater reproducibility score, but they are expected to have a high agreement with the group average. This is referred to as master tracers/raters in European Alzheimer's Disease Consortium ‐ Alzheimer's Disease Neuroimaging Initiative hippocampus project (Frisoni et al., 2015).
4.1. Generalization of protocols reproducibility
The results from multiple bundles, as well as a modified teaching approach, confirmed the hypothesis from the first Tractostorm study that reproducibility scores cannot be easily generalized. Each protocol modification has the potential to drastically affect reproducibility. As hypothesized in Rheault, De Benedictis, et al. (2020), we confirmed that different bundles have different reproducibility scores. This confirms that any modification (e.g., teaching method, software) or addition (e.g., new ROIs, new bundles) to the protocol will likely change the reproducibility scores and thus generalization is likely impossible.
The major differences of streamline representation metrics (e.g., Dice score of streamlines) between HCP subjects for the AF indicate that some anatomical structures are harder to define/find and can have a bundle‐specific impact on reproducibility. This could be amplified when dealing with data sets with a wide range of ages or pathology. This further supports that generalization is extremely difficult and reproducibility should be studied independently for each bundle.
Modifications to protocols should trigger a reproducibility evaluation, and it should be targeted for a somewhat specific range of audiences, data sets, and populations. For example, this work was mainly designed for raters without neuroanatomy background on young/healthy subjects from the HCP database. However, a silver lining is that some flexibility is possible when targeting the scope of a protocol. Rheault, De Benedictis, et al. (2020) demonstrated that the experts and nonexperts group distinction (with and without formal anatomy background) had a minimal effect for spatial agreement in voxel representation (Dice score of voxels). Furthermore, TractEM (Bayrak et al., 2019) showed that acquisition quality (angular/spatial resolution) did not have a major influence on the agreement (both Dice score of voxels and correlation of density map). Finally, this work showed that by leveling the familiarity with the software and the protocol with an online educational session, virtual dissection tasks can reach a very high spatial agreement for every rater and remain stable. This is reassuring for those aiming for standardized WM pathway dissection protocols or for automatic dissection methods that rely on curated bundles obtained from such protocols.
4.2. Future projects aiming to define WM pathways
Widely different protocols are preventing the comparison across publications in the literature and limit the potential for meta‐analysis. Standardized anatomical definitions are clearly needed. Both theoretical (with no regard for acquisition, local modeling and tractography reconstruction), and practical definitions are needed. The data generated by this work will be made available online (https://doi.org/10.5281/zenodo.5190145) in March 2022.
Theoretical definitions must refer to conceptual landmarks and regions and convey the general shape, orientation, and terminations. They must aim to be distinct enough between bundles while encompassing a variety of practical definitions. Such definitions should refer to anatomical structures of the brain and not be tied to specific contrasts or processing. Work such as Catani & De Schotten, 2008 and Mandonnet et al., 2018 can be considered in this category. These WM atlases explain the reasoning behind the subdivisions (function, topology, connectivity, etc.) and have a broad presentation of WM pathways' location, shape, and regions they are expected to connect.
Practical definitions must refer to a specific execution of a theoretical definition. They can change according to the target audience (e.g., experts vs. nonexperts), time requirements (e.g., quick approximation vs. careful delineation), visualization software (e.g., MI‐Brain vs. TrackVis), or underlying processing (e.g., diffusion tensor imaging vs. high angular resolution diffusion imaging, deterministic vs. probabilistic). This also applies to automatic dissection methods. Work such as David et al. (2019) or Catani et al. (2013) describes a single WM pathway and their cortical terminations, shape, and surrounding anatomical landmarks. These descriptions are not explicit enough for replicable results, and some of the steps are inherently linked to processing choices. However, they can be considered an attempt at a practical definition even if details are missing. For instance, TractEM (Bayrak et al., 2019) provides detailed guidelines for whole‐brain tractogram dissections into bundles with processing/software instructions; this qualifies as a practical definition.
Even slight modifications to manual (e.g., number of ROIs, software update, description of landmarks) or automatic methods (e.g., loss functions, atlases, clustering methods) can have unforeseen impacts on reproducibility (bundle‐specific influences, algorithms that break down due to support variations in processing, etc.). This is why standardization is important, and such a resource‐intensive investigation (e.g., the current work) repeated frequently for minor variations would be a waste.
A subsequent project is already planned, and it aims to investigate the ROIs submitted by our rater to inform future practical definitions. The variability of ROIs across raters and the influence of shape and distance will provide insight into future protocol iterations. The general aim is to help to design future protocols that can vary in robustness, time restrictions, or complexity.
4.3. The impact of the online educational session
Observations and data from both iterations of the Tractostorm studies show the importance of accounting for external variables (experience with the software, anatomical knowledge, and familiarity with the task to be performed). The current project indicates that even one, relatively short, online educational session can have a major impact on the quality of results of a multi‐institutions collaboration on virtual dissection. In our current work, the online educational session encompassed an introduction to the project, a software tutorial, a demonstration of the protocol, and question and answer session.
Including a 2‐hr online educational session with a simple written document increased the average Dice score of voxels (for the PYT) from 0.65 to 0.85 with an interquartile range decreased from 0.15 to 0.08. It is unknown if this is due to better identification of landmarks or general familiarity with the tasks and/or the software. We cannot identify the exact component of the online educational session that helped the most, and only that the online educational session as a whole contributed to the improved reproducibility.
This could change/inform how we teach tractography and virtual dissection for clinical purposes as well as in research. This work also could provide insight into ways to convey information about shapes and landmarks of WM pathways when described in anatomy textbooks, for example. For an anatomical definition to be useful, it has to be anatomically valid and easy enough to communicate to others so most interpretations are anatomically valid as well.
4.3.1. Postexperiment survey of raters
A survey conducted with our collaborators helped us to understand how they perceived the experience and to give us insight into how the experiments were conducted. While the answers provide only personal opinions, they are a source of information on the perceived workload, difficulty, and general impression of the project.
Overall, the project was appreciated by our collaborators despite its heavy workload. During the planning phase, it was estimated (to plan workload) that each bundle dissection would take 5–10 min (15–30 min per data set, 5–10 hr in total). As seen in Figure 8, these values were underestimated, and from the feedback we received, this is likely because the first subject or two took much longer and the 15 min per data set was achieved only toward the end for most raters. Instructions' complexity was seen as “simple” while the software complexity was perceived as greater than the instructions. This reinforces the intuition that software could be a major source of variability.
FIGURE 8.
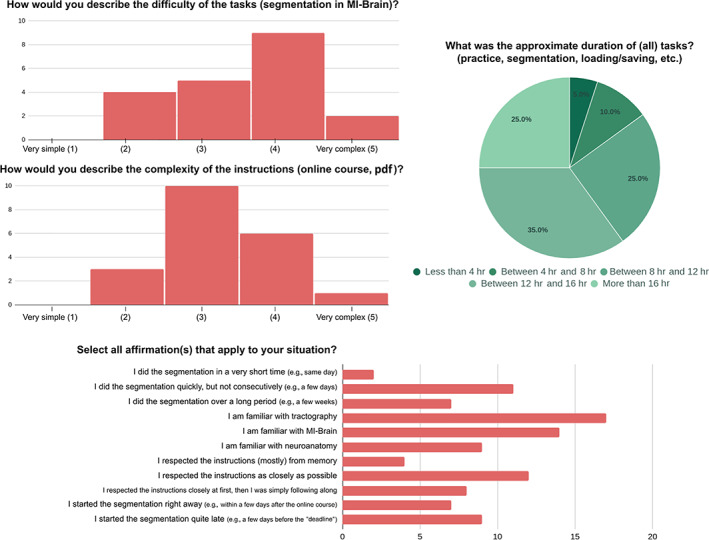
Results from the survey that portray a general picture of our group of raters and how they experienced/conducted the tasks. The affirmations (bottom) are not quantitative and rely on a personal assessment only (e.g., “I am familiar”, “I respected”). Twenty collaborators responded to the survey
The timeline of execution could also be an important variable to investigate. After the course and on their own time, raters were allowed to decide when to execute the tasks and how many data sets to do each time. This freedom was also allowed in the first Tractostorm project and mainly due to the difficulty to supervise or control the schedule of 20 researchers spread across North America and Europe. The allowed window for raters to submit their segmentation data was open for 2 months after the online course. The vast majority of raters submitted their delineation between Week 4 and Week 8 with two exceptions. One rater finished the tasks within 1 week of the online course, and another finished the tasks 2 weeks after the allowed window (authorized by the principal investigator due to personal circumstances).
5. CONCLUSION
In this work, we quantified the effect of practicing and learning a protocol for WM pathway dissection. Using matched data and a large group of raters, we quantified their individual agreement (intrarater) as well as their group agreement (interrater). We demonstrated that as raters practice, their interpretation and execution remain stable. Despite the global nature of WM pathways, high spatial/voxel reproducibility can be achieved. However, we observe that modifying the teaching method has a large effect. The online educational session on the software and protocol had a major positive impact (30% higher median and 50% lower interquartile range) on the reproducibility of the PYTs (only bundle in common across both studies).
It is important to note that variations between both Tractostorm projects indicate that bundle dissection, even if designed with a similar template and the same level of detail, cannot be easily generalized, and so, careful evaluation must be systematically performed. This evaluation of the impact of a teaching method on the protocol results is an essential step to improve the future design of WM dissection protocols.
Supporting information
Appendix S1: Supporting Information
ACKNOWLEDGMENT
This work was supported by the National Institutes of Health (NIH) under award numbers R01EB017230, P50HD103537, and T32EB001628, and in part by ViSE/VICTR VR3029 and the National Center for Research Resources, Grant UL1 RR024975‐01.
Each collaborator's contribution to the project was made possible by various sources of funding:
Leon Cai was supported by NIH/NIGMS, grant number 5T32GM007347.
Viljami Sairanen was supported the Orion Research Foundation sr, the Instrumentarium Science Foundation sr., and the Emil Aaltonen Foundation.
Pietro Bontempi was supported by Verona Brain Research Foundation (high‐field MRI for the study of peripheral nerve microstructure).
Guido Guberman was supported by the Vanier Canada Graduate Scholarship.
Maggie Roy was supported by The Mathematics of Information Technology and Complex Systems (MITACS).
Charles Poirier, Gabrielle Grenier, and Philippe Karan were supported by the scholarship from Natural Sciences and Engineering Research Council (NSERC) and Fonds de Recherche du Québec Nature and Technologies (FRQNT).
We thank the Universite de Sherbrooke institutional research chair in Neuroinformatics that supports Maxime Descoteaux and his team.
Sami Obaid was supported by the Savoy Foundation studentship and from scholarships from the Fonds de Recherche du Québec ‐ Santé (277581).
Rheault, F. , Schilling, K. G. , Valcourt‐Caron, A. , Théberge, A. , Poirier, C. , Grenier, G. , Guberman, G. I. , Begnoche, J. , Legarreta, J. H. , Y. Cai, L. , Roy, M. , Edde, M. , Caceres, M. P. , Ocampo‐Pineda, M. , Al‐Sharif, N. , Karan, P. , Bontempi, P. , Obaid, S. , Bosticardo, S. , … Landman, B. A. (2022). Tractostorm 2: Optimizing tractography dissection reproducibility with segmentation protocol dissemination. Human Brain Mapping, 43(7), 2134–2147. 10.1002/hbm.25777
Funding information National Center for Research Resources, Grant/Award Number: UL1 RR024975‐01; National Institute of Child Health and Human Development, Grant/Award Number: P50HD103537; American NATIONAL INSTITUTE Of HEALTH, Grant/Award Numbers: R01EB017230, T32EB001628; ViSE/VICTR, Grant/Award Number: VR3029; Fonds de Recherche du Québec ‐ Santé; Savoy Foundation; Emil Aaltonen Foundation; Brain Research Foundation; NIH, Grant/Award Number: 5T32GM007347
DATA AVAILABILITY STATEMENT
The data provided to the raters are openly available on Zenodo at https://zenodo.org/record/5190145#.YY7qRnVKhH5 in 2022. The provided data are from the Human Connectome Project (HCP) The data that support our results (tracers annotations) will be available at the same link in 2022.
REFERENCES
- Bayrak, R.G. , Schilling, K.G. , Greer, J.M. , Hansen, C.B. , Greer, C.M. , Blaber, J.A. , … Landman, B.A. (2019). TractEM: Fast protocols for whole brain deterministic tractography‐based white matter atlas. bioRxiv, 651935.
- Benedictis, A. , Petit, L. , Descoteaux, M. , Marras, C. E. , Barbareschi, M. , Corsini, F. , … Sarubbo, S. (2016). New insights in the homotopic and heterotopic connectivity of the frontal portion of the human corpus callosum revealed by microdissection and diffusion tractography. Human Brain Mapping, 37, 4718–4735. [DOI] [PMC free article] [PubMed] [Google Scholar]
- Boccardi, M. , Ganzola, R. , Bocchetta, M. , Pievani, M. , Redolfi, A. , Bartzokis, G. , … Frisoni, G. B. (2011). Survey of protocols for the manual segmentation of the hippocampus: Preparatory steps towards a joint EADC‐ADNI harmonized protocol. Journal of Alzheimer's Disease, 26, 61–75. [DOI] [PMC free article] [PubMed] [Google Scholar]
- Boukadi, M. , Marcotte, K. , Bedetti, C. , Houde, J.‐C. , Desautels, A. , Deslauriers‐Gauthier, S. , … Brambati, S. M. (2019). Test‐retest reliability of diffusion measures extracted along white matter language fiber bundles using HARDI‐based tractography. Frontiers in Neuroscience, 12, 1055. [DOI] [PMC free article] [PubMed] [Google Scholar]
- Catani, M. , Allin, M. P. , Husain, M. , Pugliese, L. , Mesulam, M. M. , Murray, R. M. , & Jones, D. K. (2007). Symmetries in human brain language pathways correlate with verbal recall. Proceedings of the National Academy of Sciences, 104, 17163–17168. [DOI] [PMC free article] [PubMed] [Google Scholar]
- Catani, M. , & De Schotten, M. T. (2008). A diffusion tensor imaging tractography atlas for virtual in vivo dissections. Cortex, 44, 1105–1132. [DOI] [PubMed] [Google Scholar]
- Catani, M. , Howard, R. J. , Pajevic, S. , & Jones, D. K. (2002). Virtual in vivo interactive dissection of white matter fasciculi in the human brain. NeuroImage, 17, 77–94. [DOI] [PubMed] [Google Scholar]
- Catani, M. , Mesulam, M. M. , Jakobsen, E. , Malik, F. , Martersteck, A. , Wieneke, C. , … Rogalski, E. (2013). A novel frontal pathway underlies verbal fluency in primary progressive aphasia. Brain, 136, 2619–2628. [DOI] [PMC free article] [PubMed] [Google Scholar]
- Chenot, Q. , Tzourio‐Mazoyer, N. , Rheault, F. , Descoteaux, M. , Crivello, F. , Zago, L. , … Petit, L. (2019). A population‐based atlas of the human pyramidal tract in 410 healthy participants. Brain Structure and Function, 224, 599–612. [DOI] [PubMed] [Google Scholar]
- Cousineau, M. , Jodoin, P.‐M. , Garyfallidis, E. , Côté, M.‐A. , Morency, F. C. , Rozanski, V. , … Descoteaux, M. (2017). A test‐retest study on Parkinson's PPMI dataset yields statistically significant white matter fascicles. NeuroImage: Clinical, 16, 222–233. [DOI] [PMC free article] [PubMed] [Google Scholar]
- David, S. , Heemskerk, A. M. , Corrivetti, F. , Thiebaut De Schotten, M. , Sarubbo, S. , Corsini, F. , … Leemans, A. (2019). The superoanterior fasciculus (SAF): A novel white matter pathway in the human brain? Frontiers in Neuroanatomy, 13, 24. [DOI] [PMC free article] [PubMed] [Google Scholar]
- Fennema‐Notestine, C. , Hagler, D. J., Jr. , McEvoy, L. K. , Fleisher, A. S. , Wu, E. H. , Karow, D. S. , & Dale, A. M. (2009). Structural MRI biomarkers for preclinical and mild Alzheimer's disease. Human Brain Mapping, 30, 3238–3253. [DOI] [PMC free article] [PubMed] [Google Scholar]
- Forkel, S. J. , de Schotten, M. T. , Kawadler, J. M. , Dell'Acqua, F. , Danek, A. , & Catani, M. (2014). The anatomy of fronto‐occipital connections from early blunt dissections to contemporary tractography. Cortex, 56, 73–84. [DOI] [PubMed] [Google Scholar]
- Frisoni, G. B. , Jack, C. R., Jr. , Bocchetta, M. , Bauer, C. , Frederiksen, K. S. , Liu, Y. , … EADC‐ADNI Working Group . (2015). The EADC‐ADNI harmonized protocol for manual hippocampal segmentation on magnetic resonance: Evidence of validity. Alzheimer's & Dementia, 11, 111–125. [DOI] [PMC free article] [PubMed] [Google Scholar]
- Gasperini, C. , Rovaris, M. , Sormani, M. , Bastianello, S. , Pozzilli, C. , Comi, G. , & Filippi, M. (2001). Intra‐observer, inter‐observer and inter‐scanner variations in brain MRI volume measurements in multiple sclerosis. Multiple Sclerosis Journal, 7, 27–31. [DOI] [PubMed] [Google Scholar]
- Geschwind, N. (1970). The organization of language and the brain. Science, 170, 940–944. [DOI] [PubMed] [Google Scholar]
- Girard, G. , Whittingstall, K. , Deriche, R. , & Descoteaux, M. (2014). Towards quantitative connectivity analysis: Reducing tractography biases. NeuroImage, 98, 266–278. [DOI] [PubMed] [Google Scholar]
- Glasser, M. F. , Sotiropoulos, S. N. , Wilson, J. A. , Coalson, T. S. , Fischl, B. , Andersson, J. L. , … WU‐Minn HCP Consortium . (2013). The minimal preprocessing pipelines for the human connectome project. NeuroImage, 80, 105–124. [DOI] [PMC free article] [PubMed] [Google Scholar]
- Griffa, A. , Baumann, P. S. , Thiran, J.‐P. , & Hagmann, P. (2013). Structural connectomics in brain diseases. NeuroImage, 80, 515–526. [DOI] [PubMed] [Google Scholar]
- Hagmann, P. , Cammoun, L. , Gigandet, X. , Meuli, R. , Honey, C. J. , Wedeen, V. J. , & Sporns, O. (2008). Mapping the structural core of human cerebral cortex. PLoS Biology, 6, e159. [DOI] [PMC free article] [PubMed] [Google Scholar]
- Jones, D. , Simmons, A. , Williams, S. , & Horsfield, M. (1998). Non‐invasive assessment of structural connectivity in white matter by diffusion tensor MRI. Sixth annual meeting of the International Society for Magnetic Resonance in Medicine. Berkeley, CA: International Society for Magnetic Resonance in Medicine, p. 531. [Google Scholar]
- Maier‐Hein, K. H. , Neher, P. F. , Houde, J.‐C. , Côté, M.‐A. , Garyfallidis, E. , Zhong, J. , … Descoteaux, M. (2017). The challenge of mapping the human connectome based on diffusion tractography. Nature Communications, 8, 1349. [DOI] [PMC free article] [PubMed] [Google Scholar]
- Mandonnet, E. , Sarubbo, S. , & Petit, L. (2018). The nomenclature of human white matter association pathways: Proposal for a systematic taxonomic anatomical classification. Frontiers in Neuroanatomy, 12, 94. [DOI] [PMC free article] [PubMed] [Google Scholar]
- Meola, A. , Comert, A. , Yeh, F.‐C. , Stefaneanu, L. , & Fernandez‐Miranda, J. C. (2015). The controversial existence of the human superior fronto‐occipital fasciculus: Connectome‐based tractographic study with microdissection validation. Human Brain Mapping, 36, 4964–4971. [DOI] [PMC free article] [PubMed] [Google Scholar]
- Mori, S. , & van Zijl, P. (2002). Fiber tracking: Principles and strategies–a technical review. NMR in Biomedicine, 15, 468–480. [DOI] [PubMed] [Google Scholar]
- Nathan, P. , & Smith, M. C. (1955). Long descending tracts in man: I. Review of present knowledge. Brain, 78, 248–303. [DOI] [PubMed] [Google Scholar]
- Pagnozzi, A. M. , Conti, E. , Calderoni, S. , Fripp, J. , & Rose, S. E. (2018). A systematic review of structural MRI biomarkers in autism spectrum disorder: A machine learning perspective. International Journal of Developmental Neuroscience, 71, 68–82. [DOI] [PubMed] [Google Scholar]
- Panesar, S. , & Fernandez‐Miranda, J. (2019). Commentary: The nomenclature of human white matter association pathways: Proposal for a systematic taxonomic anatomical classification. Frontiers in Neuroanatomy, 13, 61. [DOI] [PMC free article] [PubMed] [Google Scholar]
- Rheault, F. , De Benedictis, A. , Daducci, A. , Maffei, C. , Tax, C. M. , Romascano, D. , … Descoteaux, M. (2020). Tractostorm: The what, why, and how of tractography dissection reproducibility. Human Brain Mapping, 41, 1859–1874. [DOI] [PMC free article] [PubMed] [Google Scholar]
- Rheault, F. , Houde, J.‐C. , Goyette, N. , Morency, F. , & Descoteaux, M. (2016). MI‐brain, a software to handle tractograms and perform interactive virtual dissection. ISMRM diffusion study group workshop. Lisbon, Portugal. [Google Scholar]
- Rheault, F. , Poulin, P. , Caron, A. V. , St‐Onge, E. , & Descoteaux, M. (2020). Common misconceptions, hidden biases and modern challenges of dMRI tractography. Journal of Neural Engineering, 17, 011001. [DOI] [PubMed] [Google Scholar]
- Rosario, B. L. , Weissfeld, L. A. , Laymon, C. M. , Mathis, C. A. , Klunk, W. E. , Berginc, M. D. , … Price, J. C. (2011). Inter‐rater reliability of manual and automated region‐of‐interest delineation for PiB PET. NeuroImage, 55, 933–941. [DOI] [PMC free article] [PubMed] [Google Scholar]
- Schilling, K.G. , Rheault, F. , Petit, L. , Hansen, C.B. , Nath, V. , Yeh, F.‐C. , … Descoteaux, M. (2020). Tractography dissection variability: What happens when 42 groups dissect 14 white matter bundles on the same dataset? bioRxiv. [DOI] [PMC free article] [PubMed]
- Sefcikova, V. , Sporrer, J. K. , Ekert, J. O. , Kirkman, M. A. , & Samandouras, G. (2020). High interrater variability in intraoperative language testing and interpretation in awake brain mapping among neurosurgeons or neuropsychologists: An emerging need for standardization. World Neurosurgery, 141, e651–e660. [DOI] [PubMed] [Google Scholar]
- Tournier, J.‐D. , Yeh, C.‐H. , Calamante, F. , Cho, K.‐H. , Connelly, A. , & Lin, C.‐P. (2008). Resolving crossing fibres using constrained spherical deconvolution: Validation using diffusion‐weighted imaging phantom data. NeuroImage, 42, 617–625. [DOI] [PubMed] [Google Scholar]
- Türe, U. , Yaşargil, M. G. , & Pait, T. G. (1997). Is there a superior occipitofrontal fasciculus? A microsurgical anatomic study. Neurosurgery, 40, 1226–1232. [DOI] [PubMed] [Google Scholar]
- Vavassori, L. , Sarubbo, S. , & Petit, L. (2021). Hodology of the superior longitudinal system of the human brain: A historical perspective, the current controversies, and a proposal. Brain Structure & Function, 226, 1363–1384. [DOI] [PubMed] [Google Scholar]
- Visser, M. , Müller, D. , van Duijn, R. , Smits, M. , Verburg, N. , Hendriks, E. , … de Munck, J. C. (2019). Inter‐rater agreement in glioma segmentations on longitudinal MRI. NeuroImage: Clinical, 22, 101727. [DOI] [PMC free article] [PubMed] [Google Scholar]
- Wakana, S. , Caprihan, A. , Panzenboeck, M. M. , Fallon, J. H. , Perry, M. , Gollub, R. L. , … Mori, S. (2007). Reproducibility of quantitative tractography methods applied to cerebral white matter. NeuroImage, 36, 630–644. [DOI] [PMC free article] [PubMed] [Google Scholar]
- Witelson, S. F. (1985). The brain connection: The corpus callosum is larger in left‐handers. Science, 229, 665–668. [DOI] [PubMed] [Google Scholar]
- Yeh, F.‐C. , Panesar, S. , Fernandes, D. , Meola, A. , Yoshino, M. , Fernandez‐Miranda, J. C. , … Verstynen, T. (2018). Population‐averaged atlas of the macroscale human structural connectome and its network topology. NeuroImage, 178, 57–68. [DOI] [PMC free article] [PubMed] [Google Scholar]
Associated Data
This section collects any data citations, data availability statements, or supplementary materials included in this article.
Supplementary Materials
Appendix S1: Supporting Information
Data Availability Statement
The data provided to the raters are openly available on Zenodo at https://zenodo.org/record/5190145#.YY7qRnVKhH5 in 2022. The provided data are from the Human Connectome Project (HCP) The data that support our results (tracers annotations) will be available at the same link in 2022.


