Abstract
When engineering a protein for its biological function, many physicochemical properties are also optimized throughout the engineering process, and the protein's solubility is among the most important properties to consider. Here, we report two novel computational methods to calculate the pH‐dependent protein solubility, and to rank the solubility of mutants. The first is an empirical method developed for fast ranking of the solubility of a large number of mutants of a protein. It takes into account electrostatic solvation energy term calculated using Generalized Born approximation, hydrophobic patches, protein charge, and charge asymmetry, as well as the changes of protein stability upon mutation. This method has been tested on over 100 mutations for 17 globular proteins, as well as on 44 variants of five different antibodies. The prediction rate is over 80%. The antibody tests showed a Pearson correlation coefficient, R, with experimental data from .83 to .91. The second method is based on a novel, completely force‐field‐based approach using CHARMm program modules to calculate the binding energy of the protein to a part of the crystal lattice, generated from X‐ray structure. The method predicted with very high accuracy the solubility of Ribonuclease SA and its 3K and 5K mutants as a function of pH without any parameter adjustments of the existing BIOVIA Discovery Studio binding affinity model. Our methods can be used for rapid screening of large numbers of design candidates based on solubility, and to guide the design of solution conditions for antibody formulation.
Keywords: aggregation propensity, antibody, molecular mechanics, mutations, protein electrostatics, protein ionization, protein solubility
1. INTRODUCTION
The optimization of protein formulation properties is critical for the success of the commercial development of protein biotherapeutics. It is well known that an antibody with poor formulation properties could lead to low expression in production, issues in purification, degradation and precipitation in storage, and difficulties in administration. It is very difficult and costly to address these problems in the later stages of the development, so optimizing and screening the antibody candidates at an early stage is critical to ensure the success of the project. However, due to the limited amount and the quality of the material available at early discovery phase, experiments made to measure the properties often use indirect methods leading to less reliable results. 1 , 2 Therefore, computational methods are useful to quickly screen the candidates in early‐stage and throughout the development process. They can also provide insights in understanding the problem at a molecular level to enable the rational design of biologics.
Protein aggregation, viscosity, and solubility are some of the important properties to optimize for protein formulation. Quite often, similar molecular traits to those which cause proteins to aggregate could also lower the protein solubility and likewise, molecular features increasing protein viscosity could lower protein solubility. Although they are distinctive biophysical properties, they may be correlated with each other as they depend on similar molecular features, such as hydrophobic molecular surface, net molecular charge, dipole moment, protein stability, partial unfolding, and so forth. In the past decade, in silico methods have been developed to predict protein aggregation propensity, 3 , 4 , 5 , 6 viscosity, 7 and solubility 8 , 9 , 10 , 13 based on those molecular features.
While some methods take into account of the protein three‐dimensional structures as well as their conformational heterogeneity using dynamics simulation, 3 , 4 , 5 , 6 , 10 others rely on just the sequence information. 8 , 9 , 11 The sequence‐based methods are fast and allow the screening of large number of sequence candidates in discovery phase, however, it is likely to miss some of the hydrophobic surface patches or electrostatic properties that are found to be important descriptors for protein aggregation, 3 , 4 , 5 , 6 viscosity, 7 and solubility. 12 , 13 Structure‐based methods can give more realistic prediction of those protein features and have the ability to calculate the molecular charge and dipole moment as functions of solution pH and ionic strength, and in theory will lead to more accurate prediction of the protein solubility.
BIOVIA Discovery Studio 14 has several automated protocols to calculate a number of physicochemical features related to the formulation properties of protein molecules. Here we discuss our structure‐based approaches to predict the solubility of globular proteins. A part of the study is focused on antibodies, a class of proteins widely used as biotherapeutics. Given that the antibody structures are highly conserved and the engineering process modifies mainly the variable domain (Fv domain) to select the best candidate, many researchers focus the prediction just on the Fv domain. This approach is valid when the local features are considered in the prediction, such as hydrophobic surface patches and charge patches; however, it will be misleading if total molecular charge or dipole are used as descriptors in the prediction. Fv and Fab domain structure prediction is straightforward given a large number of known antibody structures available in the public domain and the high conservation of the antibody structures, however, full‐length antibody structures are highly flexible around the hinge region leading to the relative position of the Fab and Fc domain being highly variable in solution. This flexibility imposes a challenge in predicting the solubility using molecular descriptors for antibodies. We will discuss our strategy for predicting antibody solubility in this article.
Predicting solubility by using surface and molecular descriptors captures nonspecific molecular interactions of the protein molecule in the condensed phase. In many cases, this approach is sufficient to get a good correlation between the antibody candidates being studied. Several data sets including different protein types as well as data sets focused just on antibodies are used in our training and validation for the first approach we take based on protein descriptors. However, in some cases, specific and strong molecular interactions form in crystal environments, and mutations disrupting strong interactions cannot be modeled by simple descriptors. Our second method demonstrates that considering molecular interactions at the atomic level using a molecular mechanics approach results in a better correlation of the prediction and experimentally measured solubility data. The antibody CNTO607 is used to demonstrate the second approach.
2. THEORY
The modeling of the complex physical mechanisms that govern the forming of crystalline particles or aggregated complexes is a real challenge. Protein solubility depends on the delicate balance of different types of interactions between the protein molecules in the condensed state, the interactions of the protein molecules with the solvent molecules, as well as on the properties of the solvent, such as temperature, pH, ion concentration, and the presence of excipients. In general, the intermolecular interactions that could affect protein solubility could be viewed as belonging to two different classes, electrostatic and non‐polar. The important role of the electrostatic, pH‐dependent interactions has been demonstrated in a number of experiments showing that solubility is minimal close to isoelectric point. 12 The widely accepted explanation of this is that the electrostatic repulsion between charged molecules of same sign becomes minimal at the isoelectric point where the protein net charge is zero. Based on this, as a first approximation, the pH dependence of protein solubility has been related to the net charge square, 12 (pH). However, in a recent study, Tjong and Zhou 10 have shown that the protein solubility of ribonuclease Sa (RNase Sa) and zinc insulin as a function of solution pH can be reproduced by the calculated differences of solvation energies, , when transferring the protein from the liquid to the condensed phase, the latter defined by a lower dielectric constant. Interestingly, the results in their study were obtained by a model that completely neglects the intermolecular electrostatic interactions. An explanation of this apparent paradox is the high correlation between (pH) and , shown in Figure S1, and both of them might be considered when analyzing protein properties affecting solubility.
Besides the increasing of electrostatic repulsion with the net molecular charge, the asymmetry in the distribution of negatively and positively charged acidic and basic amino acids in the protein could result in attractive forces between the protein molecules in both, the liquid and condensed (crystalline) phase. As a measure of the effect of the charge asymmetry, in their solubility scoring function, Long and Labute 13 considered the protein dipole moment, D, calculated as a function of pH.
Another important factor that could affect the protein solubility is the protein stability. For example, it has been shown 15 that mutations I56T and D67H of human lysozyme facilitates amyloid formation due to partial unfolding of molecule.
In recent years, we have developed and implemented a number of methods in BIOVIA Discovery Studio that can be used to calculate a variety of molecular descriptors to be used in the creation of solubility and viscosity models. They include calculations of the electrostatic properties such as molecular net charge, dipole moment, and electrostatic contribution to solvation energy, 16 and the effect of mutations on protein stability 17 and binding affinity, 18 all of them calculated as a function of pH and ionic strength.
In this study, we define the protein solubility, S, as the concentration, C sat (e.g., mol/L) of its saturated solution in equilibrium with the condensed (crystalline) phase. At equilibrium, the chemical potential in the condensed phase, , is equal to the chemical potential in solution .
According to this definition, the solubility is related to the difference, , between chemical potentials in the condensed phase, , and in solution, , at a standard concentration. 10 , 12 Taking into account that
| (1) |
the solubility can be written as.
| (2) |
The term can be viewed as the transfer energy of a protein molecule from the liquid to the solid phase. In our models, all terms forming the transfer energy are derived from molecular mechanics and proton equilibria calculations. The solubility values are reported as:
| (3) |
Note that according to the above definition, the more positive the transfer energy , the more soluble the protein.
In principle, a protein precipitates in a multistage process starting from forming oligomers of different sizes, for example, dimers, trimers, and so forth. However, at saturation, it can be assumed that the solid (condensed) phase consists of relatively large crystalline particles. Then, at equilibria, the transfer energy term, , can be regarded as the binding energy, of a protein molecule to the surface of the crystalline lattice as shown in Figure 1.
FIGURE 1.
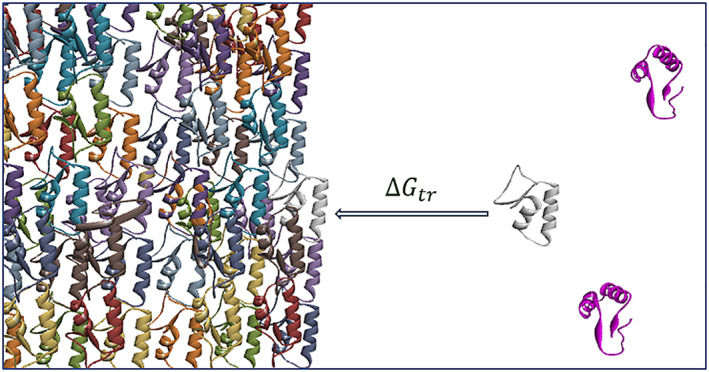
Protein binding to the crystalline lattice
In this study, we developed and tested two different solubility models, both of them based on combined CHARMm and protein ionization calculations.
BSM, binding affinity solubility model, is a new completely force‐field‐based model. In the BSM model, the protein solubility is evaluated from direct calculations of protein binding affinity to the crystal lattice. While the evaluation of the full lattice energy is unrealistic, 12 here for the first time we propose an approximation, where as a proxy of the crystal lattice, the atomic coordinates of a multimer constructed from a central protein molecule surrounded by its immediate crystal neighbors are used. The coordinates of the neighboring molecules are generated from the crystal structure by using the space group and cell parameters.
ESM model is a novel semi‐empirical model, developed for fast calculation of protein solubility as a function of pH. It has been developed recently, and implemented in BIOVIA Discovery Studio, 14 and tested on predicting the pH‐dependence of solubility, as well as on the effect of mutations. The method is validated on a large set of experimental data for a variety of proteins as well as on several antibody data sets.
2.1. BSM: Binding affinity model of protein solubility
The basic hypothesis behind the binding affinity model is to substitute the crystalline phase with a part of X‐ray crystal lattice, and to approximate with the binding energy of a protein molecule to the model crystalline particle.
| (4) |
A crystalline particle of RNase Sa 5K mutant (Table 1) is shown in Figure 2.
TABLE 1.
RNase Sa variants and their experimental and calculated isoelectric points
| Protein | Mutation | PDB ID | pIcalc | pI exp a |
|---|---|---|---|---|
| Wild‐type | 1RGG | 4.5 | 3.5 | |
| 3K mutant | D1K, D17K, E41K |
Modeled from: 3A5E 1RGG |
6.5 6.9 |
6.4 |
| 5K mutant | D1K, D17K, D25K, E41K, E74K | 3A5E | 9.8 | 10.2 |
Experimental pI values from Shaw et al. 27
FIGURE 2.
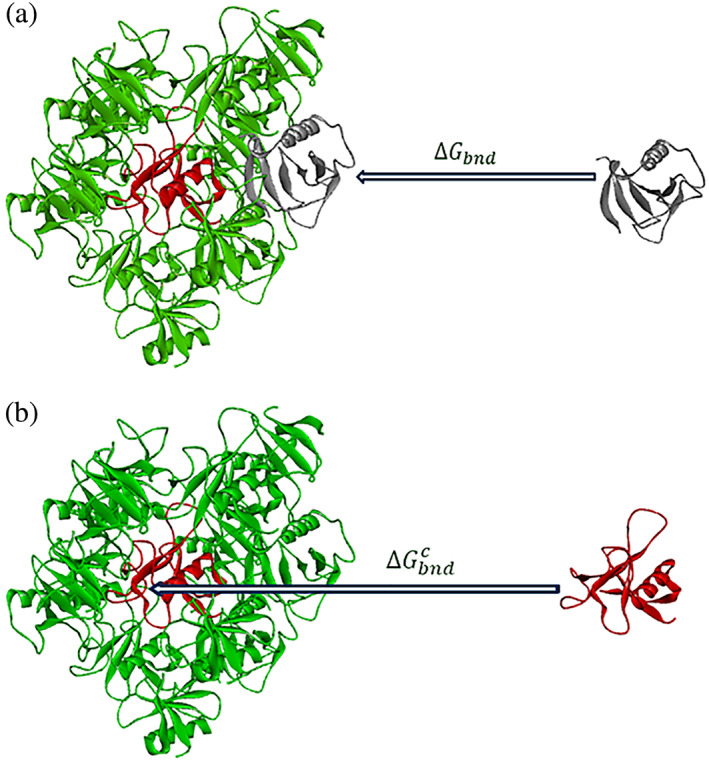
The binding of a protein molecule from the liquid to a model crystalline particle, generated from the structure of the 5K variant of RNase Sa (PDB ID: 3A5E). The central molecule is in red. (a) The binding energy of a surface molecule. (b) The binding energy of the central molecule
The model crystalline particles are composed of a central molecule (in red) surrounded by all crystal neighbors with at least one atom within 5 Å from the central molecule. The Generate Crystal Neighbors Discovery Studio protocol was used to generate the atomic coordinates of surrounding molecules.
In general, the physical formalism behind the model of binding a protein, P, to the crystalline particle, C, is the same as our previous model 18 on protein–protein binding as a function of pH.
In most known physics‐based models, such as MM/FDPB 19 and LIE, 20 the binding free energy terms necessary to calculate ΔG bnd are evaluated using three separate calculations:
| (5) |
where the energy terms for the unbound partners A and B are calculated separately because of limited dimension of the FDPB grid or the water box used in explicit solvent simulation methods. Taking advantage of the pairwise Generalized Born approximation in CHARMM 21 GBIM method 22 from our previous work on protein–protein binding affinity, 18 we used a computationally more effective scheme, where the calculations were reduced to two sets.
| (6) |
where the unbound state A⋯B was modeled by separating the binding partners by a distance that is larger than the maximum of cutoff distances used in the calculations of interaction terms, for example, 200 Å. The same scheme is used in this work.
The evaluation of the energy terms is challenging. The most common issues are related to the treatment of the protein flexibility and the interactions with the solvent. The proteins are flexible molecules that exchange protons with water and interact with ions and other additives in the solvent. In principle, the free energy of bound and unbound states can be derived from the partition sums of all corresponding microstates. Since any site of titration can be protonated or unprotonated, the number of all possible protonation states of a protein in a given conformation, , increases very rapidly with the number of acidic and basic residues Ns. Additionally, the number of possible conformations in bound and unbound states is huge. As a result, the combinatorial problem makes direct calculations unrealistic. The various methods use different levels of approximation to account for protein flexibility and most of the in silico methods neglect the pH‐dependency of the protein ionization and model the molecule as a system with constant atomic partial charges. In this study, we use the same method as in our previous works on protein–protein binding affinity 18 and protein stability 17 to calculate the binding energy as a function of pH. It combines CHARMM 21 molecular mechanics calculations with the computations of the protein ionization. 16 The electrostatic energy contributions are calculated by integration over the binding isotherms shown below. One of the most important features of the method is that it takes into account the energy of proton uptake and the degree of ionization of all sites of titration. Under certain conditions, the changes in the protonation of the acidic and basic residues could significantly affect the electrostatic interactions and consequently binding affinity. To reduce the complexity of the calculations, like most of the simplified physics‐based approaches, the method does not explicitly treat protein flexibility. The energy terms for the bound and unbound states are derived from the corresponding energy‐minimized single conformations. Based on the above approximations, the state free energy can be split into nonpolar and electrostatic terms:
| (7) |
Neglecting protein flexibility, the electrostatic contribution 23 , 24 can be expressed as:
| (8) |
where G elec is the electrostatic energy of microstate X i. The protonation state i of a molecule with Ns sites of titration is defined by the microstate vector X i = [x 1, x 2,…, x Ns] where x i is 1 or 0 depending on whether the site is protonated or not and is the number of possible microstates.
However, calculations using Equation (8) are impractical, because of the combinatorial problem arising from the multiple sites of protonation. But if the ionization characteristics of the protein are known, the electrostatic contribution to the free energy can be derived by integration over the proton binding isotherms. 25 , 26 For this purpose, we used the computationally convenient variant proposed by Schaefer et al. 27 referencing the electrostatic free energy to the energy of the completely deprotonated molecule:
| (9) |
where Q is the mean number of bound protons to the molecule, derived from the fractional protonation,, of the sites of titration i.
| (10) |
The details about the calculations of fractional protonation, , and electrostatic energy, can be found in Spassov and Yan. 16
Finally, in the BSM model, we use exactly the same energy function as in our recent work on binding affinity 18 and protein stability. 17 The free energy of both the bound and unbound states is approximated by a simplified potential of mean force. It is a sum of a few energy terms that are considered as major contributors to the binding affinity:
| (11) |
where is the standard CHARMm van der Waals term and is an entropy‐related term for the cost of reduced side‐chain flexibility, derived from the relative solvent accessibility of protein side chains. 18
Throughout all calculations in this study, we used exactly the same weighting parameters a = 1, b = 0.5, and c = 0.8 and neglecting the surface tension contribution, , as in our previous works. 17 , 18
2.2. ESM: Empirical model of protein solubility
According to the ESM empirical model, the transfer energy, is approximated by a scoring function combining pH‐dependent and pH‐independent terms, as shown in Equation (12).
| (12) |
where Z is the total molecular charge and D is the molecular dipole moment. The coefficients , , and are empirical parameters, and the free parameter C accounts for all contributions that are not included in the model, such as rotational and translational entropy losses, and so forth. The first three terms are calculated as a function of pH, as explained below, and define the pH shape of solubility curves. The last two terms represent the nonpolar interactions and are modeled as pH‐independent.
The term accounts for the electrostatic repulsion between protein molecules and it is proportional to protein net charge square. The second term is introduced to account for the possibility of attractive electrostatic interactions between molecules because of the asymmetry of charge distribution, and it is approximated with the protein dipole moment square, . The calculations of the net charge and dipole moment are evaluated from the fractional protonation, (pH), of the acidic and basic sites of titration using CHARMm GBIM Generalized Born solvation model, 22 implemented in Calculate Protein Ionization and Residue pK 16 Discovery Studio protocol. The accounts for the solvation contribution to transfer energy, and it is calculated as the difference of solvation energies between condensed and liquid (water) phase, defined by their dielectric constants and , in a similar way as in the study of Tjong and Zhou. 10
| (13) |
at a given , and ionic strength I, is evaluated from integration over the binding isotherms as in Equation (9), but in this case instead of from the protonation in the bound and unbound states, the terms are derived from the net protonation of the protein embedded in a media with dielectric constant of condensed phase and in water.
| (14) |
where is the mean number of bound protons to the molecule, derived from the fractional protonation, (pH), of the sites of titration i. The calculations are also carried out using the Protein Ionization Discovery Studio component and the details can be found in our work on protein ionization. 16 A significant difference from the model of Tjong and Zhou, 10 and other solubility models is, that the energy of proton uptake from the acidic and basic residues is taken into account in the calculations of .
The fourth term, represents the effect of the pH‐independent interaction related to the impact of hydrophobic surface patches on the solubility, for example, by making more effective van der Waals contacts in the condensed phase. In the recent model, we assume it is proportional to the aggregation propensity scores, proposed by Chennamsetty et al. 3 and implemented in the Calculate Protein Formulation Properties Discovery Studio protocol.
3. RESULTS
3.1. RNase Sa: Parameterization and testing of the models
Ribonuclease Sa (RNase Sa), shown in Figure 3, is one of the few examples where the precipitation solubility is measured by Shaw et al. 27 in wide pH intervals not only for the wild‐type, but also for its 3K and 5K mutants. In addition, Trevino et al. 28 measured the effect of single mutations of Thr76 on all amino acid types. Therefore, we chose the experimental data of RNase Sa solubility as the basis to parameterize and test the ESM and BSM methods.
FIGURE 3.
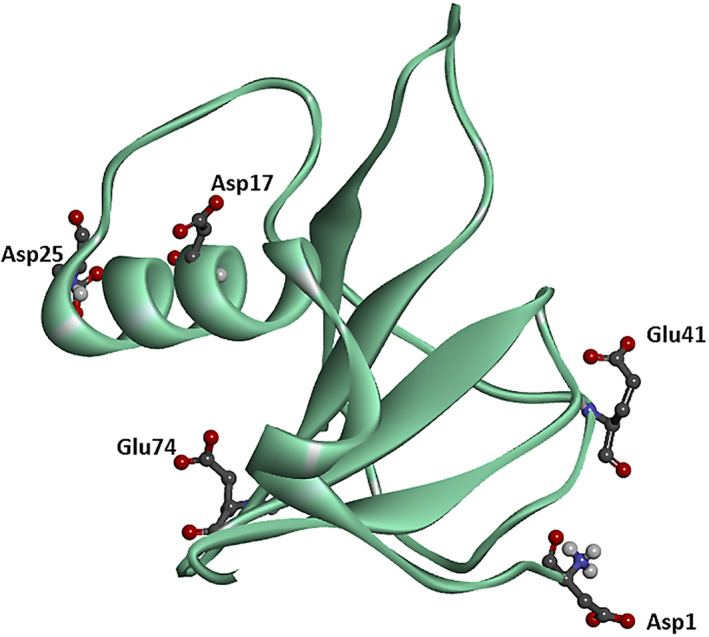
RNase Sa wild‐type
The input structures and the mutations of the RNase variants are listed in Table 1. For the wild‐type and 5K mutant, we used the PDB X‐ray structures 1RGG and 3A5E. For the 3K mutant, we generated a model from 5K mutant (3A5E), instead of the wild‐type (1RGG), because the calculated isoelectric point of the model from 3A5E is closer to the experimental pI than the calculated pI of the model from 1RGG as shown in Table 1.
The calculation of dipole moment is a new feature implemented in the Discovery Studio Protein Ionization component. Figure 4 shows the calculated pH‐dependence of the dipole moment of RNase Sa, and its mutants, compared to the experimental data 29 of Chari et al.
FIGURE 4.
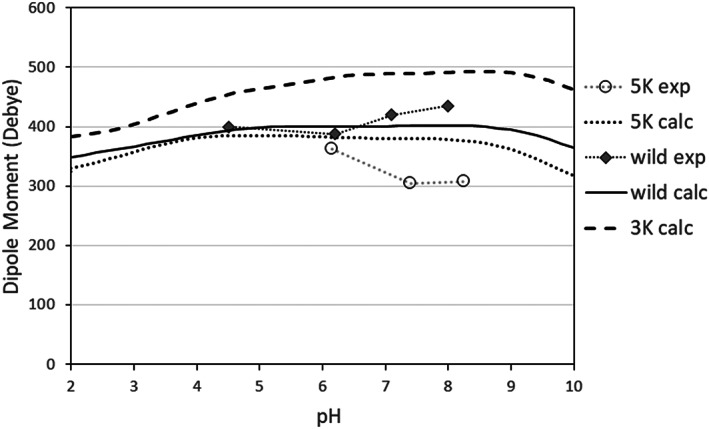
The dipole moment of RNase Sa and its 3K and 5K mutants, calculated as a function of pH at ion concentration 0.01 M. The experimental data are taken from Chari et al. 29
The most important result of the calculations is that the 3K variant shows a considerably bigger dipole moment, about 25% more than the wild‐type and the 5K mutant. It can at least partially explain the lower solubility at the isoelectric point of 3K variant compared to wild‐type and 5K mutant seen in Figure 5, because of the possibility of stronger electrostatic attraction between molecules in the condensed state. Interestingly, the prediction for the wild‐type is almost exact as experimental value at pH 6.7, its pH of crystallization. The dipole moment of 5K mutant is not measured at the crystallization pH of 4.5, but should be quite close to the predicted value based on the trend of the experimental curve.
FIGURE 5.
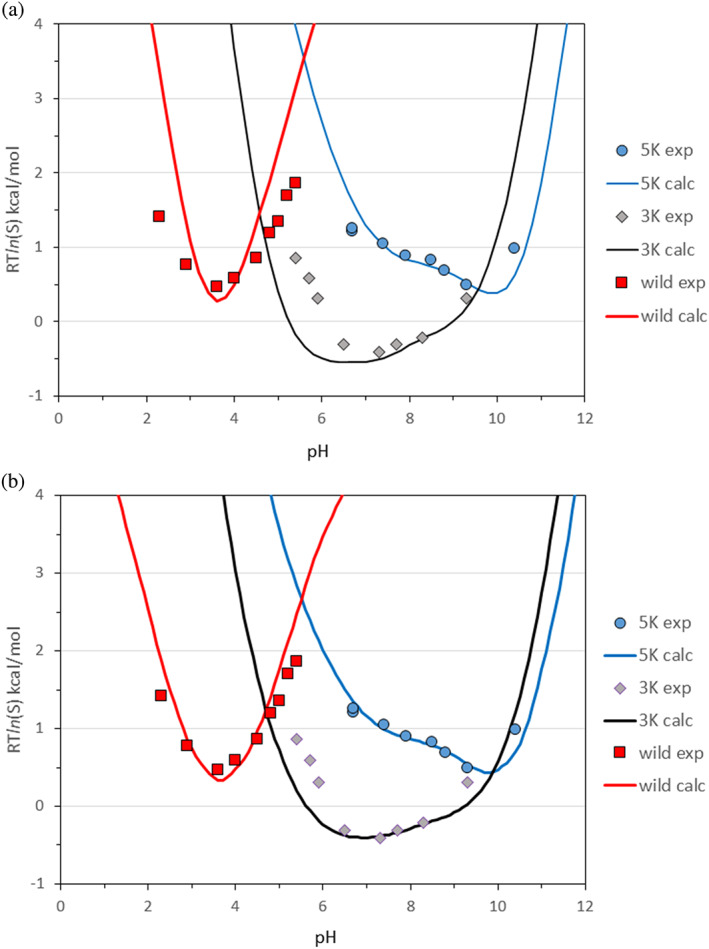
Protein solubility as a function of pH at 0.01 M buffer concentration, calculated for RNase Sa wild‐type and 3K and 5K mutants. (a) ESM model and (b) BSM model. The solubility curves are calculated with step size of 0.1 pH unit. The experimental values are from Shaw et al. 27
3.2. RNase Sa: ESM Model
The parameterization of the pH‐dependent terms of Equation (12) were carried out by fitting the solubility curve of the 5K variant. The 5K variant was chosen because the calculated isoelectric point is very close to the experimental value which suggests that the calculated ionization characteristics should be realistic. The same is also true for the 3K variant. However, the isoelectric point of the wild‐type is overestimated by one pH unit and this error has been observed earlier by us 16 where RNase Sa is one of the two outliers among the 24 different proteins studied. Interestingly, we estimated an isoelectric point of 4.1, which is still above the experimental pI, when using the experimental pKa values. This implies that at low pH RNase Sa probably binds anions from the buffer. Therefore, all calculated pH curves for the wild‐type will be shifted left by one pH unit. The second reason for the choice of the 5K variant was the nontrivial curve shape of the pH‐dependent solubility with a sharp increase after the minimum around the isoelectric point as shown in Figure 5.
For the precipitation experiment, at the buffer concentration of 0.01 M, the best fit of the 5K curve was achieved when were calculated with the dielectric constant of the condensed phase , and the net charge square and dipole moment scaling with and , when the dipole moment is calculated in Debye units.
After fitting the 5K curve, the same parameter values were applied to calculate the wild‐type and the 3K solubility curves. Figure 5a shows the comparison with the experimental data of the calculated pH‐dependence of the RNase Sa solubility and its mutants, carried out at ionic strength I = 0.01, , , and . The curves are adjusted to the experimental points by shifting vertically using the C parameter in Equation (12). Relative to the 5K variant, the C parameter is about +0.6 kcal/mol for the wild‐type and −0.9 kcal/mol for the 3K variant.
As Figure 5a shows, the ESM model predicts the pH shape of solubility with a reasonable accuracy. The minimum values for all three variants are close to the corresponding isoelectric points while the wild‐type curve has a similar parabolic shape as the experimental one, the 3K curve shows a wide minimum around pH 6–8, and the nontrivial shape of 5K curve is predicted almost perfectly. Based on this result, we decided to use the above parameters for the pH‐dependent terms in all calculations in this study, except rescaling the parameter according to the protein radius of gyration relative to RNase Sa. Assuming that the energy of Coulomb interactions in condensed state is the reciprocal of the distance D between the centers of mass of two neighboring molecules, the α parameter is recalculated as α = 0.1D (Rnase Sa)/D, where D = 2(Rgyr + Rc), and Rc = 2.2 Å is the average CHARMm Polar H force‐field radius of carbon atoms. Interestingly, for 3A5E crystal structure with DX‐ray = 30 Å and Rgyr = 12.6 Å, the above definition of D is almost exact.
In the second stage of parameterization, we used the data from Trevino et al. 28 to determine the parameter in Equation 12. The authors engineered 19 variants at the solvent‐exposed position 76 of RNase Sa and measured the effects of each type of amino acid on protein solubility. The experimental solubility of the 20 variants of Thr 76 and two additional mutations, Gln32Asp and Gln77Asp have been measured for this slightly negative charged protein at pH 4.25 by precipitation with 1.1 M ammonium sulfate. We generated the structures of all 21 variants using the Calculate Mutation Energy (Stability) Discovery Studio protocol 17 from the wild‐type structure, and compared the ESM results to Trevino et al. solubility data. The calculations were carried out at pH 5.2 to compensate for the up shift of calculated isoelectric point pI = 4.5 against the experimental pI = 3.5. The effect of the mutations was calculated as RTln (S/S wild) using different values of parameter in Equation (12). The best correlation with the experimental data, was achieved with where the calculated values fit well to the experimental data with an average unsigned error of 0.23 kcal/mol and Pearson correlation coefficient R = .90. As a result, the value of the hydrophobic scaling parameter , along with the parameters and for the pH dependent terms, have been used in all subsequent calculations in this study.
The comparison of the calculated solubility to the experimental data is shown in Figure 6. As can be seen in the plot, the prediction of the solubility changes for all charged, polar, and aromatic residues is quite good, with the exception of the Thr76Ser mutations. The decrease in solubility after the mutations to hydrophobic residues Phe, Leu, Val, and Ile is also predicted correctly, but about two times overestimated.
FIGURE 6.
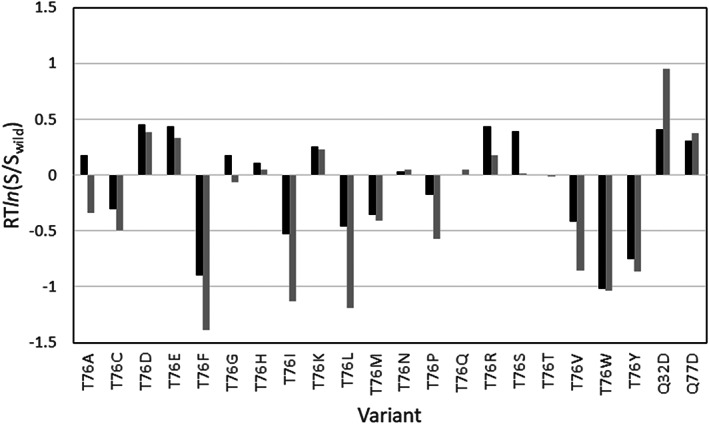
The effect of 21 single point mutations on RNase Sa solubility, calculated by ESM model at pH = 5.2 and 1.1 M ammonium sulfate. Experiment—black bars, calculated—grey bars
3.3. RNase Sa: BSM Model
The BSM calculations of RNase Sa solubility were carried out using a modeled crystalline particle, generated from the X‐ray structure of 5K mutant (PDB ID: 3A5E). The model particle, shown in Figure 2, contains the central molecule (in red), surrounded by all 12 immediate neighbors. Since the molecules on the surface of the crystal lattice can be in different orientations, instead of evaluating the average binding energy based on 12 computationally costly separate calculations, we tested a simpler approach where the transfer energy is calculated in one step as:
| (15) |
where is the binding energy of the central molecule, as shown in Figure 2b.
As with the ESM model, in the first test of the BSM method, we calculated the pH‐dependence of the solubility of RNase Sa and its 3K and 5K mutants. For this purpose, we used the Calculate Mutation Energy (Binding) Discovery Studio protocol. 18 The input structure was the model crystal particle of 5K mutant, and the mutations corresponding to 3K and wild‐type variants have been applied simultaneously to all 13 molecules in the particle.
In Figure 5b, the pH‐dependent solubility curves, /2, (see Equation (15)), calculated for the wild‐type, 3K and 5K variants are compared to the experimental data of Shaw et al. 27 The binding energy of central molecule, , for the 5K variant is calculated as the electrostatic contribution only, while of the wild‐type and the 3K mutant is the sum of the electrostatic contribution, the relative van der Waals energy , and the relative side chain entropy to the 5K variant.
It is worth emphasizing that the fit of the 5K and 3K variants is achieved without any adjustments, besides a vertical shift of the calculated curves by exactly the same amount, −12.4 kcal/mol for both mutants. The wild‐type curve is shifted down by −11.6 kcal/mol which is quite close to the 5K and 3K correction.
To test the ability of the BSM method in predicting the effect of mutations on protein solubility we used the same set of experimental data, 28 as in the ESM calculations reported above. The model crystalline particle for the wild‐type was the same cluster of 13 molecules generated from the 5K variant in the pH‐dependent solubility calculation by mutating all five lysine residues to the corresponding wild‐type Asp and Glu, as described in the previous paragraph. The calculations were carried out at pH 5.2 and ionic strength I = 3.3 corresponding to 1.1 M ammonium sulfate.
The comparison with the experimental data of the predicted effect of mutations on the RNase Sa solubility is shown in Figure 7. As with the ESM prediction, the effects of the mutations in increasing or decreasing solubility are predicted correctly for 19 out of the 21 cases (90%), although the numerical values of the solubility for some of the substitutions are overestimated. However, there is one outlier, Thr76Arg. Its solubility is incorrectly predicted as decreased, opposite to experimental observation. The reason for the calculated decreased solubility of Thr76Arg is that the stronger van der Waals interactions of the mutant in the bound state outperform the electrostatic repulsion and side‐chain entropy losses. The overall Pearson correlation coefficient, R = .86, is somewhat lower than ESM correlation coefficient, R = .90, but slightly better, R = .92, without the Thr76Arg outlier.
FIGURE 7.
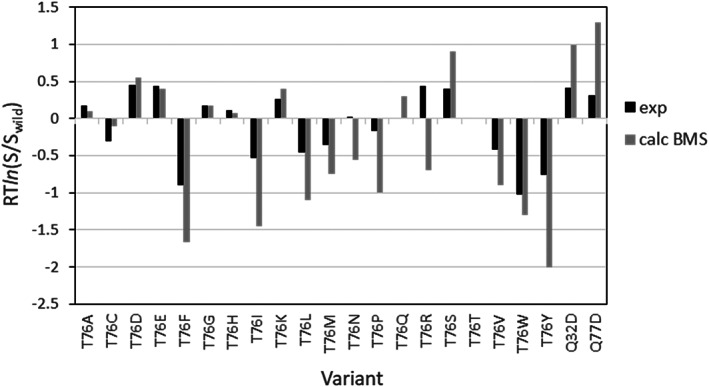
The effect of the mutations on RNase Sa solubility, calculated by BSM model at 1.1 M ammonium sulfate. Experiment—black bars, calculated—grey bars
We would like to note, that all of the RNase Sa BSM results are achieved without any re‐parameterization of the binding affinity model 18 incorporated in the Calculate Mutation Energy (Binding) Discovery Studio protocol. The results are obtained using exactly the same parameters as in our previous works on the effect of mutations on protein–protein binding affinity 18 and protein stability. 17
To the best of our knowledge, our BSM method is the first attempt reported in literature, where the protein solubility is evaluated using a complete physical, force‐field‐based model of protein binding to crystalline lattice. However, for now, the BSM method is applicable only to proteins of medium size up to 150–200 amino acid residues. It is because the iterative procedure in the IMC routine that calculates the fractional protonation of the sites of titration in protein ionization method 16 occasionally does not converge when the system is too big. The IMC routine is based on the Iterative Mobile Clustering approach 30 to treat the combinatorial problem in proteins with multiple sites of titration, arising from the exponential growth of protonation states with the number of titratable groups. With the IMC approach, systems with up to about 1,500 residues, such as 3A5E crystalline particle or a full‐length antibody are effectively treated. However, for the cases such as crystalline particle of an antibody Fab fragment, containing more than 5,000 residues, the calculation does not converge. Therefore, for Zn‐insulin hexamer and antibodies, the solubility predictions in this study are evaluated by ESM method only. We believe that this problem could be fixed, for example, by excluding Arg, Lys, and Tyr residues from the titration sites and treating them as permanently protonated, which could be reasonable when solution pH is less than 8–9.
3.4. Crambin
Crambin is a plant seed protein from Crambe abyssinica. It is an example of a protein, completely insoluble in water, which was successfully made soluble by protein engineering carried out by Kang et al. 31 Based on the sequence analysis with homologous proteins the authors converted crambin from insoluble to soluble by a triple mutation Thr1Lys/Phe13Tyr/Ile33Lys (KYK). We employed the ESM and BSM models to crambin molecule (PDB ID: 1CRN), with the aim to verify if the calculated solubility scores capture the significant increase of the KYK solubility. Crambin is a small protein with a matching number of acidic and basic residues, that is, two Arg, one Glu, and one Asp. As a result, shown in Figure 8, the calculated wild‐type net charge, Z, is zero in a relatively wide pH‐interval from 5 to 7. In other words, for this type of amino acid composition, the isoelectric point is not a single pH value but a pH range.
FIGURE 8.
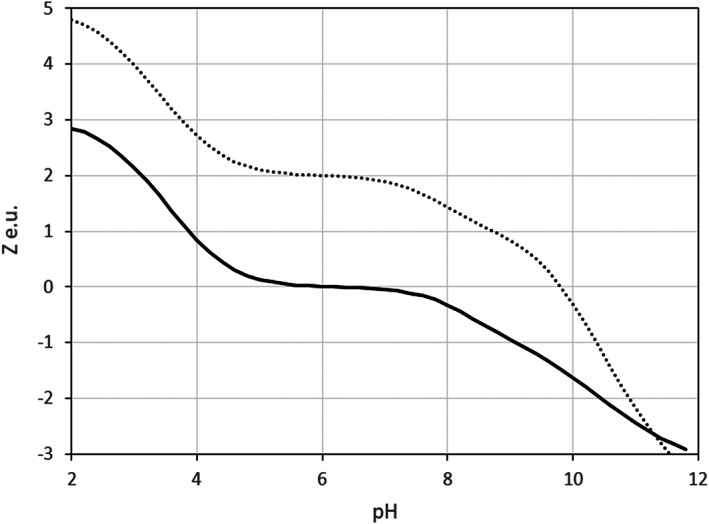
Calculated net charge, Z(pH), of crambin. Solid line—wild‐type, dotted line—KYK mutant
Figure 9 shows the pH solubility curves of crambin, calculated using ESM (A) and BSM (B) models. The ESM calculations were carried out with to account for the smaller radius of crambin relative to RNase Sa.
FIGURE 9.
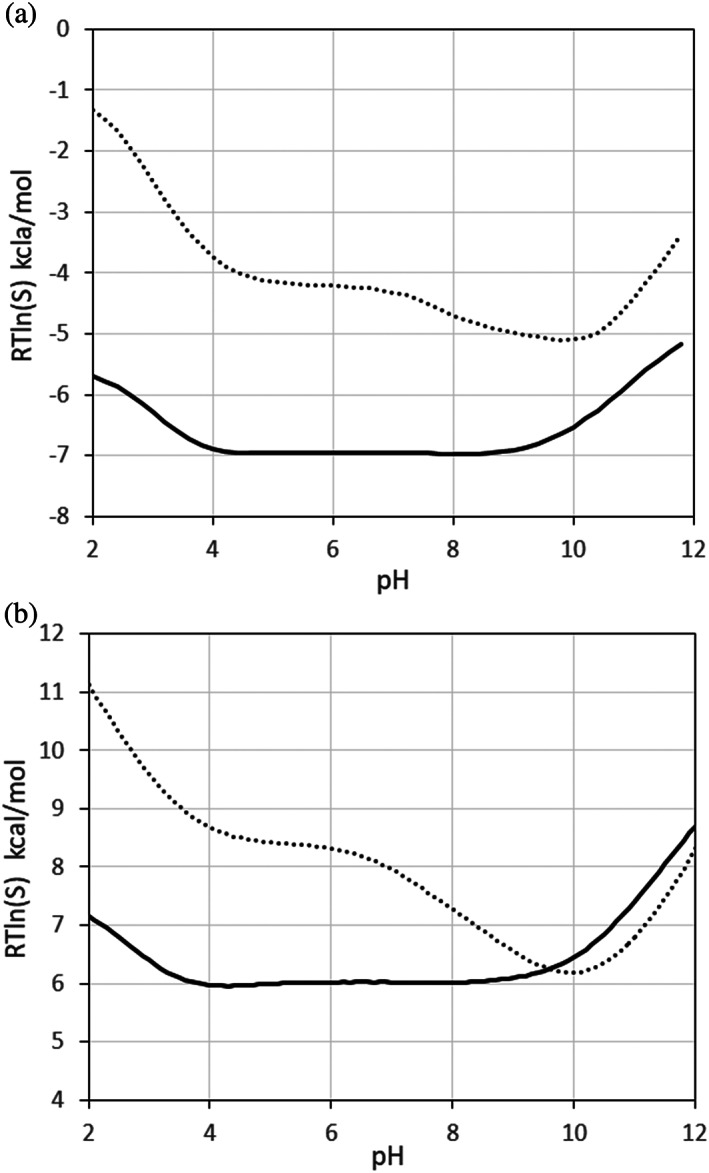
pH‐dependent solubility of crambin calculated using (a) ESM, and (b) BSM model. Wild‐type—solid line, KYK mutant—dotted line
The BSM calculation was performed on a crystalline particle generated using Discovery Studio, shown in Figure 10, with 13 immediate neighbors of the central (in red) crambin molecule.
FIGURE 10.
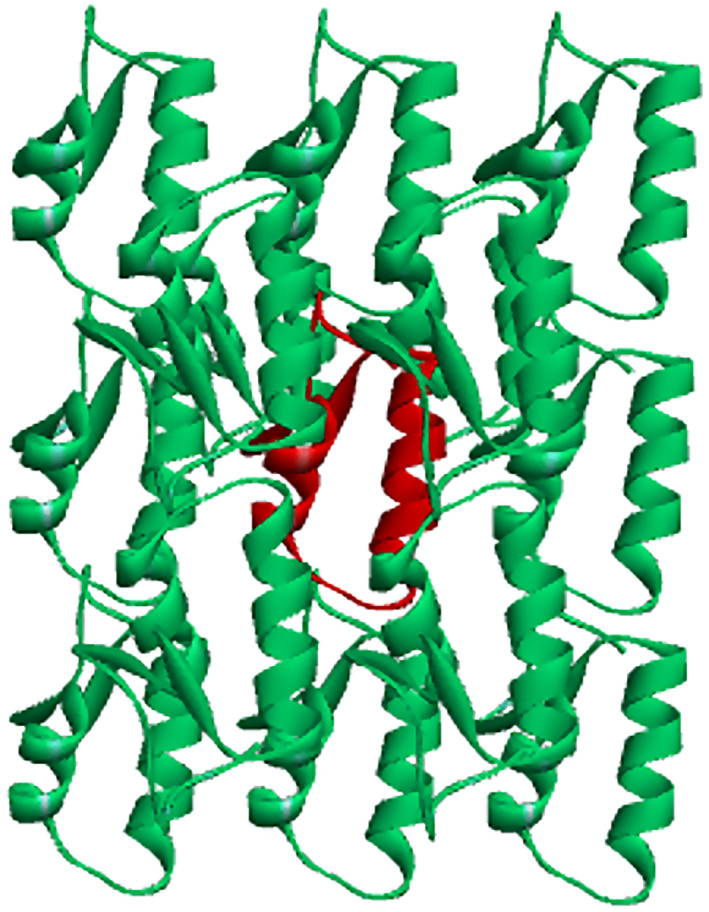
Model crystalline particle of crambin for the BSM calculations. The central molecule is in red
Both methods predict a similar shape of solubility curves with a minimum at pH 10 for the KYK variant. At normal pH, the calculated RTln(S) of KYK mutant relative to the wild‐type show a similar increase of 2.3 kcal/mol for BSM and 2.7 kcal/mol for the ESM model.
A closer look at the ESM energy terms shows that the increase of KYK solubility is mostly due to the desolvation term (1.0 kcal/mol) and (1.3 kcal/mol), with a lower contribution from the charge repulsion (0.5 kcal/mol), and even less from the dipole moment (−0.1 kcal/mol).
According to the BSM model, the increased KYK solubility is because of the increased electrostatic term kcal/mol and entropy term , but opposed by a negative van der Waals contribution,.
In conclusion, both the BSM and ESM methods predict a strongly increased solubility for the KYK mutant.
The transfer energy difference of 2.3 kcal/mol and 2.7 kcal/mol for BSM and ESM method respectively corresponds to a 50–100 times increased solubility of the mutant relative to the wild‐type, calculated as .
Such a significant solubility increase is consistent with the fact that the KYK mutation converts the insoluble wild‐type protein to be soluble in water.
3.5. Zinc insulin
Insulin was one of the first proteins with an experimentally measured pH‐dependent solubility profile. 32 , 33 , 34 We employed the ESM method and compared it to the experimental solubility data of Desbuquois and Aurbach 33 for the porcine zinc‐insulin hexamer. The input was the X‐ray structure (PDB ID: 4INS) of the porcine Zn‐insulin, shown in Figure 11.
FIGURE 11.
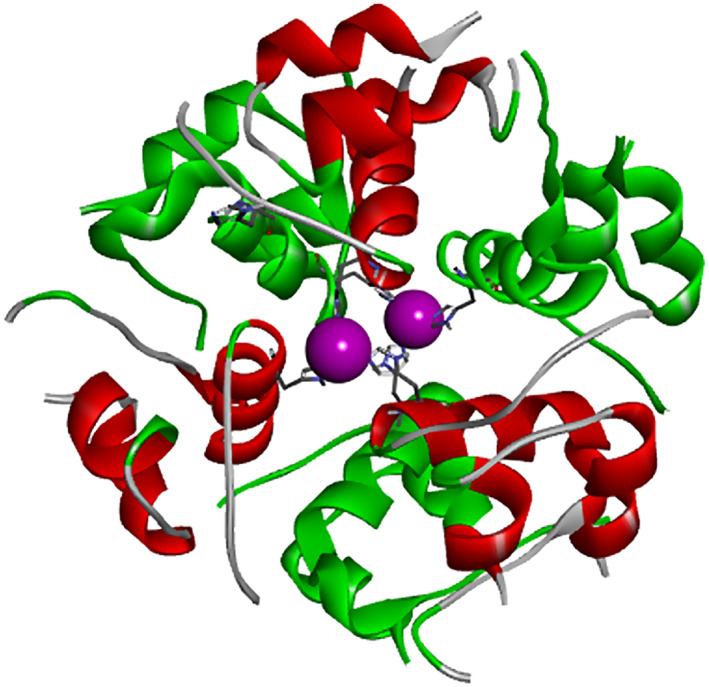
The structure of zinc‐insulin hexamer. The zinc atoms are in magenta
The ESM calculations were performed at an anionic strength corresponding to 0.02 M citrate/phosphate buffer. The value of the parameter α was reduced to 0.07, according to the calculated radius of gyration of 19 Å of the insulin hexamer. The calculated value of the isoelectric point, pI = 4.92, is very close to the pI of 5 reported in the Desbuquois and Aurbach 33 paper. The calculated pH‐curve of the insulin solubility is compared to the experimental data in Figure 12. For the purpose of the visual comparison, the calculated curve is adjusted to the experimental points by shifting vertically by −2.6 kcal/mol using the C parameter in Equation (12).
FIGURE 12.
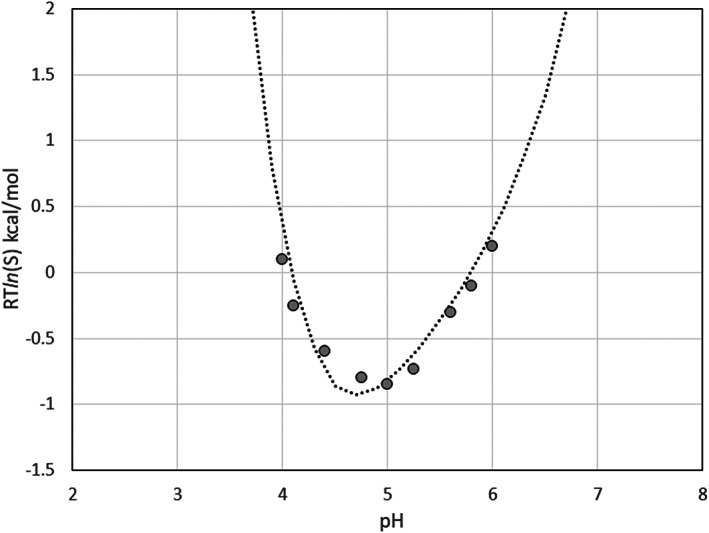
The calculated solubility of the zinc‐insulin, at 0.02 M citrate/phosphate buffer compared to the experimental data 33
The insulin calculations show that the ESM model predicts the experimental pH‐dependence of solubility quite accurately. The isoelectric point and the minimum of solubility are correctly predicted at pH ~ 5 and the calculated and experimental curves show a highly similar parabolic shape.
3.6. Predicting the effect of mutations on protein solubility
The ESM method is developed for quantitative predictions of pH‐dependent protein solubility and the effect of mutations on protein solubility in precipitation experiments. However, quite often the change of the solubility upon mutations is evaluated by indirect experimental methods and the results are presented not in numerical solubility values, but as the trending effect, for example, as increasing or decreasing the solubility. Tian et al. 35 assembled a relatively large data set with the effect of 137 different mutations on the solubility of 18 proteins with known X‐ray structure. We applied the ESM method to 122 mutations of 17 proteins, taken mostly from Tian data set with the aim of assessing the ability of the ESM model to predict the solubility changes regardless of the experimental method or the type of aggregation. Three PDB structures, 1WUU, 1J3I, and 1LVM, have been discarded because of large gaps in the structure or non‐standard amino acid residues, and two more cases, 3A5E and 1CRN, are added.
In the calculations based on the Tian data set, we tested two scoring functions:
and
otherwise: decreased solubility.
where SF1 is derived from the ESM transfer energy, , defined by Equation (12).
The second scoring function, SF2 is an extension of SF1 taking into account that most proteins are only marginally stable and “single amino acid substitutions can dramatically increase or decrease folding energy values and some substitutions surely lead to unfolding of the polypeptide chain.” 45 Mutations reducing the protein stability could lead to partial or full protein denaturation which in turn could increase the chance of amyloid formation and aggregation, due to exposing of the buried hydrophobic residues to the solvent. The Calculate Mutation Energy (Stability) Discovery Studio protocol has been used to generate the structures of the mutants and to calculate the folding energy differences,
For most proteins, the free energy of denaturation is observed 45 to be between 3 and 15 kcal/mol. The SF2 threshold value of 4.0 kcal/mol has been chosen to be close to the lower limit of the stability energy interval. The ESM calculations have been carried out using the Calculate Protein Formulation Properties Discovery Studio protocol at pH 7, ionic strength I = 0.145, and with all parameters set to the default values for this study, that is, , and .
The summary of the results for Tian data set is presented in Table 2, and the detailed data for each mutation can be found in Table S1.
TABLE 2.
The effect of mutations on protein solubility
| Protein | PDB code | Number of mutants | More soluble | Less soluble | ||||
|---|---|---|---|---|---|---|---|---|
| Experiment | Correctly predicted | Experiment | Correctly predicted | |||||
| SF1 | SF2 | SF1 | SF2 | |||||
| RNase Sa | 1RGG | 21 | 12 | 10 | 10 | 9 | 9 | 9 |
| RNase Sa 5K | 3A5E | 1 | 0 | 0 | 0 | 1 | 1 | 1 |
| HIV‐1 integrase | 1BIZ | 8 | 2 | 2 | 2 | 6 | 6 | 6 |
| Colicin | 1COL | 10 | 4 | 4 | 4 | 6 | 6 | 6 |
| Aβ42 peptide | 1Z0Q | 26 | 24 | 24 | 23 | 2 | 0 | 0 |
| FOP | 2D68 | 9 | 0 | 0 | 0 | 9 | 5 | 5 |
| MS2 coat protein | 1MSC | 13 | 0 | 0 | 0 | 13 | 6 | 13 |
| Crambin | 1CRN | 1 | 1 | 1 | 1 | 0 | 0 | 0 |
| Interleukin 1‐b | 9ILB | 6 | 1 | 0 | 0 | 5 | 4 | 5 |
| a‐1 prot. inhibitor | 8API | 3 | 1 | 1 | 0 | 2 | 1 | 1 |
| Hemoglobin | 2D60 | 3 | 2 | 1 | 1 | 1 | 1 | 1 |
| APOBEC3G | 3IQS | 11 | 5 | 4 | 4 | 6 | 4 | 4 |
| Basic growth factor | 1FGA | 3 | 0 | 0 | 0 | 3 | 2 | 2 |
| UEP‐kinase | 2BND | 1 | 1 | 1 | 1 | 0 | 0 | 0 |
| GP24 | 1YUE | 1 | 0 | 0 | 0 | 1 | 1 | 1 |
| CD58 | 1CI5 | 1 | 0 | 0 | 0 | 1 | 1 | 1 |
| Maltose‐binding protein | 1JW4 | 4 | 0 | 0 | 0 | 4 | 0 | 4 |
| 122 | 53 | 48 | 46 | 69 | 47 | 61 | ||
| 90% | 87% | 68% | 88% | |||||
| All | Experiment | SF1 | SF2 | |||||
| 122 | 95 | 107 | ||||||
| 78% | 88% | |||||||
As can be seen in Table 2, the results obtained by using both scoring functions show a relatively high percentage of correctly predicted cases. The use of the SF2 function improves the overall accuracy from 78% to 88%, due to the improved prediction of the mutations that lead to less soluble protein variants, but slightly worse prediction rate of the mutations with increased solubility. The most dramatic improvement of the SF2 compared to SF1 predictions of the less soluble variants can be seen for 1JW4 and 1MSC cases. As shown in Table S1, the calculated values are beyond 4.0 kcal/mol for all 1JW4 mutations and all 1MSC multiple mutations, indicating that these mutations reduce the stability of the protein significantly and in turn, lead to the reduction of the solubility, even though the SF1 score predicts the mutants as more soluble.
3.7. Modeling antibody solubility
One of the main problems in predicting the effect of mutations on antibody solubility by an atomistic model is that most of the available X‐ray structures are of antibody fragments, such as Fab or Fv domain, while the solubility measurements usually are carried out on full‐length antibodies. However, when the mutations are situated in the variable fragments only, with identical constant domains, it makes sense to investigate if the predicted physicochemical properties of the Fv domain can correlate with experimental solubility data. A specific problem arises when applying the ESM model to antibody molecules with the aim of ranking full‐length mAb solubility, where the electrostatic repulsion and the dipole attraction are modeled by single point molecular charge and dipole. The monoclonal antibodies are big proteins with a Y‐shaped structure consisting of two Fab and one Fc domains. Modeling the electrostatic repulsion and attraction forces between mAb molecules in solution and in crystal form as interactions between two point charges or point dipoles is a crude approximation and likely to be inaccurate, especially with the highly variable relative orientations of the Fab and Fc domains linked by the hinge region. Taking into account that the mutations of the Fab or Fv fragment could affect the stabilization of the crystalline state by both Fab–Fab and Fab–Fc interactions, here we proposed and tested an antibody oriented variant of ESM scoring function (ESMab):
| (16) |
Equation (16) is applicable to cases with available structures of both Fab and Fc fragments. and are the net charges of the Fab and Fc fragments, and and are the corresponding dipole moments.
In this section, we present the predicted effect of mutations and comparison to experimental solubility data for five antibody data sets. They are seven variants of CNTO607 anti‐IL‐13 antibody, 36 , 37 nine distinct monoclonal antibodies targeting nerve growth factor (NGF), 9 11 variants of the model antibody mAb‐J, 38 17 antibody variants of the humanized anti‐trinitrophenyl antibody HzATNP, 2 and 11 variants of VEGF binding G6 synthetic mAb. 39
3.8. CNTO607
In a study on a modified anti‐IL‐13 monoclonal antibody CNTO607 Wu et al., 36 the authors engineered and measured the solubility of six mutation variants (mAb2–mAb7) of the parent antibody (mAb1) with the aim of improving protein solubility. The sequence differences between mAb1 and all six engineered variants are summarized in Figure S2. In a second work of Bethea et al., 37 the authors evaluated the effect of the double mutation K210T, K215T (mAbK) that disrupts the salt bridges between Fab fragments in the crystal tetramer.
We applied the empirical ESM model to evaluate the antibody solubility scores using the input atomic coordinates from the X‐ray structure 40 of the CNTO607 Fab fragment (PDB ID: 3G6A). The calculations are based on ESM model and carried out using the Calculate Formulation Properties Discovery Studio protocol with all parameters set to default values, except rescaled parameter to account for roughly doubling the radius of gyration of the Fab fragment compared to the RNase Sa. The solubility differences, calculated at pH 7.2 are compared to the precipitation solubility measurements in Table 3 and in Figure 13.
TABLE 3.
Comparison of the calculated and experimental solubility data of CNTO607 variants
| Variant | Solubility S (mg/ml) | RTln(S/S mAb1) (kcal/mol) | |||||
|---|---|---|---|---|---|---|---|
| exp | calc | pI | Net charge | ||||
| ESM | SB | exp | calc | calc | |||
| mAb1(parent) | 13.3 | 0.00 | 0 | – | ~7.4 | 7.04 | −0.42 |
| mAb2 | 29.1 | 0.46 | 0.55 | – | 7.8 | 7.9 | 1.4 |
| mAb3 | 25.4 | 0.38 | 0.35 | – | NA | 7.01 | −0.47 |
| mAb4 | 12.4 | −0.04 | 1.12 | – | NA | 7.71 | 1.15 |
| mAb5 | 29.2 | 0.46 | 1.93 | – | NA | 7.62 | 0.94 |
| mAb6 | >164 | >1.48 | 0.61 | 4.56 | NA | 7.88 | 1.25 |
| mAb7 | >110 | >1.25 | 1.38 | – | >7.8 | 8.52 | 2.34 |
| mAbK | >100 | >1.19 | 1.24 | 6.94 | ~6.4 | 6.22 | −2.27 |
FIGURE 13.
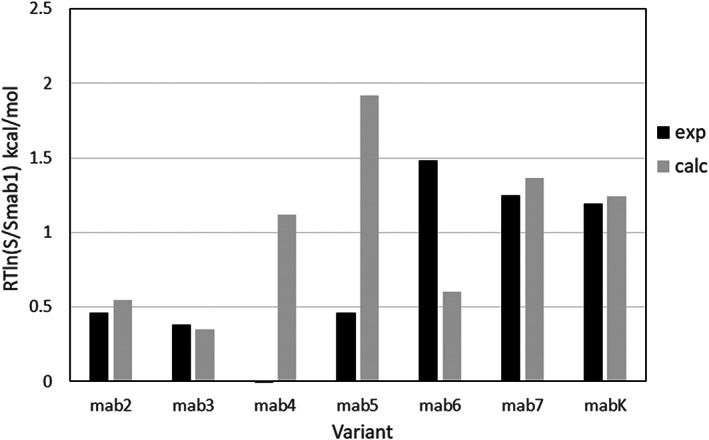
Calculated solubility differences of the Fab CNTO607 variants (grey bars) compared to the experimental data (black bars) for CNTO607 antibody at pH 7.2 in PBS buffer. The transfer energy differences are referenced to the mAb1 variant
Note that the experimental solubilities are measured at pH 7.2 which is very close to both the experimental isoelectric point of CNTO607, and the calculated isoelectric point of mAb1 FAB fragment. The small calculated net charge of the mAb1 Fab domain implies that, at pH 7.2, the net charge of the rest of the full‐length antibody should be close to zero. To check this assumption, we calculated the ionization of the IgG1 (PDB ID: 1HZH) Fc fragment using the Calculate Protein Ionization and Residue pK Discovery Studio protocol. The calculated isoelectric point, pI = 7.38, and the small Fc net charge of 0.6 e.u. at pH 7.2 confirm the neutrality of the CNTO607 Fc domain. Since the Fc domains are the same for all CNTO607 variants, at pH 7.2 all differences in protein ionization will be present in the Fab fragment. Therefore, it is reasonable to use the 3G6A Fab structure as a proxy for CNTO607 full‐length antibody in the calculations of the effect of mutations on the solubility.
The first variant (mAb2) engineered by Wu et al. 36 was aimed at increasing the antibody molecular repulsions and therefore the antibody solubility by a light chain mutation that increases the pI of Fab domain and consequently the Fab net charge. The mutations in mAb3 and mAb5 variants are intended to increase the solubility by reducing the surface hydrophobicity of the light chain. The mAb4 variant combines the mutations of mAb2 and mAb3.
The mutations of mAb6 and mAb7 variants have been proposed 36 based on the analysis of the structure of the CNTO607 Fab crystal. The authors suggested that the aromatic triad 103WHF105 is involved in the specific binding hotspot for Fab–Fab interactions in the CNTO607 dimer (Figure 14a). Similarly, this strong interaction involving the aromatic triad may have a major impact on antibody precipitation, since the Fab–Fab interactions could induce mAb precipitation. The latter has been confirmed by the more than tenfold increase in the measured mAb6 solubility when 103WHF105 was mutated to 103AAA105 36 as shown in Table 3. Taking into account that 103WHF105 is part of the CDR H3 loop and would affect the antigen binding, the authors proposed another mutation D54N in mAb7 to create an N‐glycosylation site in H‐CDR2 which was found in the original antibody. The increased solubility of mAb7 suggests that the glycosylation on CDR H2 loop would protect the triad on H3 loop and disrupt the specific interaction of H3 to reduce dimerization.
FIGURE 14.
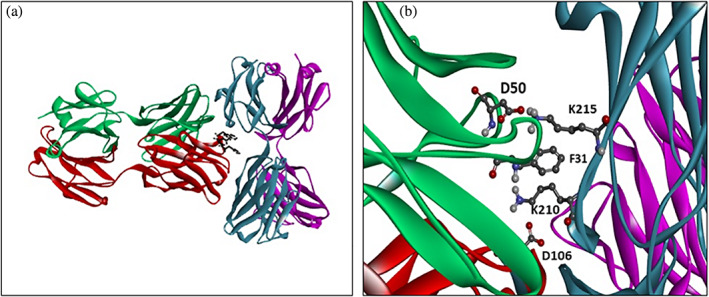
CNTO607 Fab–Fab interface. (a) B:Phe103, B:His104, B:Trp105 triad. (b) H:Lys210 and H:Lys215 are involved in a cluster with A:Phe31, and salt bridges with B:Asp106 and A:Asp50. A (green) and B (red) are the light and heavy chains of the first molecule, L (magenta) and H (cyan) of the other
As shown in Table 3 and Figure 13, the trend of the solubility change is predicted by ESM model correctly for all variants except mAb4. Interestingly, even without taking into account the specific Fab–Fab interactions in mAb6 and mAbK or glycosylation in mAb7, the solubility increasing of mAb6, mAb7, and mAbK are predicted, but the effect of the mAb6 mutation is underestimated as expected.
3.9. The impact of specific interactions on CNTO solubility
The variants mAb6 and mAb7 36 were engineered with the aim of increasing solubility by breaking the specific interactions between the H:103FHW105 triad of the H3 loop and the elbow region of a symmetry‐related Fab molecule, as shown in Figure 14a. Likewise, the mAbK 37 mutant was engineered to disrupt Fab–Fab interaction by eliminating two salt bridges H:K210‐B:D106 and H:K215‐A:D50 (Figure 14b). A: and B: denote the light and heavy chains of the first molecule, and L: and H: of the second.
We used the mAb6 and mAbK cases to test the ability of Discovery Studio to predict computationally the effect of specific interactions on the CNTO607 solubility. For this purpose, we carried out alanine scanning of all residues from the Fab–Fab dimer interface that are within 5 Å contact distance using the Calculate Mutation Energy (Binding) 18 Discovery Studio protocol. The atomic coordinates of the Fab dimer are taken from the asymmetric unit of the 3G6A PDB structure. The results are shown in Figure S4a and S4b. As shown in Figure S4a, the alanine scanning results of the 103FHW105 triad are consistent with the strongly increased solubility of mAb6 mutant. The results also confirm the suggestion of Bethea et al. 37 that the main contribution comes from the W105A mutation (S exp > 116), while the effect of H104A is minimal. Our results also predict that another mutation of the Fv fragment, Y53A, could have a similar impact on the CNTO607 solubility and will be of interest to evaluate experimentally.
The alanine scanning of the CH1 region of the other Fab shown in Figure S4b are also in good agreement with the high solubility of K210A/K215A mutant.
The BS column of Table 3 shows the calculated Mutation Energy values for the triple mutation 103FHW105–103AAA105 in mAb6 and the double mutation K210T/K215T in mAbK. Interestingly, a more close analysis of the mAbK results shows that the main effect of the K210T/K215T mutation comes not from eliminating the salt bridges involving lysine residues, but from the van der Waals contribution. Figure 14a shows that the two CH1 lysine residues are part of a cluster with F31 from the light chain of the other molecule. Based on the calculated energy of more than 3 kcal/mol for F31A mutation (Figure S4a), we suggest that F31A could be used as an alternative to K210 or K215 mutations in engineering soluble CNTO607 variants.
3.10. Nine distinct monoclonal antibodies targeting NGF
In a recent study, Sormanni and coauthors 9 measured the solubility in PEG of nine distinct mAb variants of an antibody targeting the nerve growth factor. This data set is interesting for testing the in silico predictions because the variants differ by up to 32 amino acids, located in the VH and VL domains. The sequences of the mAb variants are shown in Figure S3. The structure of mAb1 Fv was kindly provided by Dr Bojana Popovic, AstraZeneca. Based on the mAb1 Fv structure we generated the structures of all other eight VH/VL variants using the Calculate Mutation Energy (Stability) Discovery Studio protocol. The ESM scores were calculated according to Equation (12) at pH 5.5 and ionic strength corresponding to 0.01 M citrate buffer. The calculations were carried out using the default parameters except with rescaled to 0.05. In Figure 15, the ESM RTln(S/SmAb1) values are compared to the apparent solubilities derived from the PEG experiment. Even though the experimental solubility values were obtained for the full antibody, and the ESM calculations were carried out on the Fv structures, the experimental data and calculated results are highly consistent. Apart from mAb8, all mutants that increase or reduce the solubility are predicted correctly. Compared to the PEG1/2 data the Pearson correlation is R = .89 shown in Figure S5.
FIGURE 15.
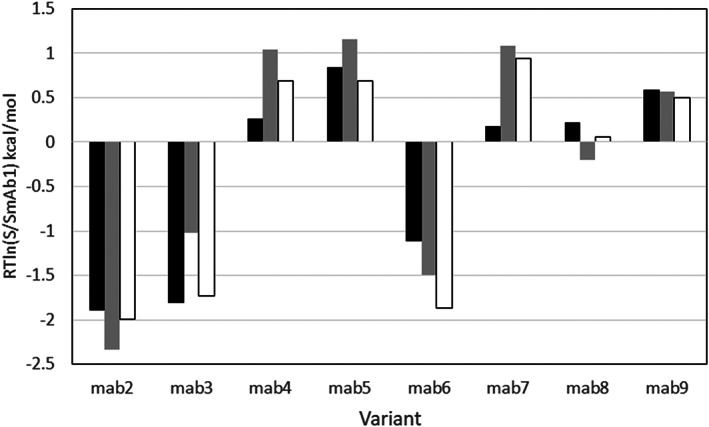
The relative solubility of NGF antibody variants calculated at pH 5.5 and ionic strength corresponding to 0.01 M citrate/phosphate buffer. The ESM solubility scores are compared to the experimental values of apparent solubility, reported in Sormanni et al. (2017) 9 paper. Experiment—dark bars, ESM results—gray bars, nonelectrostatic term only (γAS in Equation (12))—white bars
It is worth noting that compared to CamSol predictions (Sormanni et al. 2017; overall R = .78 and .92 excluding one outlier), the relatively high correlation, R = .89, of ESM predictions is achieved without excluding outliers. Unfortunately, for this data set, neither the sequence nor the structure information of the Fab and the full‐length antibody are available. In general, comparing the results calculated by the ESM model based on the Fv domain with the full‐length antibody experimental solubility data could lead to errors, because the Fv domain is not a good approximation for the net charge, dipole moment, and even of the full length or Fab domain. Interestingly, when we omitted the electrostatic terms and re‐calculated the solubility differences (white bars in Figure 15) based only on the aggregation scores (γAS in Equation (12)), the correlation was improved to R = .95 which indicates that the variation of solubility of the variants from this data set depends mostly on the surface hydrophobicity.
3.11. mAb‐J
Recently, Shan et al. 38 measured a number of physicochemical properties of engineered variants of a model IgG1 antibody, mAb‐J. Here, we used their mAb‐J PEG precipitation results to test the ESM method. The list of mutations and solubility data are shown in Table 4.
TABLE 4.
List of mutations and solubility data of mAb‐J variants
| Mutation | ESM model | Experiment | DI | |||
|---|---|---|---|---|---|---|
| pI | Net charge | RTln(S) (kcal/mol) | S app (mg/ml) | RTln(S app) (kcal/mol) | ||
| Wild | 8.26 | 4.87 | −1.73 | 5.1 | 0.96 | 104.22 |
| H:W99N | 8.27 | 4.87 | −0.56 | 7.7 | 1.20 | 99.01 |
| H:W99R | 8.75 | 5.76 | 1.94 | 16 | 1.64 | 99.09 |
| H:W99A | 8.23 | 4.86 | −1.05 | 8.7 | 1.28 | 101.08 |
| H:W99D | 7.7 | 4.01 | −3.08 | <1 | <0 | 99.65 |
| L:F52D | 7.7 | 4.02 | −2.57 | 10.8 | 1.40 | 100.37 |
| H:K100AD | 7.28 | 3.42 | −6.02 | <1 | <0 | 106.36 |
| H:K100AA | 7.7 | 4.04 | −5 | <1 | <0 | 108.09 |
| L:F52S | 8.24 | 4.85 | −0.93 | 12.7 | 1.50 | 100.03 |
| L:R54Q | 7.69 | 3.97 | −3.28 | 5.9 | 1.05 | 104.21 |
| H:K98A | 7.71 | 4.31 | −3.51 | 11 | 1.42 | 106.48 |
The experimental solubility of the different mAb‐J variants is determined at pH 6.0 using a high‐throughput PEG precipitation assay, 38 and are reported as apparent solubility values, S app, in mg/mol, evaluated after fitting the solubility in different PEG concentrations.
We applied the ESM and ESMab models using the Fab structures of the mutants, generated by the Calculate Mutation Energy (Stability) Discovery Studio protocol from the X‐ray structure of the wild‐type, for example, the high‐affinity anti‐IgE antibody (MEDI4212) Fab fragment (PDB ID: 5ANM). All ESM calculations were carried out at pH 6.0 with the default ESM parameter values, except that the parameter was reduced to 0.05. The results are presented in Tables 4 and 5, and in Figures 17 and S5.
TABLE 5.
mAb‐J results obtained with different variants of ESM models. All calculations are carried out at pH 6.0
As seen in Figure 16, the effect of mutations is predicted correctly for 7 out of the 10 variants. Similar to Shan et al. 38 study, the variant H:K98A appears as an outlier. Following the suggestions of Shan et al., we excluded H:K98A from the statistics of the predictions. Without H:K98A, both the ESM and ESMab show the same correlation, R = .83, with experimental apparent solubility data, and outperform the CamSol prediction R = .71 reported in Shan et al. 38 study.
FIGURE 16.
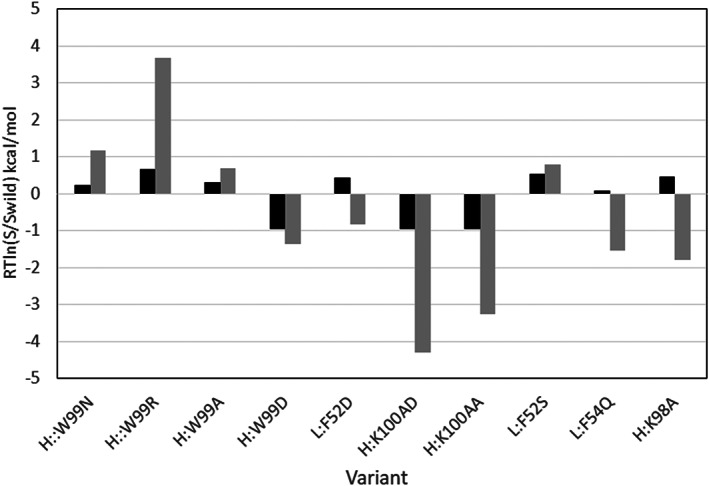
The relative solubility of mAb‐J variants calculated at pH 6.0. The ESM solubility scores are compared to the experimental values of apparent solubility, reported in Shan et al. 38 paper. Experiment—dark bars, ESM results—gray bars
3.12. HzATNP
Recently, Wolf Pérez et al. 2 designed a library of 17 variants of a humanized mAb, HzATNP, and evaluated their solubility properties with a number of in vitro and in silico methods. We find this data set of interest to us for testing and comparing our ESM and ESMab models, since all but one of the 16 mutations include at least one acidic or basic residue (Table 6). We carried out the solubility predictions at pH 7.0 using homology models of both the Fab domain and the full‐length HzATNP antibody and applied different variants of the ESM model, as shown in Table 7. The results are compared to the ammonium sulfate (AMS) precipitation estimates of the relative solubility of the mAb variants. The AMS1/2 solubility data and the atomic coordinates of wild‐type full‐length homology model were kindly provided by Dr Wolf Pérez and coauthors. The experimental AMS1/2 values are used as a proxy for the solubility and correspond to the AMS concentration at which the soluble antibody concentration is 50%. A known problem of ammonium sulfate precipitation is that the data are collected at concentrations corresponding to high ionic strengths and the results do not reflect solubility in water, but the solubility in the salting‐out region. 41 Therefore, we carried out the calculations at ionic strength corresponding to 1 M monovalent salt and with a reduced parameter to 0.025 to account for both the screening effect of the high salt concentration and the increased radius of the model structures, compared to reference RNase Sa.
TABLE 6.
List of HzATNP mAb mutations and the calculated full‐size antibody isoelectric points compared to experimental values
| mAb Variant | Heavy chain | Light chain | pI calc | pI exp | Net charge calc |
|---|---|---|---|---|---|
| WT | – | – | 8.32 | 8 | 7.5 |
| 1 | T68G/Q108E | T5D/V99R | 7.9 | 8.3 | 5.42 |
| 2 | T68G/Q108E | V99R | 8.29 | 8 | 7.37 |
| 3 | T68A/Q108D | V99G | 7.9 | 7.8 | 5.53 |
| 4 | T68A | V99K | 8.64 | 8.1 | 9.22 |
| 5 | T68D | V99R | 8.29 | 7.9 | 7.27 |
| 6 | S70E | V99D | 7.58 | 7.4 | 3.64 |
| 7 | T68G/S70G/Q108L | V99Q | 8.3 | 7.9 | 7.36 |
| 8 | T68D | – | 7.9 | 7.6 | 5.39 |
| 9 | D72Q | – | 8.65 | 8.3 | 9.31 |
| 10 | – | K193V | 7.91 | 7.7 | 5.67 |
| 11 | E16K/D72V | E86V | 9.22 | 8.4 | 15.06 |
| 12 | E16L/K120F | – | 8.3 | 8.1 | 7.41 |
| 13 | E16V/K120V | – | 8.3 | 8.1 | 7.41 |
| 14 | E16F/D72Q | E86F | 9.11 | 7.9 | 13.12 |
| 15 | E16V/K120F | K193Y | 7.91 | 8.3 | 5.74 |
| 16 | E16F/D72F/K120W | K193F | 8.3 | 8.1 | 7.61 |
TABLE 7.
HzATNP results obtained with different variants of ESM models
| Structure model | RTln(S) | Correlation R | ||
|---|---|---|---|---|
| Discovery studio | DI | CamSol | ||
| ESM | Equation (12) | 0.87 | 0.85 | 0.82 |
| Reduced ESM model |
|
0.86 | ||
| ESMab Fab–Fab + Fab–Fc |
|
0.91 | ||
| Full length model | Equation (12) | 0.22 | 0.82 | |
| Reduced ESM full‐length model |
|
0.82 | ||
Note: All calculations are carried out at pH 7.0.
The results in Table 6 show that the calculated pI values of the full‐length mAb variants are quite close to the experimental values. This result suggests that the DS protein ionization method 16 is applicable to large structures such as full‐length antibodies.
The solubility data calculated by different variants of the ESM model are shown in Table 7. ESMab calculations were carried out with precalculated net charge and dipole moment of the Fc fragment.
The results for this data set, shown in Table 7 and Figure S7, demonstrate a non‐negligible improvement of the solubility predictions when obtained by ESMab model. The calculated Pearson's correlation R = .91 outperforms the CamSol and DI results.
3.13. G6 VEGF binding mAb2
While our methods are developed to calculate precipitation solubility, it is interesting to investigate if the solubility predictions are consistent with the protein aggregation propensity in the environment of gene expression cells. For this purpose, we used the results from the study of van der Kant et al. 39 on the effect of a number of “gate‐keeping” mutations on the aggregation and expression titer of the G6 VEGF binding mAb2. We employed both the ESM and ESMab methods using the X‐ray structure of the Fab fragment (PDB ID: 2FJF) and the Fc fragment taken from the IgG1 structure (PDB ID:1HZH).
The calculated ESM solubility data are compared to the relative expression titer in Table 8 and Figure S8. As it is seen in Figure S8, the correlation between the experimental aggregation propensity and the ESM solubility is quite good. The results of the ESMab model show the same correlation with R = .83. Note, that the TANGO and Solubis scores reported by the authors 39 show a correlation of R = .6, and R = .59 respectively.Apart from the mutation L:Ser50Asp, the increased solubility of the mutation variants relative to the wild‐type is predicted correctly.
TABLE 8.
G6 VEGF binding mAb2: Relative titer and calculated ionization and solubility properties at pH = 7.0
| mAb2 variant | Net charge | pI | RTln(S) (kcal/mol) | Relative titer |
|---|---|---|---|---|
| WILD | 6.28 | 9.41 | 0.34 | 1 |
| L:S52R | 7.27 | 9.54 | 2.6 | 2.9 |
| L:S50K | 7.26 | 9.51 | 2.63 | 1.8 |
| L:S50D | 5.34 | 9.25 | −1.29 | 1.4 |
| H:F101P | 6.28 | 9.41 | 0.66 | 4.3 |
| H:V100R | 7.24 | 9.48 | 2.75 | 3.2 |
| L:S50K/H:F101P | 7.28 | 9.51 | 2.98 | 4.5 |
| L:S50K/H:S21R/H:S85R/H:F101P | 9.2 | 9.72 | 5.58 | 6.3 |
| L:S52R/H:F101P | 7.27 | 9.54 | 2.95 | 4.7 |
| L:S52R/H:S21R/H:S85R/H:F101P | 9.22 | 9.75 | 5.79 | 6.2 |
| L:S50K/H:S21R/H:S85R | 9.22 | 9.73 | 5.27 | 5.6 |
3.14. Summary of antibody ESM calculations
The main results of ESM predictions of the effect of mutations on antibody solubility are summarized in Table 9 and compared to the performance of the other methods reported in the referenced studies. The correlation coefficient for CNTO607 is not calculated, because for a number of variants the experimental solubility is reported with its lower limit.
TABLE 9.
Summary of the predictions of antibody solubility changes upon mutations
| Antibody | Input structure/PDB ID | N v | Experimental details | Results | ||||||
|---|---|---|---|---|---|---|---|---|---|---|
| pH | I | Reference | Others | Discovery studio | ||||||
| Method | R | Method | R | CP | ||||||
| HzANTP | Fab homology model | 17 | 7.0 | 1.0 | Wolf Pérez et al. 2019 2 | CamSol | .82 | ESM | .87 |
11/16 69% |
| ESMab | .91 |
13/16 0.81% |
||||||||
| NGF | Fv crystal | 9 | 5.5 | 0.01 | Sormanni et al. 2017 9 | CamSol | .68 | ESM | .89 |
7/8 88% |
| mAb‐J |
Fab crystal 5ANM |
11 | 6.0 | 0.05 | Shan et al. 2018 38 | CamSol | .71 | ESM | .83 |
7/10 70% |
| G6‐VEGF binding mAb2 |
Fab crystal 2FJF |
11 | 7.0 | 0.145 | van der Kant et al. 2017 39 |
TANGO Solubis |
.60 .59 |
ESM | .83 |
9/10 90% |
| CNTO607 |
Fab crystal 3G6A |
8 | 7.2 | 0.1 |
1. Wu et al. 2010 36 2. Bethea et al. 2012 37 |
NA | NA | ESM | NA |
6/7 86% |
Abbreviations: CP, the rate of correctly predicted effects of mutations on protein solubility; I, ionic strength; N v, number of variants; R, Pearson correlation.
The overall prediction accuracy of the ESM method for antibody data set is close to the accuracy of the predictions on the globular protein data set of 17 proteins, showing an average rate of prediction above 80% indicating that the ESM method should be effective in the design of antibodies with improved formulation properties.
4. DISCUSSION
In this study, we proposed and tested two novel in silico approaches for modeling protein solubility: an empirical model, ESM, for fast calculations of protein solubility, and a completely force‐field‐based method, BSM. The latter is based on direct calculations of the binding affinity of a protein molecule to a model crystalline particle, used as proxy of the condensed phase. Both of them were designed with the aim of modeling protein solubility as a continuous function of pH and to predict the solubility changes upon mutations. For these purposes, as a measure of protein solubility, the methods use approximations of the transfer energy, , of the protein from the liquid to condensed phase. In both methods, the transfer energy is calculated as a combination of electrostatic and nonpolar terms. The pH‐dependence of electrostatic contribution is derived from the protein ionization properties calculated by the existing Protein Ionization Discovery Studio component 16 based on the GBIM 22 Generalized Born solvation model, and Iterative Mobile Clustering, IMC, approach. 30
The ability of the methods to predict the pH‐dependence of the solubility was initially validated on the data from the study of Shaw et al. 27 on the solubility of RNase Sa and its 3K and 5K mutants. The results in Figure 5a show that the ESM calculations reproduce sufficiently well the pH‐shape of the solubility of wild‐type and its 3K and 5K mutants. However, as it is seen in Figure 5b, the BSM calculations carried out by the Calculate Mutation Energy (Binding) Discovery Studio protocol, succeeded in an almost perfect fit to the experimental pH‐solubility curves of RNase Sa and its mutants without any additional parameterization, that is, using exactly the same parameters for the free energy function as in our previous works on protein–protein binding affinity 18 and protein stability. 17 It is worth noting that the BSM method predicts not only the pH shape, but the relative vertical shift of RTln(S) curves. Our analysis shows that to some extent the latter is due to the decreased side‐chain entropy in the crystalline environment. For now, an entropy term is not included in the ESM model, but the BSM results imply that adding an entropy term could improve the ESM scoring function.
The ESM and BSM methods were also tested on the solubility data from Trevino et al. 28 for 21 single mutation variants of RNase Sa surface residues. Interestingly, although the experimental solubility data are obtained at a relatively high concentration of the 1.1 M ammonium sulfate, both ESM and BSM methods achieved relatively high accuracy, correctly predicting the effect of 19 from 21 mutations (90%) with a Pearson correlation coefficient R about .9.
In the interesting case of dramatic solubility change after the Thr1Lys/Phe13Tyr/I33Lys (KYK) mutation of the plant protein crambin, 31 both ESM and BSM methods predict a 50–100 times solubility increase, which is consistent with the fact that the KYK mutation transforms this plant protein from completely insoluble to soluble.
The results achieved with BSM method are of certain theoretical interest. To the best of our knowledge, it is the first example of a structure‐based model where the protein solubility is derived from atomistic calculations of protein binding affinity to its crystal lattice.
Unfortunately, because of technical problems, the more robust BSM approach is for now only applicable to small and medium size proteins of up to 150–200 residues and the calculations are considerably slower than using the empirical model.
Besides RNase Sa, we tested the ability of ESM method to predict solubility as a function of pH, using the pH‐dependent solubility of zinc‐insulin. 33 As shown in Figure 12, the ESM calculations achieve a good fit to the experimental data, using the same parameters as those in the RNase Sa calculations. This result suggests that using point molecular charge and dipole to approximate the intermolecular electrostatic interactions in ESM method is reasonable.
While the theoretical basis of the ESM model represents the behavior of protein molecules in precipitation experiments, it is interesting to assess the ability of the method in predicting the solubility changes upon mutations measured by different experimental techniques and following different mechanisms of aggregation, for example, amyloid formation or amorphous aggregation. For this purpose, we used the ESM method to evaluate the effect of 122 mutations taken from a data set assembled by Tian and co‐authors 35 where the effects of mutation are reported as increasing or decreasing of solubility. The comparison of ESM results to the experimental data, shown in Table 2 is encouraging, where the ESM method correctly predicts 78% of all cases. On this data set, we also tested an extension of the ESM scoring function, SF2, taking into account the protein stability changes upon mutation. The folding energy differences are calculated by the Calculate Mutation Energy (Stability) Discovery Studio protocol along with the generation of the mutant structures. At the cost of a couple of false negatives, the use of the extended SF2 scoring function improved the general accuracy from 78% to 88% correct predictions. The latter is consistent with the view that the mutations which cause partial or full protein unfolding could lead to a decrease of solubility, for example, by exposing internal hydrophobic residues.
The high interest in improving antibody developability and formulation properties inspired us to test the ability of our methods in predicting antibody solubility changes while introducing mutations to optimize biological function. For this purpose, we used the solubility data of the mutants from five different monoclonal antibodies. The experimental solubilities are measured for full‐length antibodies for all five data sets using different techniques, such as precipitation in PEG (NGF antibody and Mab‐J), in ammonium sulfate (HzATNP), or measuring the relative titer (VEGF binding G6 antibody). Our predictions are carried out using Fab domain structures when possible, except NGF for which only the Fv sequence was given in the original experimental paper. The ESM results show a good accuracy with correctly predicted solubility changes in the range of 80% (Mab‐J) to 90% (G6). Apart from CNTO607, the Pearson correlation coefficient R varies between .83 and .89 and outperforms the reported correlation obtained by other methods such as CamSol, TANGO, and Solubis as summarized in Table 7. In all data sets, except NGF, the ESM method also shows a better correlation between ESM and experimental values, than the developability index, also calculated by the Calculate Protein Formulation Properties Discovery Studio protocol. We believe it is because the ESM model takes into account more interactions related to solubility, than DI scoring function, such as the pH‐dependent solvation term and dipole–dipole interactions.
The CNTO607 case was of special interest because the X‐ray structure of the Fab domain and the mutation experiments suggest that the low solubility of this antibody is caused by specific bivalent interactions 36 , 37 between the Fab fragments, that could lead to aggregation. To investigate this feature, besides the ESM calculations, we calculated the protein–protein binding energy between the molecules in the Fab dimer. The results, obtained by employing the Calculate Mutation Energy (Binding) Discovery Studio protocol are consistent with the highly improved solubility of 103FHW105–103AAA105 triple mutant and K210T/K215T double mutant. We also performed alanine scanning of the Fab–Fab binding interface. Besides identifying the impact of residues included in the experimental mutations, the alanine scanning found some other mutations that could improve the CNTO607 solubility, such as L:F31A and H:Y53A.
In an attempt to improve the predictions, we tested an extension of the ESM method, ESMab, applicable to antibody by adding terms approximating the Fab–Fc charge–charge and dipole–dipole interactions to the ESM scoring function. For two of the three tested sets, ESMab accuracy is the same as the ESM accuracy, but for the data set with the largest number of mutants (HzATNP) the correlation improves from R = .87 to R = .91, and the correctly predicted cases from 69% to 81%. While somewhat promising, more validation of the ESMab model with additional data sets is desirable.
Both of our methods, ESM and BSM are applicable to globular proteins and as shown above, have been validated based on the mutations of 17 globular protein data sets, and five monoclonal antibodies. In this study, we tested the ESM model with Fab domain and full‐length mAb. In theory, using the full‐length mAb in our ESM model will result in poor prediction, given the high flexibility of the mAb hinge region which leads to the high variability of the orientation between the two Fab and Fc domains. Indeed, the solubilities predicted based on the modeled full‐length HzATNP structure and its 16 mutants showed poor correlation to experimental data (results available upon request). It is reasonable to assume that the Fab–Fab, Fab–Fc, and Fc–Fc interactions represent the intermolecular interaction of the full‐length mAb in crystal and in solution. Given that the Fc domain is kept constant in most antibody engineering projects, considering the Fab–Fab interaction as in the ESM model and in addition, the Fab–Fc interactions in the ESMab model are reasonable approximations of the mAb intermolecular interaction for the prediction of mAb solubility. The study of the five antibody data sets, where 4 out of 5 data sets are calculated using the Fab domain validated our approach.
The ESM method is implemented in the existing Calculate Protein Formulation Properties Discovery Studio protocol, along with calculations of the developability index, 3 DI and viscosity scores. 7 Although our structure‐based approach requires protein 3D structures as input to the calculation, the results are more accurate compared to sequence‐only approaches, such as CamSol. 8 For mAbs, the structure can be modeled using the fully automated Antibody Modeling Cascade Discovery Studio protocol, and the accuracy of the model is well suited to the study of formulation properties as validated by the current work. When the structure of the original protein variant is known, either from experiment or from a homology model, the structures of the mutants can be modeled using Calculate Mutation Energy (Stability) Discovery Studio protocol automatically and the relative folding energy can be used as a filter to rank the solubility of the mutants and rule out the mutants with significant decrease of stability. The ESM method is a general approach for the prediction of solubility for globular proteins and the results are validated based on a large number of different globular proteins as well as five sets of full‐length mAbs. It is suitable for studying the solubility of different antibody formats, such as scFv, VHH single domain antibody, mAb, and so forth. The calculation is fast and can screen a large number of design candidates. We intend to integrate our formulation property calculation, including protein solubility, into our automated multi‐objective optimization for the purposes of the antibody design.
5. MATERIALS AND METHODS
The BIOVIA Discovery Studio implementation of the ESM model uses a number of CHARMM scripts, C++, and Perl program modules wrapped in a single BIOVIA Calculate Protein Formulation Properties Discovery Studio protocol. For data set with known wild‐type PDB structures, the input structures are prepared by the Prepare Protein Discovery Studio protocol, using the ChiRotor 42 algorithm to generate the atomic coordinates of any incomplete or missing side chains, and the LOOPER algorithm 43 for any missing structure fragments and mutation variants with insertions. For the antibody data set, HzATNP, without known experimental structure, the Antibody Modeling Cascade protocol in BIOVIA Discovery Studio is used to predict the Fab domain of the wild‐type.
In ESM calculations the structures of the mutants are generated by the Calculate Mutation Energy (Stability) Discovery Studio protocol in pH‐dependent mode with all parameters set to default values. The same protocol is used to evaluate the folding free energy differences upon mutations.
BSM calculations are carried out in pH‐dependent mode of the Calculate Mutation Energy (Binding) Discovery Studio protocol. The structure of the mutants are generated simultaneously for all molecules in the model crystalline particles, along with the calculations of the binding energy.
The pH‐dependent electrostatic properties in both the ESM and BSM implementations are calculated by the new version of the previously reported Calculate Protein Ionization component, 16 extended with calculations of the dipole moments. All calculations of electrostatic terms are carried out using the default value of 10 for the intramolecular dielectric constants. In ESM calculations the solvent dielectric constant set to 80 for the liquid phase and 55 for the condensed phase. The electrostatic calculations are based on GBIM 22 CHARMM 21 version of Generalized Born model.
The calculations of the pH‐dependent ionization properties are based on the Bashford and Karplus 23 , 24 model, and the IMC (Iterative Mobile Clustering) approach 30 to the combinatorial problem in systems with multiple sites of titration. The IMC approach allows the treatment of protein molecules with several 1,000 amino acid residues.
The methods are implemented for both CHARMm and CHARMm Polar H (hydrogen) Momany and Rone 44 force fields, but the results reported in this study were obtained using CHARMm Polar H.
AUTHOR CONTRIBUTIONS
Velin Z. Spassov: Conceptualization (lead); formal analysis (lead); methodology (lead); software (lead); validation (lead); writing – original draft (lead). Helen Kemmish: Software (supporting); writing – review and editing (supporting). Lisa Yan: Formal analysis (supporting); methodology (supporting); project administration (lead); writing – original draft (supporting).
Supporting information
Appendix S1: Supporting Information
Spassov VZ, Kemmish H, Yan L. Two physics‐based models for pH‐dependent calculations of protein solubility. Protein Science. 2022;31(5):e4299. 10.1002/pro.4299
Review Editor: Carol Post
REFERENCES
- 1. Jarasch A, Koll H, Regula JT, Bader M, Papadimitriou A, Kettenberger H. Developability assessment during the selection of novel therapeutic antibodies. J Pharm Sci. 2015;104:1885–1898. [DOI] [PubMed] [Google Scholar]
- 2. Wolf Pérez A‐M, Sormanni P, Andersen JS, et al. In vitro and in silico assessment of the developability of a designed monoclonal antibody library. MAbs. 2019;11:388–400. [DOI] [PMC free article] [PubMed] [Google Scholar]
- 3. Chennamsetty N, Voynov V, Kayser V, Helk B, Trout B. Design of therapeutic proteins with enhanced stability. Proc Natl Acad Sci USA. 2009;106:11937–11942. [DOI] [PMC free article] [PubMed] [Google Scholar]
- 4. Chennamsetty N, Helk B, Voynov V, Kayser V, Trout B. Aggregation‐prone motifs in human immunoglobulin G. J Mol Biol. 2009;391:404–413. [DOI] [PubMed] [Google Scholar]
- 5. Chennamsetty N, Voynov V, Kayser V, Helk B, Trout B. Prediction of aggregation prone regions of therapeutic proteins. J Phys Chem B. 2010;114:6614–6624. [DOI] [PubMed] [Google Scholar]
- 6. Agrawal NJ, Kumar S, Wang X, Helk B, Singh SK, Trout BL. Aggregation in protein‐based biotherapeutics: Computational studies and tools to identify aggregation‐prone regions. J Pharm Sci. 2011;100:5081–5095. [DOI] [PubMed] [Google Scholar]
- 7. Agrawal NJ, Helk B, Kumar S, et al. Computational tool for the early screening of monoclonal antibodies for their viscosities. MAbs. 2016;8:43–48. [DOI] [PMC free article] [PubMed] [Google Scholar]
- 8. Sormanni P, Aprile FA, Vendruscolo M. The CamSol method of rational design of protein mutants with enhanced solubility. J Mol Biol. 2015;427:478–490. [DOI] [PubMed] [Google Scholar]
- 9. Sormanni P, Amery L, Ekizoglou S, Vendruscolo M, Popovic B. Rapid and accurate in silico solubility screening of a monoclonal antibody library. Sci Rep. 2017;7:820. [DOI] [PMC free article] [PubMed] [Google Scholar]
- 10. Tjong H, Zhou H‐X. Prediction of protein solubility from calculation of transfer free energy. Biophys J. 2008;95:2601–2609. [DOI] [PMC free article] [PubMed] [Google Scholar]
- 11. Vihinen M. Solubility of proteins. ADMET & DMPK. 2020;8:391–399. [DOI] [PMC free article] [PubMed] [Google Scholar]
- 12. Tanford C. Physical chemistry of macromolecules. 4, New York, NY: John Wiley & Sons, Inc., 1966. [Google Scholar]
- 13. Long WF, Labute P. Calibrative approaches to protein solubility modeling of a mutant series using physicochemical descriptors. J Comput Aided Mol Des. 2010;24:907–916. [DOI] [PMC free article] [PubMed] [Google Scholar]
- 14. BIOVIA . Discovery Studio Modeling Environment, Release 2021. San Diego, CA: BIOVIA Dassault Systemes, 2021. Available at: https://www.3ds.com/products-services/biovia/products/molecular-modeling-simulation/biovia-discovery-studio/. [Google Scholar]
- 15. Takano K, Funahashi J, Yutani K. The stability and folding process of amyloidogenic mutant human lysozymes. Eur J Biochem. 2001;268:155–159. [DOI] [PubMed] [Google Scholar]
- 16. Spassov VZ, Yan L. A fast and accurate computational approach to protein ionization. Protein Sci. 2008;17:1955–1970. [DOI] [PMC free article] [PubMed] [Google Scholar]
- 17. Spassov VZ, Yan L. A pH‐dependent computational approach to the effect of mutations on protein stability. J Comput Chem. 2016;37:2573–2587. [DOI] [PubMed] [Google Scholar]
- 18. Spassov VZ, Yan L. pH‐selective mutagenesis of protein–protein interfaces: In silico design of therapeutic antibodies with prolonged half‐life. Proteins. 2013;81:704–714. [DOI] [PMC free article] [PubMed] [Google Scholar]
- 19. Massova I, Kollman PA. Computational alanine scanning to probe protein‐protein interactions: A novel approach to evaluate binding free energies. J Am Chem Soc. 1999;121:8133–8143. [Google Scholar]
- 20. Almlöf M, Aqvist J, Smalås AO, Brandsdal BO. Probing the effect of point mutations at protein‐protein interfaces with free energy calculations. Biophys J. 2006;90:433–442. [DOI] [PMC free article] [PubMed] [Google Scholar]
- 21. Brooks BR, Brooks CL III, Mackerell DA Jr, et al. CHARMM: The biomolecular simulation program. J Comput Chem. 2009;30:1545–1614. [DOI] [PMC free article] [PubMed] [Google Scholar]
- 22. Spassov VZ, Yan L, Szálma S. Introducing an implicit membrane in generalized born/solvent accessibility continuum solvent models. J Phys Chem B. 2002;106:8726–8738. [Google Scholar]
- 23. Bashford D, Karplus M. Multiple‐site titration curves of proteins: An analysis of exact and approximate methods for their calculations. J Phys Chem. 1991;95:9556–9561. [Google Scholar]
- 24. Bashford D. Macroscopic electrostatic models for protonation states in proteins. Front Biosci. 2004;9:1082–1099. [DOI] [PubMed] [Google Scholar]
- 25. Schellman JA. Macromolecular binding. Biopolymers. 1975;14:999–1018. [Google Scholar]
- 26. Yang A‐S, Honig B. On the pH dependence of protein stability. J Mol Biol. 1993;231:459–474. [DOI] [PubMed] [Google Scholar]
- 27. Shaw KL, Grimsley GD, Yakovlev GI, Makarov AA, Pace CN. The effect of net charge on the solubility, activity, and stability of ribonuclease Sa. Protein Sci. 2001;10:1206–1215. [DOI] [PMC free article] [PubMed] [Google Scholar]
- 28. Trevino SR, Scholtz JM, Pace CN. Amino acid contribution to protein solubility: Asp, Glu, and Ser contribute more favorably than the other hydrophilic amino acids in RNase Sa. J Mol Biol. 2007;366:449–460. [DOI] [PMC free article] [PubMed] [Google Scholar]
- 29. Chari R, Singh SN, Yadav S, Brems DN, Kalonia DS. Determination of the dipole moments of RNase Sa wild type and a basic mutant. Proteins. 2012;80:1041–1052. [DOI] [PubMed] [Google Scholar]
- 30. Spassov VZ, Bashford D. Multiple‐site ligand binding to flexible macromolecules: Separation of global and local conformational change and an iterative mobile clustering approach. J Comput Chem. 1999;20:1091–1111. [Google Scholar]
- 31. Kang S‐J, Lim J‐S, Lee B‐J, Ahn H‐C. Solution structure of water‐soluble mutant of crambin and implication for protein solubility. Bull Korean Chem Soc. 2011;32:1640–1644. [Google Scholar]
- 32. Fredericq E, Neurath H. The interaction of insulin with thiocyanate and other anions. The minimum molecular weight of insulin. J Am Chem Soc. 1950;72:2684–2691. [Google Scholar]
- 33. Desbuquois B, Aurbach GD. Effects of iodination on thedistribution of peptide hormones in aqueous two‐phase polymer systems. Biochem J. 1974;143:83–91. [DOI] [PMC free article] [PubMed] [Google Scholar]
- 34. Fischel‐Ghodsian F, Brown L, Mathiowitz E, Brandenburg D, Langer R. Enzymatically controlled drug delivery. Proc Natl Acad Sci USA. 1988;85:2403–2406. [DOI] [PMC free article] [PubMed] [Google Scholar]
- 35. Tian Y, Deutsch C, Krishnamoorthy B. Scoring function to predict solubility mutagenesis. Algorithms Mol Biol. 2010;5:33. [DOI] [PMC free article] [PubMed] [Google Scholar]
- 36. Wu SJ, Luo J, O'Neil KT, et al. Structure‐based engineering of a monoclonal antibody for improved solubility. Prot Eng Des Sel. 2010;23:643–651. [DOI] [PubMed] [Google Scholar]
- 37. Bethea D, Wu S‐J, Luo J, et al. Mechanisms of self‐association of a human monoclonal antibody CNTO607. Prot Eng Des Sel. 2012;25:531–537. [DOI] [PubMed] [Google Scholar]
- 38. Shan L, Mody N, Sormanni P, Rosenthal KL, Damschroder MM, Esfandiary R. Developability assessment of engineered monoclonal antibody. Variants with a complex self‐association behavior using complementary analytical and in silico tools. Mol Pharm. 2018;15:5697–5710. [DOI] [PubMed] [Google Scholar]
- 39. van der Kant R, Karow‐Zwick AR, Durme JV, et al. Prediction and reduction of the aggregation of monoclonal antibodies. J Mol Biol. 2017;429:1244–1261. [DOI] [PMC free article] [PubMed] [Google Scholar]
- 40. Teplyakov A, Obmolova G, Wu S‐J, et al. Epitope mapping of anti‐interleukin‐13 neutralizing antibody CNTO607. J Mol Biol. 2009;389:115–123. [DOI] [PubMed] [Google Scholar]
- 41. Kramer RM, Shende VR, Motl N, Pace CN, Scholtz JM. Toward a molecular understanding of protein solubility: Increased negative surface charge correlates with increased solubility. Biophys J. 2012;102:1907–1915. [DOI] [PMC free article] [PubMed] [Google Scholar]
- 42. Spassov VZ, Yan L, Flook PK. The dominant role of side‐chain backbone interactions in structural realization of amino acid code. ChiRotor: a side‐chain prediction algorithm based on side‐chain backbone interactions. Protein Sci. 2007;16:494–506. [DOI] [PMC free article] [PubMed] [Google Scholar]
- 43. Spassov VZ, Flook PK, Yan L. LOOPER: a molecular mechanics‐based algorithm for protein loop prediction. Protein Eng. 2008;21:91–100. [DOI] [PubMed] [Google Scholar]
- 44. Momany F, Rone R. Validation of the general purpose QUANTA 3.2/CHARMm force field. J Comput Chem. 1992;13:888–900. [Google Scholar]
- 45. Pace CN. Protein conformations and their stability. J Am Chem Soc. 1983;60:970–975. [Google Scholar]
Associated Data
This section collects any data citations, data availability statements, or supplementary materials included in this article.
Supplementary Materials
Appendix S1: Supporting Information


