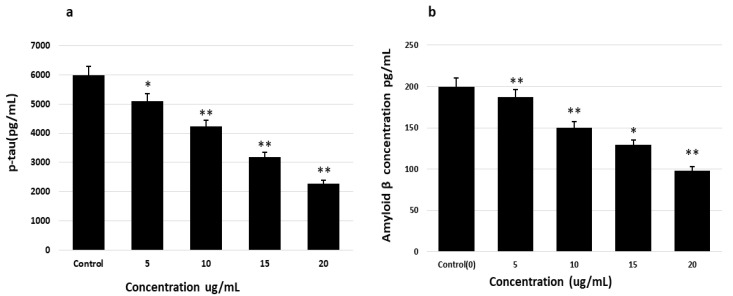
Figure 7.
Reduction in the levels of Aβ peptides and p-tau after treatment with theasaponin (due to enhancement or reduction in the activities of various kinases and phosphatases), determined by ELISA. (a) Aβ quantification with ELISA after the treatment of cells with different concentrations of theasaponin E1. (b) p-tau quantification with ELISA after the treatment of cells with different concentrations of theasaponin E1. Data were analyzed using one-way ANOVA (n = 3) and expressed as mean ± SEM. Data are statistically significant at p < 0.05 (* p < 0.05; ** p < 0.01 to the control group).

