

Abstract
Treatment resistant (TR) psychosis is considered to be a significant cause of disability and functional impairment. Numerous efforts have been made to identify the clinical predictors of TR. However, the exploration of molecular and biological markers is still at an early stage. To understand the TR condition and identify potential molecular and biological markers, we analyzed demographic information, clinical data, structural brain imaging data, and molecular brain imaging data in 7 Tesla magnetic resonance spectroscopy, from a first episode psychosis cohort that includes 136 patients. Age, gender, race, smoking status, duration of illness, and antipsychotic dosages were controlled in the analyses. We found that TR patients had a younger age at onset, more hospitalizations, more severe negative symptoms, a reduction in the volumes of the hippocampus (HP) and superior frontal gyrus (SFG), and a reduction in glutathione (GSH) levels in the anterior cingulate cortex (ACC), when compared to non-TR patients. The combination of multiple markers provided a better classification between TR and non-TR patients compared to any individual marker. Our study shows that ACC GSH, HP and SFG volumes, and age at onset could potentially be biomarkers for TR diagnosis, while hospitalization and negative symptoms could be used to evaluate the progression of the disease. Multimodal cohorts are essential in obtaining a comprehensive understanding of brain disorders.
Introduction
Psychotic disorder is one of the most debilitating mental conditions, and its disease trajectory is heterogenous [1]. A significant proportion of patients with psychosis continue to have symptoms and poor outcomes despite treatment [2–4]. Clozapine is the only evidence-based medicine for treatment resistant (TR) cases [2], a possible subset of schizophrenia. Clozapine can provide a significant benefit to a substantial portion of TR patients [5]. Nevertheless, due to severe adverse effects [2, 6], clozapine use is still limited in many countries [2]. Paradoxically, it is also known that delayed initiation of clozapine is related to poor response to this medication in TR patients [7, 8]. Thus, identification of patients that are TR, or have susceptibility to TR, at the first clinical visit is very important in order to potentially start clozapine as early as possible. To achieve this goal, it is imperative to establish predictive markers for TR.
In the past decades, multiple groups have put forth major efforts in identifying markers associated with TR. In these studies, the criteria for TR are relatively consistent but also vary depending on the goal of the study. The core criteria for TR patients includes unsuccessful use of two or more non-clozapine antipsychotics and/or the use of clozapine in their past history [2–4, 9, 10]. Thus far, these studies that compare between TR patients and non-TR patients have mainly focused on clinical and demographic markers, and reported that TR patients tend to have a longer duration of untreated psychosis (DUP), more severe negative symptoms, younger age of onset, and poor pre-morbid functioning [4, 11–13]. In addition, some studies have also pointed out severer cognitive deficits in TR patients compared with non-TR patients [14, 15].
Meanwhile, some studies have assessed treatment response during a short interval (for example, 12 weeks) to test whether candidate biological markers at both molecular and anatomy/circuitry levels are associated with treatment response [16–26]. Through such a candidate target approach, increased level of the sum of glutamate and glutamine (Glx) in the anterior cingulate cortex (ACC) estimated through 3-Tesla magnetic resonance spectroscopy (3T-MRS), was reportedly associated with persistent psychotic symptoms despite antipsychotic treatment [18–20]. Whereas, elevated striatal dopamine synthesis capacity was observed in treatment responders measured by positron emission tomography (PET) [21–23]. One group hypothesized that patients with higher glutathione (GSH) levels in the ACC would demonstrate a shorter time to treatment response, and this hypothesis was proven through a 7T-MRS study [24]. Furthermore, other studies have indicated cortical folding defects, white matter regional vulnerability [25], lower cortisol awakening response, and higher interleukin (IL)-6 and IFN-γ for poor treatment response [16, 17].
In the present study, we used a first episode psychosis (FEP) cohort with multimodal datasets, including demographic and clinical information as well as structural and molecular brain imaging data [27–31]. Olfactory functions were also evaluated in this study, since olfactory deficits frequently accompany FEP and may have a predictive value for disease severity and poor prognosis [28, 32, 33]. The goal of this study is to identify markers that can differentiate TR from non-TR patients, in which TR is defined based on medication history [2–4, 9, 11–15], rather than treatment response [16–24]. By taking advantage of multimodal datasets, rather than single layer data, we aimed to obtain a comprehensive landscape associated with TR in psychosis.
Subjects and Methods
Study participants
This study was approved by the Johns Hopkins Medicine Institutional Review Board. All study participants provided written informed consent. Initially, 138 patients were recruited from within and outside of the Johns Hopkins Hospital. The study psychiatrists did not make treatment decisions regarding medications. The inclusion criteria for all study participants were: 1) between 13 and 35 years old; 2) no history of traumatic brain injury, cancer, abnormal bleeding, viral infection, neurologic disorder, or mental retardation; 3) no drug or alcohol abuse (not including cannabis or synthetic cannabinoid receptor agonists) in the past three years; 4) no illicit drug use in the past two months. The inclusion criterion for patients was: at the first visit (baseline), patients must be within 24 months of the onset of psychotic manifestations as assessed by study team psychiatrists using the Structured Clinical Interview for DSM-IV (SCID) and collateral information from available medical records. In the present study, we refer to these patients as FEP patients to differentiate this cohort from recent-onset psychosis cohorts in which patients with a longer duration of illness (e.g., with onset within 5 years) are usually included [34, 35]. We acknowledge that a 2-year-window is a relaxed definition of FEP. Nevertheless, this definition has been used in many published studies and meta-data analyses [36–39]. The majority of patients, except 6 patients, were already medicated at their first (baseline) visit. The 6 medication-naive patients at the baseline started medication during the follow-up period. Five patients were initially diagnosed as substance-induced psychotic disorder because of the use of cannabis or synthetic cannabinoid receptor agonists. However, 2 out of 5 have been later diagnosed as bipolar disorder with psychotic features, and 1 out of 5 as schizophrenia. The rest of two subjects were excluded from downstream analysis. Taken together, the number of patients used for the entire analyses was 136: schizophrenia (n=73), schizoaffective disorder (n = 14), schizophreniform disorder (n = 3), bipolar disorder with psychotic features (n = 29), major depressive disorder with psychotic features (n = 9), brief psychotic disorder (n=2), not otherwise specified psychotic disorder (n=6). Healthy controls (n=115) were also recruited but not used in the present study. After the enrollment (first visit), the study participants were followed up to 4 years.
Symptomatic and neurocognitive assessment
We used the Scale for the Assessment of Negative Symptoms (SANS) and the Scale for the Assessment of Positive Symptoms (SAPS) to evaluate the presence and severity of negative and positive symptoms respectively [40]. The global and total scores collected at the first (baseline) visit were used in the data analysis. In addition, we used a comprehensive neuropsychological battery we previously developed and have used in multiple publications [27, 29, 41–43]. In brief, we obtained cognitive scores scaled in normally distributed standardized units that covered 6 domains: 1) processing speed (calculated from the combined scores of the Grooved Pegboard test and the Salthouse test); 2) attention/working memory (Digit Span and Brief Attention Memory test); 3) verbal learning and memory (Hopkins Verbal Learning test); 4) visual learning and memory (Brief Visuospatial Memory test); 5) ideational fluency (Ideational Fluency assessment for Word Fluency and Acceptable Designs); and 6) executive functioning (Modified Wisconsin Card Sorting test). These 6 cognitive scores and their average (referred to as the composite score) obtained at the first (baseline) visit were used in the analysis.
Smell Test
The olfactory functioning of study participants was tested. Specifically, subjects were first administered the Sniffin’ Sticks Odor Identification and Discrimination test to evaluate the ability to identify and discriminate 16 different types of odors. Next, participants were administered 2 odor detection threshold tasks utilizing lyral and citralva as active odorants in a counterbalanced order. The task followed a single reversing staircase, forced-choice format in which individuals were presented 2 vials, one with mineral oil and one containing the active odorant diluted in mineral oil. A total detection threshold score was created that reflected the weakest odor concentration reliably identified as stronger than mineral oil. The detailed procedures were described in our previous publications [28, 31]. In the present study, the data obtained at the study participant’s first visit (baseline) was used for analysis.
7T-MRS
Participants were scanned using a 7T scanner (Philips ‘Achieva’, Best, The Netherlands) equipped with a 32-channel head coil (Nova Medical, Wilmington, MA). The ‘LCModel’ software package (Version 6.3–0D) was used to analyze the spectra. Metabolite levels were calculated relative to the water or tCr (total creatine) signal from the same voxel and expressed in institutional units (IU, approximately millimolar) [44]. The detailed protocol for acquiring and processing MRS scans has been described previously[27]. In the present study, we used the data obtained at the first visit (baseline) for glutamate (Glu), gamma-aminobutyric acid (GABA), N-acteylaspartate (NAA), and glutathione (GSH) levels in 5 brain regions: the anterior cingulate cortex (ACC), semiovale (CSO), dorsolateral prefrontal cortex (DLPFC), centrum orbitofrontal cortex (OFR), and thalamus (Thal).
3T structural brain imaging: brain volume
T1 high-resolution-weighted images (T1-WI) were obtained from a 3T scanner with the following parameters: sagittal orientation, original matrix 170×170, 256 slices, voxel size 1×1×1.2 mm, TR/TE 6700/3.1 ms. The images were automatically segmented and post-processed through the MRICloud [45] (www.MRICloud.org), as described previously [29]. Briefly, in MRICloud the images were processed through the following steps: 1) orientation and homogeneity correction; 2) two-level brain segmentation (skull-stripping, then whole brain); 3) image mapping based on a sequence of linear, non-linear algorithms, and Large Deformation Diffeomorphic Mapping (LDDMM); 4) multi-atlas labeling fusion (MALF), adjusted by PICSL [46]. In this study, we used the multi-atlas set “Adult22_50yrs_26atlases_M2_V9B” that matched with the demography of our population, through which we collected and analyzed the volumes of 136 brain regions, as defined in the parcellation “level 4” which covered the whole brain (Table S1) [47].
TR patients
Patients who had previously taken more than two non-clozapine antipsychotics and/or were currently taking clozapine were classified as TR. Specifically, we collected medication records and clinical interview notes from the patients’ attending physicians prior to the baseline visit and during the follow-up period (up-to-4-years). Experienced psychiatrists (N.C. and L.L.) carefully reviewed these records to determine how many antipsychotics each patient had tried because of poor response to a medication. If a patient switched antipsychotics due to adverse effects, non-adherence, or other reasons that were independent of his/her response to the medication, the individual was not considered TR.
Among 136 patients for the entire analyses, 32 satisfied the TR criteria. Eighteen had been TR before their first (baseline) visit and fourteen patients became TR after their first (baseline) visit. The length of follow-up varied among patients. The maximal length of follow-up from disease onset in TR patients was 39 months. In the non-TR group, 69 patients were followed longer than 39 months after disease onset. Some of the remaining 35 patients, though we expect the number to be minor, may turn out to be TR once they are followed longer than 39 months after disease onset. Given this potential caveat, we conducted the analysis using datasets from 32 TR patients and 69 non-TR patients who were followed for at least 39 months after disease onset.
In addition, we performed an analysis for 32 TR patients and 104 non-TR patients (all non-TR patients) and disclosed the results in the supplementary document.
Statistical analysis
R 3.5.1 was used to perform statistical analysis. Group comparisons of demographic and clinical data were calculated using Welch’s t-test for continuous variables, and a Chi-square test for categorical data. General linear regression with age, gender, race, smoking status, chlorpromazine (CPZ) equivalent dose estimated by the Defined Daily Doses (DDDs) method [48], and duration of illness (DOI) at baseline as covariates was performed when global and total SANS/SAPS, neuropsychological data, olfactory functions, brain volumes, and metabolite levels from 7T MRS were compared between TR patients and non-TR patients. When we assessed neuropsychological data, we also included education as a covariate due to its influence on a subject’s capabilities in interpretation and execution of neuropsychological tests [42]. In the assessment of brain volumes, we also considered handedness in addition to the basic set of confounding factors described above to account for the effects of laterality on brain volumes. A permutation test was performed to evaluate statistical significance. The Benjamini-Hochberg (BH) procedure was used for multiple comparison correction. P values corrected with the BH procedure are presented as q values. The analyte was considered significant if its q value was smaller than 0.05. Finally, we constructed general linear regression models to evaluate the classification performance of individual markers as well as the combination of multiple markers. Leave-one-out cross-validation receiver operating characteristic (ROC) curve and area under the curve (AUC) were used to evaluate performance. The 95% confidence interval of AUC was calculated. Additionally, Akaike information criterion (AIC) was calculated to compare models.
Results
Characteristics of the cohort
In the present study, we examined 136 FEP patients, including 32 TR and 104 non-TR patients, but did not use 115 healthy controls for the analysis (see Method section). Using baseline data collected at the first visit, we found that TR patients are younger [mean (TR) = 20.53; mean (non-TR) = 22.78; p value = 4.96E-03], have fewer years of education [mean (TR) = 12.13; mean (non-TR) = 13.26; p value = 0.03], and are less employed (TR = 29.03%; non-TR = 53.13%; p value = 0.03) than non-TR patients (excluding those with short follow-ups) (Table S2A). There were no significant differences in gender, race, psychiatric family history, or smoking status. The analysis between TR and all non-TR patients, including those with short follow-ups (see Method section for more detail), led to the consistent conclusion with significant differences in age, education, and employment (Table S2B).
Analysis of clinical data between TR and non-TR patients
Next, we compared the clinical characteristics between TR and non-TR patients (excluding those with short follow-ups). As summarized in Table 1A, TR patients were found to be younger at disease onset and have more hospitalizations. DOI and antipsychotic dose was not significantly different between TR and non-TR patients. Next, we compared the SANS/SAPS global and total test scores (Table 1B). TR patients had a significantly higher SANS total score and global score in avolition (q-value < 0.05), while no significant differences in either the SAPS total or global scores were observed between TR and non-TR patients. Furthermore, we compared the neuropsychological composite score and sub-domain scores and didn’t observe any significant differences between TR and non-TR patients (Table 1C). Similar findings were obtained via comparisons between TR and all non-TR patients (including those with short follow-ups) (Table S3A, B, C).
Table 1. Comparison of clinical data between treatment resistant (TR) and non-TR patients.
Clinical data were compared between TR (n=32) and non-TR (n=69) patients (non-TR patients with short follow-ups were excluded). Significant results (q-value < 0.05) are highlighted in bold with a gray shadow. Abbreviations: SANS, the scale for the assessment of negative symptoms; SAPS, the scale for the assessment of positive symptoms; and PFTD, positive formal thought disorder.
| A) Clinical variables | ||||
|---|---|---|---|---|
| Characteristics | mean (TR) | mean (non-TR) | p-value | q-value |
| CPZ dose (mg) | 385.88 | 280.95 | 0.06 | 0.08 |
| Age of onset (years) | 19.28 | 21.80 | 1.37E-02 | 0.03 |
| No. of Hospitalizations | 2.69 | 1.66 | 7.19E-03 | 0.03 |
| Duration of illness (months) | 15.82 | 14.15 | 0.38 | 0.38 |
| B) SANS/SAPS | ||||
| Characteristics | mean (TR) | mean (non-TR) | p-value | q-value |
| SAPS | ||||
| Total score | 4.31 | 3.46 | 0.48 | 0.86 |
| Hallucination | 1.83 | 1.22 | 0.43 | 0.86 |
| Delusion | 1.66 | 1.47 | 0.58 | 0.86 |
| Bizarre behavior | 0.45 | 0.32 | 0.86 | 0.86 |
| PFTD | 0.38 | 0.45 | 0.85 | 0.86 |
| SANS | ||||
| Total score | 10.34 | 6.81 | 0.02 | 4.80E-02 |
| Affective flattening | 1.97 | 1.34 | 0.15 | 0.15 |
| Alogia | 1.83 | 1.03 | 0.10 | 0.15 |
| Avolition | 2.38 | 1.35 | 2.98E-03 | 0.02 |
| Anhedonia | 2.45 | 1.76 | 0.12 | 0.15 |
| Attention | 1.79 | 1.32 | 0.13 | 0.15 |
| C) Neuropsychological test | ||||
| Characteristics | mean (TR) | mean (non-TR) | p-value | q-value |
| Composite score | 95.77 | 96.39 | 0.54 | 0.94 |
| Processing speed | 85.97 | 86.48 | 0.51 | 0.94 |
| Attention memory | 87.11 | 86.03 | 0.15 | 0.94 |
| Verbal learning and memory | 86.67 | 87.10 | 0.94 | 0.94 |
| Visual learning and memory | 84.93 | 90.38 | 0.46 | 0.94 |
| Ideational fluency | 95.36 | 96.32 | 0.75 | 0.94 |
| Executive functioning | 88.70 | 89.30 | 0.94 | 0.94 |
| D) Smell test | ||||
| Characteristics | mean (TR) | mean (non-TR) | p-value | q-value |
| Odor discrimination | 9.59 | 9.79 | 0.74 | 0.96 |
| Odor identification | 11.18 | 11.54 | 0.75 | 0.96 |
| Detection sensitivity: Citralva | −4.44 | −4.66 | 0.12 | 0.48 |
| Detection sensitivity: Lyral | −4.35 | −4.27 | 0.96 | 0.96 |
Analysis of olfactory test scores between TR and non-TR patients
Previously, our group reported that FEP patients have significantly different odor identification, discrimination, and detection sensitivities of lyral and citralva compared to healthy controls [28]. Thus, we tested whether smell function is different between TR and non-TR patients. We didn’t find significant differences in these olfactory test scores between TR and non-TR patients including or excluding those with short follow-ups (Table 1D, S3D).
Analysis of brain volume between TR and non-TR patients
Changes in brain volume have been observed in patients with psychosis compared to controls [49–51]. Thus, we wondered whether TR patients have more prominent anatomical changes compared with non-TR patients, and conducted the comparison based on the segmentation in the MRICloud [45]. In this analysis, no regions met a stringent cutoff of q-values smaller than 0.05. Thus, to select promising brain regions, nevertheless, reasonably controlling type I error, we performed a permutation test and introduced a relaxed cutoff (group comparison p-value < 0.05 and permutation test p-value < 0.05). Under this relaxed cutoff, 10 out of 136 regions of study were different in the volume between TR patients and non-TR patients (excluding those with short follow-ups) (Table 2), whereas 3 regions showed a difference in the volume between TR patients and all non-TR patients (including those with short follow-ups) (Table S4). The right hippocampus (HP), left superior frontal gyrus (SFG), and left gyrus rectus (GR) were different between TR patients and non-TR patients in both comparisons (TR vs. non-TR, excluding or including non-TR patients with short follow-ups).
TABLE 2. Analysis results of brain volume between treatment resistant (TR) and non-TR patients.
Brain volumes were compared between TR (n=32) and non-TR (n=69) patients (non-TR patients with short follow-ups were excluded). The top 20 brain regions are listed.
| Brain region | Hemisphere | Mean (TR) | Mean (non-TR) | p-value | p-value (permutation test) | q-value |
|---|---|---|---|---|---|---|
| Hippocampus | right | 3608.11 | 3856.06 | 5.24E-03 | 3.40E-03 | 0.58 |
| Gyrus rectus | left | 5390.74 | 5666.04 | 0.02 | 0.02 | 0.58 |
| Superior frontal gyrus | left | 24406.95 | 25294.23 | 0.03 | 0.02 | 0.58 |
| Cuneus | left | 6235.74 | 6526.36 | 0.04 | 4.89E-02 | 0.58 |
| Cuneus | right | 5639.63 | 5864.89 | 0.04 | 0.02 | 0.58 |
| Occipital sulcus | left | 1038.95 | 1158.70 | 0.04 | 0.04 | 0.58 |
| Occipital sulcus | right | 1184.68 | 1307.47 | 4.52E-02 | 0.03 | 0.58 |
| Parietal sulcus | right | 7136.21 | 7797.64 | 4.54E-02 | 0.04 | 0.58 |
| Middle frontal gyrus | right | 22359.63 | 22887.74 | 4.65E-02 | 0.03 | 0.58 |
| Hippocampus cingulum | right | 1498.37 | 1565.00 | 4.75E-02 | 0.03 | 0.58 |
| Middle frontal gyrus | left | 23062.74 | 23857.11 | 4.79E-02 | 5.34E-02 | 0.58 |
| Middle occipital gyrus | left | 15138.05 | 15890.55 | 5.14E-02 | 0.06 | 0.58 |
| Limbic | right | 1894.00 | 1971.47 | 0.07 | 0.04 | 0.70 |
| Gyrus rectus | right | 5478.47 | 5692.02 | 0.08 | 0.31 | 0.70 |
| Hippocampus | left | 3546.58 | 3701.38 | 0.08 | 0.20 | 0.70 |
| Cingulate cortex | right | 3182.32 | 3439.49 | 0.09 | 0.26 | 0.70 |
| Cingulate gyrus | right | 24413.21 | 25127.13 | 0.10 | 0.13 | 0.70 |
| Parietal parts of syllabus sulcus | left | 206.63 | 253.74 | 0.10 | 0.08 | 0.70 |
| Peripheral occipital white matter | left | 25707.00 | 26277.60 | 0.10 | 0.12 | 0.70 |
| Frontal parts of sylvian sulcus | right | 1518.26 | 1417.85 | 0.11 | 0.27 | 0.70 |
Analysis of 7T-MRS data between TR and non-TR patients
We previously studied 5 distinct brain regions (ACC, DLPFC, OFR, CSO, and Thal), and reported that FEP patients have significantly different levels of Glu, GABA, NAA, and GSH, compared with healthy controls [27]. With the hypothesis that some of these brain metabolites may be associated with TR, in the present study, we compared these metabolites in all 5 brain regions between TR and non-TR patients. We found that GSH in the ACC was the only significant metabolite (water reference: q-value = 0.03): GSH levels in the other brain regions and the other metabolite levels in all 5 brain regions were not significantly different between TR and non-TR patients (excluding non-TR patients with short follow-ups) (Figure 1, Table S5A, B). Similar findings were obtained via comparison between TR and all non-TR patients (including non-TR patients with short follow-ups) (Table S5C, D).
FIGURE 1. Box plots of glutathione (GSH) levels (water reference) in treatment resistant (TR) and non-TR patients.
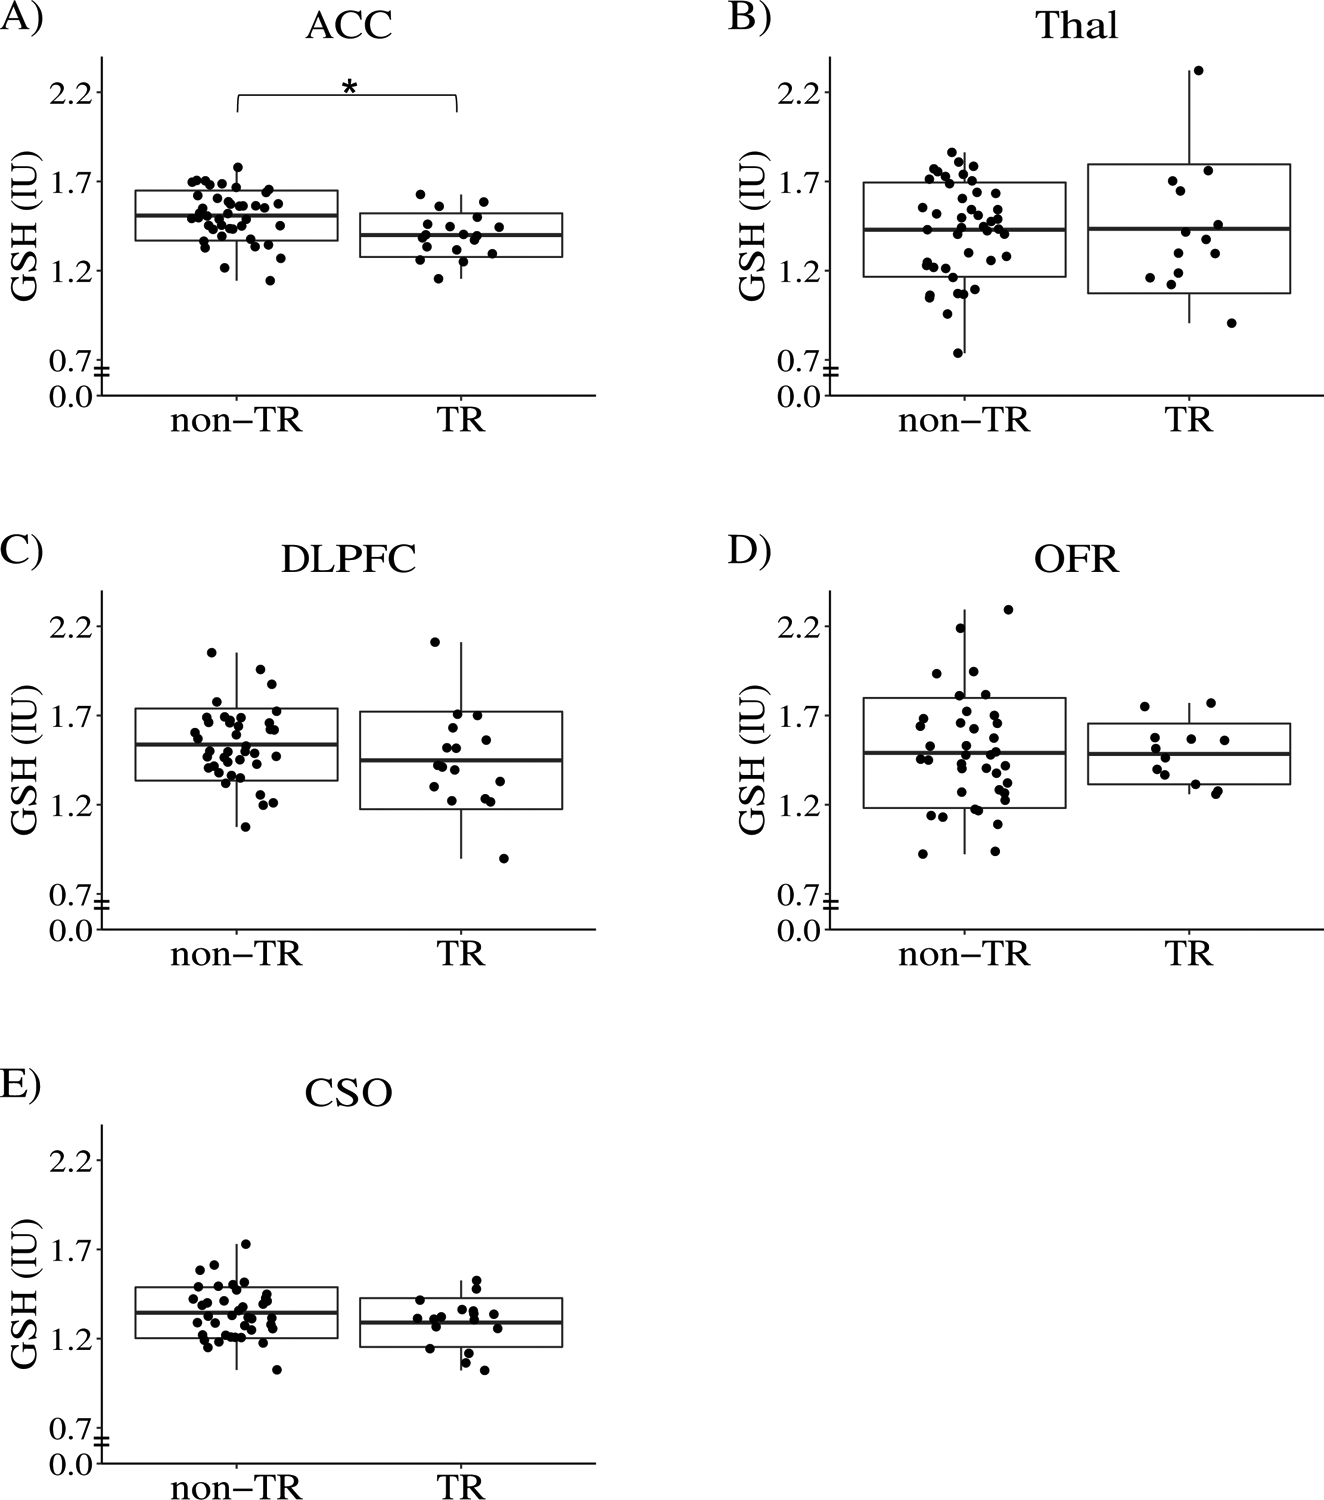
The box represents standard deviation and the solid line in the middle of the box shows the mean value. Black dots represent individual subjects. Symbol * denotes significant results (q-value < 0.05). Abbreviations: ACC, anterior cingulate cortex; Thal, thalamus; OFR, orbital frontal cortex; DLPFC, dorsolateral prefrontal cortex; CSO, centrum semiovale, and IU, institutional unit, approximately millimolar. In this analysis, non-TR patients excluding those with short follow-ups were compared with TR patients.
Influence of clozapine within TR patient group.
Nine of 32 TR patients in our cohort took clozapine at the first visit when all biological and other assessments were made. To test whether the use of clozapine affected the outcome measures in the present study, we compared TR patients who took clozapine with TR patients who didn’t take clozapine at the first visit. We did not observe any differences in any variables between these two groups, which include age of onset, number of hospitalizations, negative symptoms, 7T MRS data, and brain volumes (Tables S6, S7, S8).
Multimodal data for TR and non-TR classification
One unique aspect of the present study is that multimodal data was collected from this FEP cohort, which gives us an opportunity to integrate different types of data to obtain a comprehensive view for TR. Thus far, at least from each individual modality, we observed that TR and non-TR groups are different in age of onset, number of hospitalizations, negative symptoms, the level of GSH in the ACC (ACC-GSH), and the volume of specific brain regions (Table 3).
TABLE 3. Summary of significant findings.
This table summarizes the p-values for CPZ dose, number of hospitalizations, age of onset, ACC GSH, SANS scores, and brain volumes. It also summarizes the range of p-values for multiple scores from smell test, neuropsychological test, and SAPS. Stable markers for TR are highlighted in gray shadow. Abbreviations: TR, treatment resistant; CPZ, chlorpromazine; ACC, anterior cingulate cortex; GSH, glutathione; HP, hippocampus, SFG, superior frontal gyrus; SANS, the scale for the assessment of negative symptoms; and SAPS, the scale for the assessment of positive symptoms.
| TR vs non-TR (short follow-ups excluded) |
TR vs non-TR (short follow-ups included) |
Change over time | |
|---|---|---|---|
| CPZ dose | 0.06 | 0.03 | 1.43E-03 |
| No. of Hospitalizations | 7.19E-03 | 1.50E-03 | 0.08 |
| Age of onset | 0.01 | 3.78E-03 | 1.00 |
| ACC GSH | 1.68E-03 | 6.25E-03 | 0.77 |
| Volume of right HP | 5.24E-03 | 0.01 | 0.77 |
| Volume of left SFG | 0.03 | 0.02 | 0.35 |
| Volume of left gyrus rectus | 0.02 | 0.04 | 1.68E-03 |
| Smell test | > 0.05 | > 0.05 | < 0.05 |
| Neuropsychological test | > 0.05 | > 0.05 | < 0.05 |
| SAPS: total/global score | > 0.05 | > 0.05 | < 0.05 |
| SANS: avolition | 2.98E-03 | 5.21E-03 | 0.02 |
| SANS: total score | 0.02 | 0.01 | 0.11 |
We next asked whether multimodal datasets could provide a better understanding of TR that could differentiate TR patients from non-TR patients. Markers that differentiate these two groups may include state indicators that change over time. On the other hand, markers whose values are stable over the disease course or at least in early disease stages are useful to predict the risk or biological vulnerability to TR. Thus, in the present study, we paid attention to stable markers for TR (markers that were shared among patients who met the TR criteria before and after the baseline visit) rather than signatures associated with the TR state. Under such premise, we used classification models with stable markers to evaluate the performance of individual markers as well as the combination of them. Our previous longitudinal assessment for the same cohort used in the present study showed that the ACC-GSH levels were stable in patients between 15–35 years of age [52]. Using the same analytic pipeline that we used to assess longitudinal changes in the ACC-GSH level [52], we found that the right HP volume and the left SFG volume were also stable in FEP patients (Table S9: see also details in the supplementary methods). Additionally, age of onset won’t change over time. The SANS total score and the number of hospitalizations were not considered as stable markers under the cutoff (q-value > 0.3) that we defined in a conservative manner. Altogether, we identified 4 stable markers (ACC-GSH, right HP volume, left SFG volume, and age of onset), which were further evaluated using classification models.
Interestingly, using TR patients and non-TR patients excluding those with short follow-ups, we found that the integration of markers could largely improve the classification performance with an AUC of 0.83, while the AUCs for age of onset, ACC-GSH, right HP, and left SFG were 0.64, 0.69, 0.60, and 0.55, respectively (Figure 2, Table S10A). The AICs for models using age of onset, ACC-GSH, right HP, left SFG, and all the four markers are 69.06, 67.49, 71.26, 72.64, and 51.92, respectively. Similarly, analysis using TR and all non-TR patients (including those with short follow-ups) found that the combination of multimodal markers outperformed individual markers (Figure S1, Table S10B). Furthermore, when we exclude right HP and left SFG, which were included with a less stringent cutoff, and only used age of onset and ACC-GSH for the multimodal assessment, we obtained an AUC of 0.75 (excluding non-TR patients with short follow-ups), which was still better than the performance of individual markers (age of onset 0.64, ACC-GSH 0.69, as described above). Together, these results imply that multimodal datasets could provide complementary or non-redundant information to reach a better understanding of TR. Without a single factor highly associated with TR, a combination of biomarkers may complement the small effect size of individual factors and help us to identify TR patients at an early stage.
FIGURE 2. Classification models of treatment resistant (TR) and non-TR patients.
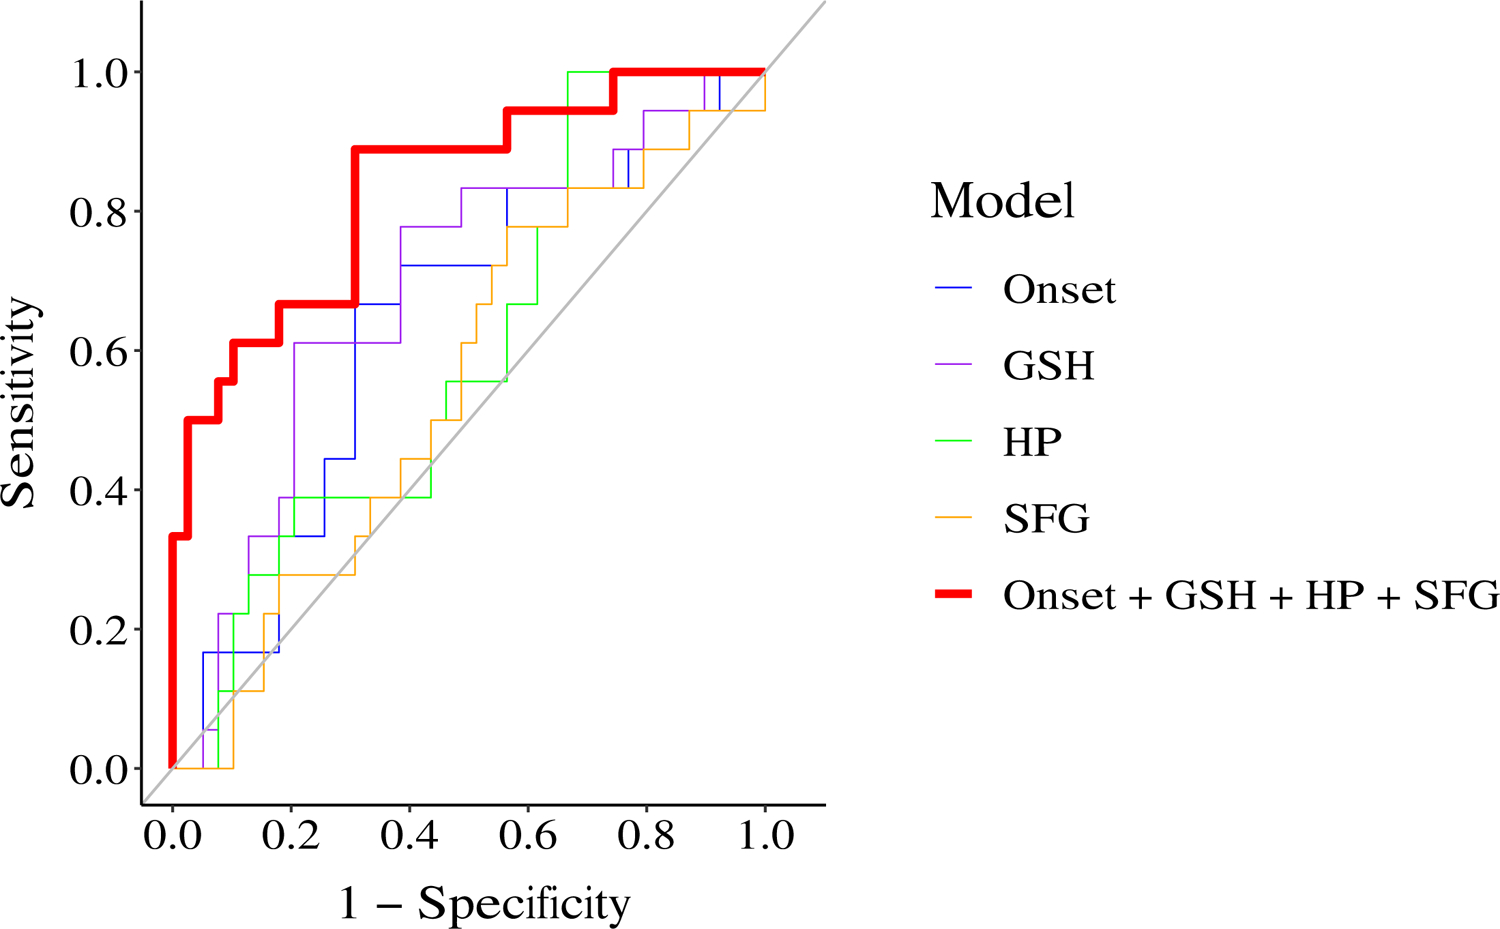
We compared the performance of five classification models: 1) model of age of onset (denoted as Onset), blue, AUC=0.64; 2) model of glutathione in anterior cingulate cortex (denoted as GSH), purple line, AUC=0.69; 3) model of right hippocampal volume (denoted as HP), green line, AUC=0.60; 4) model of left superior frontal gyral volume (denoted as SFG), orange line, AUC=0.55; and 5) model of multimodal markers (denoted as Onset + GSH + HP + SFG), red line, AUC=0.83. In this modeling, the data from non-TR patients excluding those with short follow-ups and TR patients were used.
Discussion
We have established a FEP cohort with multimodal data collection. The percentage of TR patients was consistent with previous findings that about 20–30% of patients develop TR [2–4, 53]. We confirmed that younger age of onset, more hospitalizations, and severer negative symptoms were associated with TR patients when compared with non-TR patients, which is also consistent with previous reports from multiple groups [2–4]. Notably, we showed that GSH was selectively reduced among several key metabolites such as Glu, GABA, and NAA in the ACC in TR patients, when compared with non-TR patients. Furthermore, the difference in GSH between the groups was observed only in the ACC, but not in any other brain regions (DLPFC, Thal, CSO, OFR) examined in the present study. Interestingly, our previous longitudinal study found that the levels of ACC-GSH were stable over time [52]. In addition, by using an unbiased approach using MRICloud [45], we observed differences in volumes in some brain regions between TR and non-TR patients. Furthermore, the volumes of these brain regions (e.g., right HP and the left SFG) were stable over time. At last, we showed that clozapine use did not affect outcome measures in the present study within our cohort.
One unique aspect of this study is that multimodal data was obtained from the same subjects. By taking advantage of this, we constructed classification models with multimodal data that were stable in the trajectory of early disease phases, and demonstrated that a combination of multiple markers led to much better classification performance than individual markers. This suggests that using multiple markers may overcome the issue of small effect sizes of individual markers and identify TR patients at early stages. The performance of the classification models in the present study may not directly impact clinical practice, nevertheless, the goal of this study is to explore the direction of early diagnosis and intervention for TR. Diagnostic strategies using multimodal data have achieved success in the clinical practice of many diseases. For example, a variety of invasive and non-invasive tests including physiological, imaging, and molecular markers are routinely used for the diagnosis of cardiovascular disease [54]. With additional molecular markers from future studies at the epigenetic, gene, or protein levels, we believe that a clinical-grade diagnostic tool employing multimodal data could be developed for TR.
In this study, we used medication records to define TR. Instead of closely tracking the treatment response to antipsychotics during a short interval (such as half to one year), we chose this approach because medication records can be easily collected. Furthermore, this strategy is easily expanded globally beyond potential differences involving hospitalization that tends to be affected by social systems. For example, discoveries from this study can be further validated by population studies or consortia research like ENIGMA (Enhancing Neuro Imaging Genetics through Meta-Analysis) [55]. Nevertheless, it is important that study psychiatrists carefully determine that the switches of antipsychotics are not because of adverse effects, non-adherence, or for other unrelated reasons. Our biological observations that were made in a comprehensive manner (semi-unbiased or unbiased approaches) are compatible with the biological changes that were reported in a candidate target approach for antipsychotic treatment response [24]. These observations suggest that, although study designs based on antipsychotic treatment response for a short period and those that stand on medication records are somewhat disconnected in the overall TR research field, both of them have room to be interpreted in an integrative and comprehensive manner.
In the present study, we observed that TR patients had a significantly higher SANS total score and global score in avolition, whereas no significant differences in either the SAPS total or global scores were observed between TR and non-TR patients. Given that TR is defined as poor response to antipsychotics in regard to psychosis, these results may sound paradoxical. Nevertheless, thus far, more than one meta-data analysis has consistently reported that negative symptoms rather than positive symptoms were significantly different between TR and non-TR groups [56, 57].
A reduction in the HP volume or a decrease in the SFG volume have been reported in patients with psychotic disorder [58–61]. Here, we observed a volume reduction in both the HP and SFG in TR patients compared with non-TR patients, making the observation more specific. Furthermore, we also observed a significant reduction in the level of GSH in the ACC. GSH is a physiological reservoir for Glu through the GSH cycle [62], and a reduction in the ACC GSH level, as shown in the present study, implies not only redox imbalance but also glutamatergic neurotransmission imbalance [63] involving the ACC in TR patients. The brain regions underscored in the present study mediate multiple higher brain functions, including associative learning and memory, in which glutamatergic and non-dopaminergic neurotransmission play important roles [64, 65]. This may be one of the reasons why D2-targeted antipsychotics, regardless of first or second generation, may not work for TR patients. We previously reported gray-matter abnormalities in deficit schizophrenia, including major changes in the SFG and ACC [66]. A recent report pointed out the connectivity between the HP and ACC as a potential marker to predict treatment response to second generation antipsychotics in FEP patients [26]. These reports may be interpreted in the same mechanistic context as what we have observed in the present study.
The present study may have potential limitations. First, this study does not include a replication cohort. However, the goal of this study is to discover new directions by using a relatively unique cohort in which multimodal data are available for FEP patients. For this reason, we believe that the inclusion of a replication cohort is beyond the scope of the present work. Nevertheless, the main message is to extract multimodal markers for TR that can be easily collected in many institutions and countries. The MRS data for ACC-GSH may be difficult for some hospitals in some countries. To overcome this dilemma, efforts to identify a surrogate blood marker that correlates with ACC-GSH may be important. In addition, we acknowledge that some of the 104 patients classified as non-TR, might become TR if they were followed longer. To address this possibility, we performed analysis using non-TR patients with and without excluding those with short follow-ups. The results and conclusions of the two-group comparisons were in essence the same. Thus, this dilemma should not affect the overall conclusion. Furthermore, in the present study, the majority of the patients were medicated. Statistical analysis can’t fully address the effects of antipsychotics on brain structures and metabolites. Further studies with medication-naïve patients are expected to confirm our findings. Lastly, we used general linear regression models to evaluate the performance of multimodal markers, which may not be the most efficient way for data fusion. Nevertheless, we employed this approach in the present study, as this is straightforward and can be easily verified by other cohorts.
The research presented here demonstrates the utility and advantages of multimodal study cohorts for psychiatric research. By utilizing deep phenotyping data covering genetics, metabolomics, proteomics, brain imaging, and clinical tests, we can obtain a holistic view of complex and heterogeneous diseases, like psychosis, through hypothesis and/or data-driven approaches (Figure S2). We expect that well-maintained multimodal study cohorts will become essential resources for tackling the diagnosis and treatment of brain disorders.
Supplementary Material
Acknowledgements
This study is supported by National Institutes of Mental Health Grants MH-092443 (to AS), MH-094268 (to AS), MH-105660 (to AS), and MH-107730 (to AS); foundation grants from Stanley (to AS), RUSK/S-R (to AS), and a NARSAD young investigator award from Brain and Behavior Research Foundation (to AS, KY). The original recruitment of study participants was partly funded by Mitsubishi Tanabe Pharma Corporation. The authors thank Drs. Brian Caffo for kindly contributing to scientific discussions and feedback related to this work. The authors appreciate Ms. Yukiko Lema for research management and manuscript organization, and thank Dr. Melissa A Landek-Salgado for critical reading of the manuscript.
Footnotes
Conflict of interest
We declare that we have no conflict of interest. As noted in the acknowledgement section, the original recruitment of study participants was partly funded by Mitsubishi Tanabe Pharma Corporation. However, this company is not involved in this specific study.
References
- 1.Secher RG, Hjorthøj CR, Austin SF, Thorup A, Jeppesen P, Mors O, et al. Ten-Year Follow-up of the OPUS Specialized Early Intervention Trial for Patients With a First Episode of Psychosis. Schizophr Bull. 2015;41:617–626. [DOI] [PMC free article] [PubMed] [Google Scholar]
- 2.Nucifora FC, Woznica E, Lee BJ, Cascella N, Sawa A. Treatment resistant schizophrenia: Clinical, biological, and therapeutic perspectives. Neurobiol Dis. 2018:104257. [DOI] [PMC free article] [PubMed] [Google Scholar]
- 3.Wimberley T, Støvring H, Sørensen HJ, Horsdal HT, MacCabe JH, Gasse C. Predictors of treatment resistance in patients with schizophrenia: a population-based cohort study. Lancet Psychiatry. 2016;3:358–366. [DOI] [PubMed] [Google Scholar]
- 4.Lally J, Ajnakina O, Di Forti M, Trotta A, Demjaha A, Kolliakou A, et al. Two distinct patterns of treatment resistance: clinical predictors of treatment resistance in first-episode schizophrenia spectrum psychoses. Psychol Med. 2016;46:3231–3240. [DOI] [PubMed] [Google Scholar]
- 5.Nucifora FC, Mihaljevic M, Lee BJ, Sawa A. Clozapine as a Model for Antipsychotic Development. Neurotherapeutics. 2017;14:750–761. [DOI] [PMC free article] [PubMed] [Google Scholar]
- 6.Legge SE, Hamshere ML, Ripke S, Pardinas AF, Goldstein JI, Rees E, et al. Genome-wide common and rare variant analysis provides novel insights into clozapine-associated neutropenia. Mol Psychiatry. 2018;23:162–163. [DOI] [PMC free article] [PubMed] [Google Scholar]
- 7.Kinon BJ. The Group of Treatment Resistant Schizophrenias. Heterogeneity in Treatment Resistant Schizophrenia (TRS). Front Psychiatry. 2018;9:757. [DOI] [PMC free article] [PubMed] [Google Scholar]
- 8.Shah P, Iwata Y, Plitman E, Brown EE, Caravaggio F, Kim J, et al. The impact of delay in clozapine initiation on treatment outcomes in patients with treatment-resistant schizophrenia: A systematic review. Psychiatry Res. 2018;268:114–122. [DOI] [PubMed] [Google Scholar]
- 9.Kayo M, Tassell I, Hiroce V, Menezes A, Elkis H. Does lack of improvement in the first two weeks predict treatment resistance in recent-onset psychosis? Clinics (Sao Paulo). 2012;67:1479–1482. [DOI] [PMC free article] [PubMed] [Google Scholar]
- 10.Howes OD, McCutcheon R, Agid O, de Bartolomeis A, van Beveren NJM, Birnbaum ML, et al. Treatment-Resistant Schizophrenia: Treatment Response and Resistance in Psychosis (TRRIP) Working Group Consensus Guidelines on Diagnosis and Terminology. Am J Psychiatry. 2017;174:216–229. [DOI] [PMC free article] [PubMed] [Google Scholar]
- 11.Demjaha A, Lappin JM, Stahl D, Patel MX, MacCabe JH, Howes OD, et al. Antipsychotic treatment resistance in first-episode psychosis: prevalence, subtypes and predictors. Psychol Med. 2017;47:1981–1989. [DOI] [PubMed] [Google Scholar]
- 12.Fusar-Poli P, Rutigliano G, Stahl D, Davies C, Bonoldi I, Reilly T, et al. Development and Validation of a Clinically Based Risk Calculator for the Transdiagnostic Prediction of Psychosis. JAMA Psychiatry. 2017;74:493–500. [DOI] [PMC free article] [PubMed] [Google Scholar]
- 13.Kanahara N, Yamanaka H, Suzuki T, Takase M, Iyo M. First-episode psychosis in treatment-resistant schizophrenia: a cross-sectional study of a long-term follow-up cohort. BMC Psychiatry. 2018;18:274. [DOI] [PMC free article] [PubMed] [Google Scholar]
- 14.Kowalec K, Lu Y, Sariaslan A, Song J, Ploner A, Dalman C, et al. Increased schizophrenia family history burden and reduced premorbid IQ in treatment-resistant schizophrenia: a Swedish National Register and Genomic Study. Mol Psychiatry. 2019:1–9. [DOI] [PMC free article] [PubMed] [Google Scholar]
- 15.Frydecka D, Beszłej JA, Gościmski P, Kiejna A, Misiak B. Profiling cognitive impairment in treatment-resistant schizophrenia patients. Psychiatry Res. 2016;235:133–138. [DOI] [PubMed] [Google Scholar]
- 16.Palaniyappan L, Marques TR, Taylor H, Handley R, Mondelli V, Bonaccorso S, et al. Cortical Folding Defects as Markers of Poor Treatment Response in First-Episode Psychosis. JAMA Psychiatry. 2013;70:1031–1040. [DOI] [PMC free article] [PubMed] [Google Scholar]
- 17.Mondelli V, Ciufolini S, Belvederi Murri M, Bonaccorso S, Di Forti M, Giordano A, et al. Cortisol and Inflammatory Biomarkers Predict Poor Treatment Response in First Episode Psychosis. Schizophr Bull. 2015;41:1162–1170. [DOI] [PMC free article] [PubMed] [Google Scholar]
- 18.Egerton A, Broberg BV, Van Haren N, Merritt K, Barker GJ, Lythgoe DJ, et al. Response to initial antipsychotic treatment in first episode psychosis is related to anterior cingulate glutamate levels: a multicentre 1H-MRS study (OPTiMiSE). Mol Psychiatry. 2018;23:2145–2155. [DOI] [PubMed] [Google Scholar]
- 19.Egerton A, Brugger S, Raffin M, Barker GJ, Lythgoe DJ, McGuire PK, et al. Anterior cingulate glutamate levels related to clinical status following treatment in first-episode schizophrenia. Neuropsychopharmacology. 2012;37:2515–2521. [DOI] [PMC free article] [PubMed] [Google Scholar]
- 20.Demjaha A, Egerton A, Murray RM, Kapur S, Howes OD, Stone JM, et al. Antipsychotic treatment resistance in schizophrenia associated with elevated glutamate levels but normal dopamine function. Biol Psychiatry. 2014;75:e11–13. [DOI] [PubMed] [Google Scholar]
- 21.Jauhar S, Veronese M, Nour MM, Rogdaki M, Hathway P, Turkheimer FE, et al. Determinants of treatment response in first-episode psychosis: an 18F-DOPA PET study. Mol Psychiatry. 2019;24:1502–1512. [DOI] [PMC free article] [PubMed] [Google Scholar]
- 22.Kim E, Howes OD, Veronese M, Beck K, Seo S, Park JW, et al. Presynaptic Dopamine Capacity in Patients with Treatment-Resistant Schizophrenia Taking Clozapine: An [18F]DOPA PET Study. Neuropsychopharmacology. 2017;42:941–950. [DOI] [PMC free article] [PubMed] [Google Scholar]
- 23.Howes OD, Bose SK, Turkheimer F, Valli I, Egerton A, Valmaggia LR, et al. Dopamine synthesis capacity before onset of psychosis: a prospective [18F]-DOPA PET imaging study. Am J Psychiatry. 2011;168:1311–1317. [DOI] [PMC free article] [PubMed] [Google Scholar]
- 24.Dempster K, Jeon P, MacKinley M, Williamson P, Théberge J, Palaniyappan L. Early treatment response in first episode psychosis: a 7-T magnetic resonance spectroscopic study of glutathione and glutamate. Mol Psychiatry. 2020;25:1640–1650. [DOI] [PMC free article] [PubMed] [Google Scholar]
- 25.Kochunov P, Huang J, Chen S, Li Y, Tan S, Fan F, et al. White Matter in Schizophrenia Treatment Resistance. Am J Psychiatry. 2019;176:829–838. [DOI] [PMC free article] [PubMed] [Google Scholar]
- 26.Blessing EM, Murty VP, Zeng B, Wang J, Davachi L, Goff DC. Anterior Hippocampal-Cortical Functional Connectivity Distinguishes Antipsychotic Naïve First-Episode Psychosis Patients From Controls and May Predict Response to Second-Generation Antipsychotic Treatment. Schizophr Bull. 2019;46:680–689. [DOI] [PMC free article] [PubMed] [Google Scholar]
- 27.Wang AM, Pradhan S, Coughlin JM, Trivedi A, DuBois SL, Crawford JL, et al. Assessing Brain Metabolism With 7-T Proton Magnetic Resonance Spectroscopy in Patients With First-Episode Psychosis. JAMA Psychiatry. 2019;76:314–323. [DOI] [PMC free article] [PubMed] [Google Scholar]
- 28.Kamath V, Lasutschinkow P, Ishizuka K, Sawa A. Olfactory Functioning in First-Episode Psychosis. Schizophr Bull. 2018;44:672–680. [DOI] [PMC free article] [PubMed] [Google Scholar]
- 29.Faria AV, Crawford J, Ye C, Hsu J, Kenkare A, Schretlen D, et al. Relationship between neuropsychological behavior and brain white matter in first-episode psychosis. Schizophr Res. 2019;208:49–54. [DOI] [PMC free article] [PubMed] [Google Scholar]
- 30.Posporelis S, Coughlin JM, Marsman A, Pradhan S, Tanaka T, Wang H, et al. Decoupling of Brain Temperature and Glutamate in Recent Onset of Schizophrenia: A 7T Proton Magnetic Resonance Spectroscopy Study. Biol Psychiatry Cogn Neurosci Neuroimaging. 2018;3:248–254. [DOI] [PMC free article] [PubMed] [Google Scholar]
- 31.Kamath V, Crawford J, DuBois S, Nucifora FC, Nestadt G, Sawa A, et al. Contributions of olfactory and neuropsychological assessment to the diagnosis of first-episode schizophrenia. Neuropsychology. 2019;33:203–211. [DOI] [PMC free article] [PubMed] [Google Scholar]
- 32.Good KP, Tibbo P, Milliken H, Whitehorn D, Alexiadis M, Robertson N, et al. An investigation of a possible relationship between olfactory identification deficits at first episode and four-year outcomes in patients with psychosis. Schizophr Res. 2010;124:60–65. [DOI] [PubMed] [Google Scholar]
- 33.Kästner A, Malzahn D, Begemann M, Hilmes C, Bickeböller H, Ehrenreich H. Odor naming and interpretation performance in 881 schizophrenia subjects: association with clinical parameters. BMC Psychiatry. 2013;13:218. [DOI] [PMC free article] [PubMed] [Google Scholar]
- 34.Deakin B, Suckling J, Barnes TRE, Byrne K, Chaudhry IB, Dazzan P, et al. The benefit of minocycline on negative symptoms of schizophrenia in patients with recent-onset psychosis (BeneMin): a randomised, double-blind, placebo-controlled trial. Lancet Psychiatry. 2018;5:885–894. [DOI] [PMC free article] [PubMed] [Google Scholar]
- 35.Koshiyama D, Kirihara K, Tada M, Nagai T, Fujioka M, Ichikawa E, et al. Electrophysiological evidence for abnormal glutamate-GABA association following psychosis onset. Translational Psychiatry. 2018;8:1–10. [DOI] [PMC free article] [PubMed] [Google Scholar]
- 36.Lesh TA, Maddock RJ, Howell A, Wang H, Tanase C, Daniel Ragland J, et al. Extracellular free water and glutathione in first-episode psychosis-a multimodal investigation of an inflammatory model for psychosis. Mol Psychiatry. 2021;26:761–771. [DOI] [PMC free article] [PubMed] [Google Scholar]
- 37.Kim S, Shin SH, Santangelo B, Veronese M, Kang SK, Lee JS, et al. Dopamine dysregulation in psychotic relapse after antipsychotic discontinuation: an [18F]DOPA and [11C]raclopride PET study in first-episode psychosis. Mol Psychiatry. 2020. 14 September 2020. 10.1038/s41380-020-00879-0. [DOI] [PubMed] [Google Scholar]
- 38.Galderisi S, Davidson M, Kahn RS, Mucci A, Boter H, Gheorghe MD, et al. Correlates of cognitive impairment in first episode schizophrenia: the EUFEST study. Schizophr Res. 2009;115:104–114. [DOI] [PubMed] [Google Scholar]
- 39.Wilson RS, Yung AR, Morrison AP. Comorbidity rates of depression and anxiety in first episode psychosis: A systematic review and meta-analysis. Schizophr Res. 2020;216:322–329. [DOI] [PubMed] [Google Scholar]
- 40.Andreasen NC, Flaum M, Arndt S, Alliger R, Swayze VW. Positive and Negative Symptoms: Assessment and Validity. In: Marneros A, Andreasen NC, Tsuang MT, editors. Negative Versus Positive Schizophrenia, Berlin, Heidelberg: Springer Berlin Heidelberg; 1991. p. 28–51. [Google Scholar]
- 41.Testa SM, Winicki JM, Pearlson GD, Gordon B, Schretlen DJ. Accounting for estimated IQ in neuropsychological test performance with regression-based techniques. J Int Neuropsychol Soc. 2009;15:1012–1022. [DOI] [PubMed] [Google Scholar]
- 42.Schretlen DJ, Vannorsdall TD, Winicki JM, Mushtaq Y, Hikida T, Sawa A, et al. Neuroanatomic and cognitive abnormalities related to herpes simplex virus type 1 in schizophrenia. Schizophr Res. 2010;118:224–231. [DOI] [PubMed] [Google Scholar]
- 43.Schretlen DJ, Cascella NG, Meyer SM, Kingery LR, Testa SM, Munro CA, et al. Neuropsychological functioning in bipolar disorder and schizophrenia. Biol Psychiatry. 2007;62:179–186. [DOI] [PMC free article] [PubMed] [Google Scholar]
- 44.Reid MA, Salibi N, White DM, Gawne TJ, Denney TS, Lahti AC. 7T Proton Magnetic Resonance Spectroscopy of the Anterior Cingulate Cortex in First-Episode Schizophrenia. Schizophr Bull. 2019;45:180–189. [DOI] [PMC free article] [PubMed] [Google Scholar]
- 45.Mori S, Wu D, Ceritoglu C, Li Y, Kolasny A, Vaillant MA, et al. MRICloud: Delivering High-Throughput MRI Neuroinformatics as Cloud-Based Software as a Service. Comput Sci Eng. 2016;18:21–35. [Google Scholar]
- 46.Tang X, Oishi K, Faria AV, Hillis AE, Albert MS, Mori S, et al. Bayesian Parameter Estimation and Segmentation in the Multi-Atlas Random Orbit Model. PLoS One. 2013;8. [DOI] [PMC free article] [PubMed] [Google Scholar]
- 47.Oishi K, Faria A, Jiang H, Li X, Akhter K, Zhang J, et al. Atlas-based whole brain white matter analysis using large deformation diffeomorphic metric mapping: Application to normal elderly and Alzheimer’s disease participants. Neuroimage. 2009;46:486–499. [DOI] [PMC free article] [PubMed] [Google Scholar]
- 48.Leucht S, Samara M, Heres S, Davis JM. Dose Equivalents for Antipsychotic Drugs: The DDD Method. Schizophr Bull. 2016;42 Suppl 1:S90–94. [DOI] [PMC free article] [PubMed] [Google Scholar]
- 49.Haijma SV, Van Haren N, Cahn W, Koolschijn PCMP, Hulshoff Pol HE, Kahn RS. Brain Volumes in Schizophrenia: A Meta-Analysis in Over 18 000 Subjects. Schizophr Bull. 2013;39:1129–1138. [DOI] [PMC free article] [PubMed] [Google Scholar]
- 50.van Erp TGM, Hibar DP, Rasmussen JM, Glahn DC, Pearlson GD, Andreassen OA, et al. Subcortical brain volume abnormalities in 2028 individuals with schizophrenia and 2540 healthy controls via the ENIGMA consortium. Mol Psychiatry. 2016;21:547–553. [DOI] [PMC free article] [PubMed] [Google Scholar]
- 51.Cahn W, Pol HEH, Lems EBTE, van Haren NEM, Schnack HG, van der Linden JA, et al. Brain Volume Changes in First-Episode Schizophrenia: A 1-Year Follow-up Study. Arch Gen Psychiatry. 2002;59:1002–1010. [DOI] [PubMed] [Google Scholar]
- 52.Wang M, Barker PB, Cascella N, Coughlin JM, Nestadt G, Nucifora FC, et al. Longitudinal changes in brain metabolites in healthy subjects and patients with first episode psychosis (FEP): a 7-Tesla MRS study. BioRxiv. 2020:2020.08.25.267419. [DOI] [PMC free article] [PubMed] [Google Scholar]
- 53.Lehman AF, Lieberman JA, Dixon LB, McGlashan TH, Miller AL, Perkins DO, et al. Practice guideline for the treatment of patients with schizophrenia, second edition. Am J Psychiatry. 2004;161:1–56. [PubMed] [Google Scholar]
- 54.Camm John A., Lüscher Thomas F., Serruys Patrick W.. The ESC Textbook of Cardiovascular Medicine. 6th ed. Oxford: Oxford University Press; 2009. [Google Scholar]
- 55.Thompson PM, Jahanshad N, Ching CRK, Salminen LE, Thomopoulos SI, Bright J, et al. ENIGMA and global neuroscience: A decade of large-scale studies of the brain in health and disease across more than 40 countries. Transl Psychiatry. 2020;10:1–28. [DOI] [PMC free article] [PubMed] [Google Scholar]
- 56.Immonen J, Jääskeläinen E, Korpela H, Miettunen J. Age at onset and the outcomes of schizophrenia: A systematic review and meta-analysis. Early Interv Psychiatry. 2017;11:453–460. [DOI] [PMC free article] [PubMed] [Google Scholar]
- 57.Bozzatello P, Bellino S, Rocca P. Predictive Factors of Treatment Resistance in First Episode of Psychosis: A Systematic Review. Front Psychiatry. 2019;10. [DOI] [PMC free article] [PubMed] [Google Scholar]
- 58.Briend F, Nelson EA, Maximo O, Armstrong WP, Kraguljac NV, Lahti AC. Hippocampal glutamate and hippocampus subfield volumes in antipsychotic-naive first episode psychosis subjects and relationships to duration of untreated psychosis. Transl Psychiatry. 2020;10:1–11. [DOI] [PMC free article] [PubMed] [Google Scholar]
- 59.Lieberman JA, Girgis RR, Brucato G, Moore H, Provenzano F, Kegeles L, et al. Hippocampal dysfunction in the pathophysiology of schizophrenia: a selective review and hypothesis for early detection and intervention. Mol Psychiatry. 2018;23:1764–1772. [DOI] [PMC free article] [PubMed] [Google Scholar]
- 60.Zhang Y, Catts VS, Sheedy D, McCrossin T, Kril JJ, Shannon Weickert C. Cortical grey matter volume reduction in people with schizophrenia is associated with neuro-inflammation. Transl Psychiatry. 2016;6:e982. [DOI] [PMC free article] [PubMed] [Google Scholar]
- 61.Fusar-Poli P, Crossley N, Woolley J, Carletti F, Perez-Iglesias R, Broome M, et al. White matter alterations related to P300 abnormalities in individuals at high risk for psychosis: an MRI-EEG study. J Psychiatry Neurosci. 2011;36:239–248. [DOI] [PMC free article] [PubMed] [Google Scholar]
- 62.Sedlak TW, Paul BD, Parker GM, Hester LD, Snowman AM, Taniguchi Y, et al. The glutathione cycle shapes synaptic glutamate activity. Proc Natl Acad Sci U S A. 2019;116:2701–2706. [DOI] [PMC free article] [PubMed] [Google Scholar]
- 63.Landek-Salgado MA, Faust TE, Sawa A. Molecular substrates of schizophrenia: homeostatic signaling to connectivity. Mol Psychiatry. 2016;21:10–28. [DOI] [PMC free article] [PubMed] [Google Scholar]
- 64.Maren S, Phan KL, Liberzon I. The contextual brain: implications for fear conditioning, extinction and psychopathology. Nat Rev Neurosci. 2013;14:417–428. [DOI] [PMC free article] [PubMed] [Google Scholar]
- 65.Ravishankar M, Morris A, Burgess A, Khatib D, Stanley JA, Diwadkar VA. Cortical-hippocampal functional connectivity during covert consolidation sub-serves associative learning: Evidence for an active ‘rest’ state. Brain Cogn. 2019;131:45–55. [DOI] [PMC free article] [PubMed] [Google Scholar]
- 66.Cascella NG, Fieldstone SC, Rao VA, Pearlson GD, Sawa A, Schretlen DJ. Gray-matter abnormalities in deficit schizophrenia. Schizophr Res. 2010;120:63–70. [DOI] [PubMed] [Google Scholar]
Associated Data
This section collects any data citations, data availability statements, or supplementary materials included in this article.