Abstract
A reliable diagnosis and accurate monitoring are pivotal steps for treatment and prevention of COVID-19. Chest computed tomography (CT) has been considered a crucial diagnostic imaging technique for the injury assessment of the viral pneumonia. Furthermore, the automatization of the segmentation methods for lung alterations helps to speed up the diagnosis and lighten radiologists’ workload. Considering the assiduous pathology monitoring, ultra-low dose (ULD) chest CT protocols have been implemented to drastically reduce the radiation burden. Unfortunately, the available AI technologies have not been trained on ULD-CT data and validated and their applicability deserves careful evaluation. Therefore, this work aims to compare the results of available AI tools (BCUnet, CORADS AI, NVIDIA CLARA Train SDK and CT Pneumonia Analysis) on a dataset of 73 CT examinations acquired both with conventional dose (CD) and ULD protocols. COVID-19 volume percentage, resulting from each tool, was statistically compared. This study demonstrated high comparability of the results on CD-CT and ULD-CT data among the four AI tools, with high correlation between the results obtained on both protocols (R > .68, P < .001, for all AI tools).
Keywords: COVID-19, segmentation algorithms, ultra-low dose, deep learning, artificial intelligence
Introduction
COVID-19 is an infectious disease caused by a newly discovered coronavirus (SARS-CoV-2) and it is an ongoing pandemic. It has spread since January 2020 and up to early March 2021 has infected 130, 509,866 people worldwide, with 45,919,941 confirmed cases only in Europe. 1 The clinical presentation of SARS-CoV-2 infection can range from asymptomatic to moderate or severe symptoms—such as fever, cough, weakness, loss of smell, and taste—respiratory disease and, less frequently, gastro-enteritis or neurological symptoms.
The gold standard for COVID-19 detection is the Reverse-Transcription-Polymerase Chain Reaction (RT-PCR) test. Different studies reported that RT-PCR technique has a high false negative rate and low sensitivity, 2 due to its variability in lab execution. In the cases of patients with suspected coronavirus infection, with negative RT-PCR test or waiting for swab responses, chest CT was used to speed up diagnosis times and to isolate the patient from the rest of the community. CT diagnostic technique, as a non-invasive imaging approach, is able to detect some characteristic features in the lung lesions COVID-19 associated, for example, ground glass opacities, rounded opacities, and enlarged intra-infiltrate vessels.3,4 The chest X-ray has often proved pathology (59% of cases) in asymptomatic or paucisymptomatic subjects after 14 days of quarantine, even in the absence of a nasopharyngeal swab. 5 In summer 2020, multidisciplinary panels of experts in patient management published guidelines for support the use of chest CT for COVID-19 patients with worsening respiratory status, 6 as well as the WHO. 7 Over the past decades, CT has become an important imaging technique, but it is also a major contributor to individual and collective radiation dose. For patient protection, CT dose is recommended to be as low as reasonably achievable to meet clinical needs. 8 Technical progress including automated exposure control helps to optimize the relationship between image noise and radiation dose. Correspondingly, automated exposure control with tube current modulation has been developed for CT.9,10 Moreover, adult scanning can be adjusted according to body weight (the smaller the bodies, the lesser the dose; instead, the larger the bodies, the higher the dose), resulting in excellent diagnostic scans. 11 All these last assertions have been confirmed, advocating the proper implementation, especially for chest scanning.12-17 The optimal image quality level for CT examinations stands for the level at which diagnostic images can reliably be produced using the lowest dose level and it should be tailored according to each individual patient and relevant cathegorized groups (e.g., pediatric, or obese patients). Thus, to reduce radiological risks and dose, ULD-CT protocols have been evaluated in recent decades. 18
To date, according to the authors' knowledge, very few studies have been published regarding dosimetry in ULD-CT protocols, and nothing that directly compares ULD-CT to both CD-CT and radiography. Schaal et al. estimated an average effective dose of .25 mSv based on exposure data from 55 patients, but lack of information about the size of the patients adds uncertainty to this estimate. 19 In emergent situations such as COVID-19 pandemic, the demand for performing CT scans may significantly increase due to the high rate of infected individuals.
The sequential and multiple acquisitions of CT exams can significantly increase the cumulative radiation dose these patients may receive during their hospitalization and recovery. Replacing CD-CT with ULD-CT has been proposed as a method to decrease radiation exposure. In a retrospective study, 20 a low dose CT (LD-CT) combined with iterative reconstruction demonstrated sensitivity, specificity, positive predictive value, negative predictive value, and accuracy of about 90% in the diagnosis of COVID-19. Furthermore, ULD-CT protocols proved an additive diagnostic benefit in patients with concomitant bacterial pneumonia or an alternative diagnosis other than COVID-19.
Recently, artificial intelligence (AI) techniques—in particular deep learning (DL) algorithms—have shown great potential in the medical imaging sector thanks to their high ability to extract both morphological and functional features.21-23 In particular, such techniques have been applied to detect and differentiate bacterial and viral pneumonia in pediatric chest radiographs.24,25 Besides, a retrospective and multicenter study regarding the application of DL technique to differentiate coronavirus pneumonia from other lung diseases was recently published. 26 Harmon et al. show that DL algorithms, trained in a diverse multinational cohort, can achieve up to 90.8% accuracy, with 84% sensitivity and 93% specificity. 27 Wang et al. uncovered some DL and radiomic features that contribute to differentiation of COVID-19 from non-COVID-19 viral pneumonia. 28 As a consequence of DL techniques development to support the diagnosis of COVID-19 on CT scans, several tools based on AI models trained on image datasets acquired with CD-CT protocol have been made available to the clinical and research community. The aim of this work is to evaluate the applicability of these tools also in the domain of low-dose CT images (ULD).
Materials and Methods
Patients
73 patients (41 female, age range: 52.91 ±16.40 (mean age ± standard deviation)) were informed and prospectively enrolled for the research protocol approved by the local ethical committee of IRCCS SDN (Comitato etico IRCCS Pascale, Naples, project identification code: 7_20). The protocol was adopted to face the pandemic situation. Inclusion criteria were the prescription of a chest CT for post-COVID-19 screening, suspect COVID-19, and generally pulmonary pathology. Anamnestic and clinical information were collected. Adult patients, with pulmonary disease or post–COVID-19 infection symptoms, who underwent baseline, unenhanced chest CT (according to clinical needs) on the third-generation dual source CT. Exclusion criteria were patients with a BMI greater than 30 and children and adolescents under 18 years.
CT Acquisition and Reconstruction
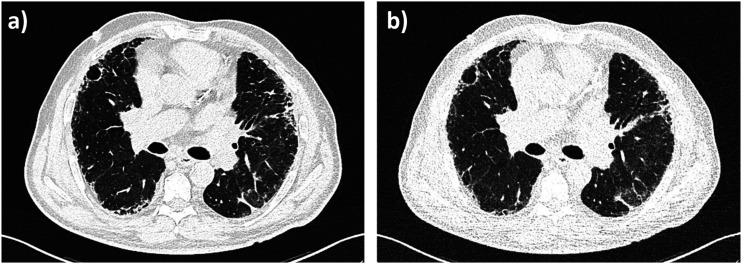
Patients lay in a head-first supine position during non-enhanced consecutive acquisition CT protocols (CD-CT followed by ULD-CT). All patients underwent LD chest CT by using a SOMATOM FORCE (Siemens Healthineers, Forchheim, Germany) slice .6 mm detector scanner. No contrast agent was admitted. The CD-CT acquisition parameters were as follows: tube voltage of reference 120 kVp, tube current of reference 61 mAs, and pitch factor of 1.2. The automatic tube current modulation (CareDose 4 D) system was used and the automatic tube voltage selection (Care kV) was activated on the “non-enhanced” setting. For ULD-CT acquisition, both the tubes worked at 100 kVp with .6 mm tin filter (100Sn kVp, for spectral shaping), with wide collimation (2 × 192 × .6 mm), a rotation time of .25 s, an ultra-long pitch (pitch = 3, Turbo Flash mode, Siemens Healthineers), with modulated mA at 70 mAs reference. Effective radiation dose was calculated by multiplying the dose-length product by .014 mSv/mGy x cm, as the constant k-value for thoracic imaging. For both protocols, raw data were reconstructed at 3 mm slice thickness by convolutional nucleus B157, Br54 (Br40, moderately smooth). To reduce the image noise, Advanced Modeled Iterative Reconstruction (ADMIRE) strength of 3 was used. All reconstructions were performed with a matrix size of 512 × 512 pixels. Figure 1 shows CD-CT and ULD-CT images of the same patient, where different noise levels can visually appreciate.
Figure 1.
CD-CT and ULD-CT comparison on the same COVID-19 patient. (a) A CD-CT axial slice (100kVp, 47 mAs, Bl57), (b) A ULD-CT axial slice (100kVp, 84 mAs, Bl57).
Data Analysis
For each subject, COVID-19 pneumonia lesion segmentation has been executed on imaging data acquired with both CD-CT and ULD-CT protocols. Four AI tools based on deep neural networks have been used: BCUnet, CORADS AI, CT Pneumonia Analysis, and NVIDIA CLARA Train SDK. All these tools have been validated only for research purposes and not for clinical use. The architecture and the design of each AI system are described in the following paragraphs.
BCUnet
BCUnet is a deep neural network for the segmentation of pulmonary lesions in thoracic non-contrast CT images. The algorithm is based on a U-net architecture. 29 The model has been trained with a supervised DL technique. Each image included in the dataset is associated with a manual annotation of the lesion. The training dataset consists of 199 annotated CT images of COVID-19 patients, provided by the COVID-19 Lung CT Lesion Segmentation Grand Challenge-2020. 30 In particular, the innovative contribution that characterizes BCUnet is the introduction of an image masking technique and a data augmentation technique, which provides additional images for training the network by adding Gaussian noise and images deformed with an atlas-based method. The model was implemented in Python 3.6, using Tensorflow 2.3 and Keras as frameworks. The MobileNetV2 network weights have been made available by Tensorflow. The code for the CLAHE algorithm is contained in the scikit-image library.
CORADS AI
COVID-19 Reporting and Data AI System (CORADS AI) is a standardized chest CT scoring system that, after segmentation, automatically assigns scores from 1 to 5 that increase with the level of suspicion of COVID-19. 31 This algorithm was developed by the Diagnostic Image Analysis Group, Amsterdam University Medical Center, Fraunhofer MEVIS, and Thirona. For any detail, see https://grand-challenge.org/algorithms/corads-ai/. In the following analysis, the used annotation is CORADS.
NVIDIA CLARA Train SDK
Clara Training Framework is a package-level application of NVIDIA Clara Train Software Development Kit (SDK), a python-based SDK that allows developers to seek faster implementation of medical-specific DL solutions by leveraging optimized, ready-to-use and pre-trained built in-house NVIDIA models. These pre-trained models are packaged as medical model repositories (MMARs) and contain the scripts needed for model development activities. The collection includes pre-trained models for CT lung segmentation, COVID-19 classification in chest studies, and a CT annotated lung model. In this work two CLARA models have been used:(i) lung segmentation (https://ngc.nvidia.com/catalog/models/nvidia:med:clara_train_covid19_ct_lung_seg) and (ii) COVID-19 CT lesion segmentation (https://ngc.nvidia.com/catalog/models/nvidia:med:clara_pt_covid19_ct_lesion_segmentation). In the following analysis, the used annotation is CLARA.
CT Pneumonia Analysis
CT Pneumonia Analysis, syngo.via Frontier prototype, is an interactive platform for pneumonia analysis developed by Siemens Healthineers, 32 https://www.siemens-healthineers.com/medical-imaging/digital-transformation-of-radiology/ai-covid-19-algorithm) to automatically identify and quantify hyperdense lung regions on lung CT scans, facilitating their analysis and evaluation. CT Pneumonia Analysis performs the automated analysis of pulmonary opacities on axial CT data (section thicknesses up to 5 mm), with the possibility of introducing, through the manual segmentation tool, any additions or changes to the automatically generated masks. In the following analysis the used annotation is Pneumonia.
Statistical Analysis
For each patient, COVID-19 volume percentage (CV%) has been calculated considering the COVID-19 lung lesion volume on the total lung volume, as obtained by each AI segmentation tool. The CV% has been estimated on both CD-CT and ULD-CT considering two different convolutional kernels for image reconstruction, that is, Bl57 and Br40, maintaining a 3 mm CT slice thickness and a denoise level of three. Under these conditions, first, a Shapiro test has been implemented to assert the normality data distribution. 33 Moreover, according to Shapiro results, a Kruskal–Wallis (KW) test 34 has been performed to assess the difference between the AI-based segmentation tools on CD-CT and ULD-CT, with a subsequent Dunn’s post hoc test 35 to determine which tools differ. To graphically understand data trend and distribution relating to single protocols and single AI segmentation algorithms, boxplots have been realized, denoting the median, the 25th to 75th percentiles (boxes) and the minimum to the maximum outliers. A quantitative analysis has been evaluated to prove the correlation between CD and ULD-CT protocols in CV% parameter, applying the Spearman’s correlation coefficient test, 36 figuring the relative heatmap. To strengthen the comparison, the pairwise Bland-Altman (BA) test 37 has been carried out to describe the agreement between the two quantitative protocol measurements, that is, CD-CT CV% and ULD-CT CV% values, with respect to AI tools. To quantify the aforementioned agreement, some constraints have been needed: the mean and the standard deviation (STD) of the differences between the two measurements (mean −1.96 std/mean +1.96 std). A BA graphical approach has been used. For the sake of in-depth analysis, all the statistics have been repeated on data generated by BCUnet and CORADS tools implementing the lung lesion segmentation lobe by lobe. The lung lobe segmentation has been included because of the importance of knowing the location and distribution of COVID-19 lung disease, which can help in determining the most suitable treatment. 38 Under the same previous conditions, CV% has been calculated for each lung lobe, naming differently as LLL%, the left lower lobe COVID-19 volume percentage; LUL%, the left upper lobe COVID-19 volume percentage; RLL%, the right lower lobe COVID-19 volume percentage; RML%, the right medium lobe COVID-19 volume percentage; and RUL%, the right upper lobe COVID-19 volume percentage. These percentages were obtained for both protocols (CD-CT and ULD-CT). All the statistical analyses have been performed using Python libraries, in particular PyCompare module, SciPy library, Pingouin, and scikit_posthocs packages. The results have been considered statistically significant for P-value less than .05.
Results
The Shapiro test has been applied to check the normal tendency of data distribution, including all kernel reconstructions. It has been evaluated per each AI-based segmentation tool with respect to both protocols. Table 1 shows Shapiro test results in terms of W statistic and P-value.
Table 1.
Shapiro test results, in terms of W statistic and P-value, for all AI-based segmentation tools considering both CD-CT and ULD-CT protocols.
| BCUnet CD | BCUnet ULD | CORADS CD | CORADS ULD | CLARA CD | CLARA ULD | Pneumonia CD | Pneumonia ULD | |
|---|---|---|---|---|---|---|---|---|
| W Statistic | .971 | .961 | .591 | .681 | .892 | .814 | .663 | .591 |
| P-value | .9028 | .8203 | .0001* | .0014* | .2437 | .0403* | .0009* | .0001* |
*indicates significance with P < .05
As it can be noticed in Table 1, CORADS and Pneumonia data (both CD-CT and ULD-CT) and CLARA ULD-CT data do not follow a Gaussian distribution (P-value < .05). Since most AI segmentation algorithms have generated non-Gaussian data, all data have been considered non-parametric.
The result of the KW test rejects the null hypothesis with a H statistic of 182.19 and P-value less than .001, meaning that the used algorithms differ. Regarding the Dunn’s post hoc test, Table 2 and Table 3 show the obtained results relative to CD-CT and ULD-CT data, respectively.
Table 2.
Dunn’s test results for all AI-based segmentation tools on CD-CT data.
| CD-CT P-value | BCUnet | CORADS | CLARA | Pneumonia |
|---|---|---|---|---|
| BCUnet | 1.000000e+00 | 4.272311e−28* | 6.949754e−25* | 3.915073e−29* |
| CORADS | 4.272311e−28 | 1.000000e+00 | 1.000000e+00 | 1.000000e+00 |
| CLARA | 6.949754e−25 | 1.000000e+00 | 1.000000e+00 | 1.000000e+00 |
| Pneumonia | 3.915073e−29 | 1.000000e+00 | 1.000000e+00 | 1.000000e+00 |
*indicates significance with P < .01. Highlighted row represents which algorithm differs.
Table 3.
Dunn’s test results for all AI-based segmentation tools on ULD-CT data.
| ULD-CT P-value | BCUnet | CORADS | CLARA | Pneumonia |
|---|---|---|---|---|
| BCUnet | 1.000000e+00 | 4.428678e−13* | 2.784633e−17* | 2.176567e−37* |
| CORADS | 4.428678e−13 | 1.000000e+00 | 1.000000e+00 | 3.274795e−07 |
| CLARA | 2.784633e−17 | 1.000000e+00 | 1.000000e+00 | 1.255710e-04 |
| Pneumonia | 2.176567e−37* | 3.274795e−07* | 1.255710e−04* | 1.000000e+00 |
* indicates significance with P < .01. Highlighted rows represent which algorithm differs.
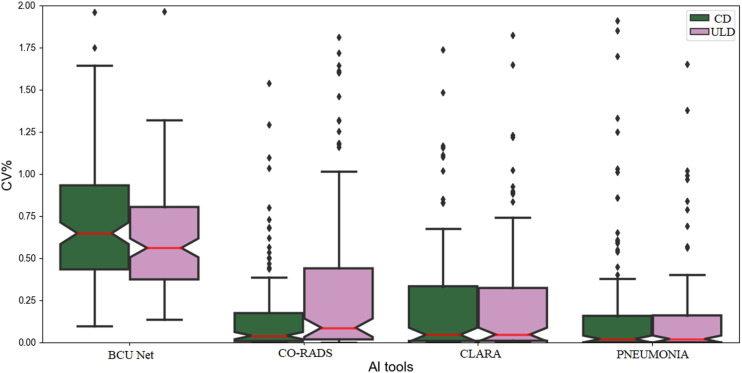
According to P-values in Table 2, BCUnet differs from the other tools (P-value < .01 rejects the null hypothesis of no differences) meaning that CORADS, CLARA and Pneumonia tools generate similar CD-CT CV% values. Instead, in Table 3 it is highlighted that BCUnet and Pneumonia tools differ on ULD-CT CV% values estimation. Therefore, although the segmentation results have been generated by different AI algorithms, it has been demonstrated that these algorithms give comparable results, in terms of CV% values, regardless of the CT dose protocols. In fact, for a qualitative demonstration, Figure 2 shows that the resulting CV% values distributions of each AI tool are comparable for both dose protocols. The non-Gaussian nature of the data can be also observed, according to Shapiro results. Moreover, the overall trend of the boxplots matches the results of Dunn’s test.
Figure 2.
CD-CT and ULD-CT boxplots for all AI-based segmentation tools. Green boxplots represent CD-CT CV% values, while pink boxplots represent ULD-CT CV% values. The red line is the median value of plotted data; the bars are the relative standard deviations and the dots are the outliers.
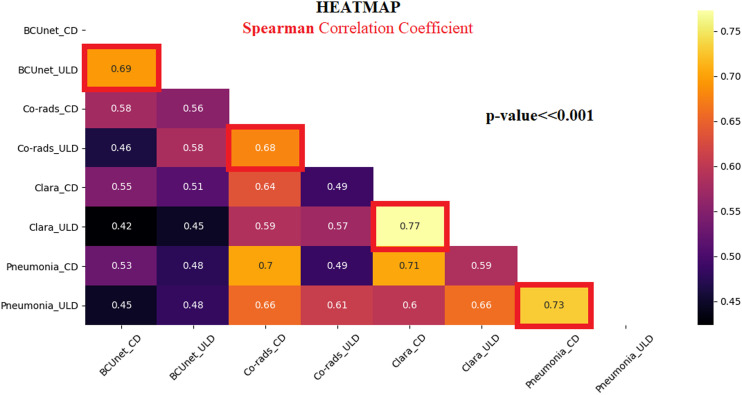
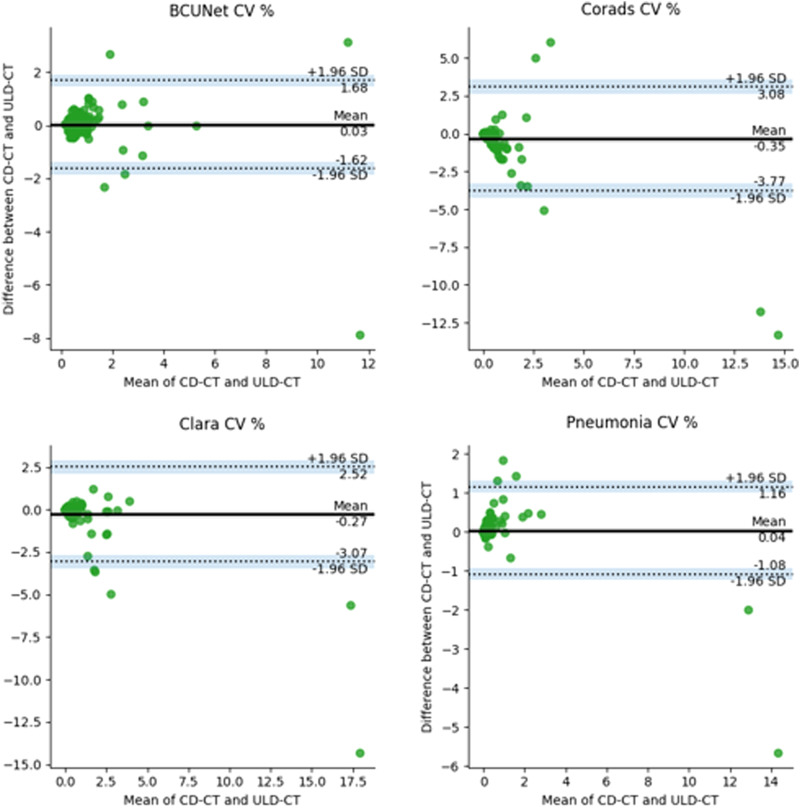
Regarding the correlation analysis, Spearman correlation coefficients (R) have been carried out showing that all correlation coefficients are statistically significant. Figure 3 shows the heatmap of R values. The red-squared correlation coefficients refer to CD and ULD-CT CV% values obtained by the same AI-based segmentation tool, highlighting a strong correlation (R > .6), meaning that ULD-CT protocol can be used for a CV% estimation comparable to CD-CT protocol, using all AI algorithms. To strengthen this result, the pairwise (CD-CT and ULD-CT protocols) BA test has been applied on each AI-based segmentation tool. Figure 4 shows BA results considering CD and ULD-CT CV% values, averaged over all patients. The bias has been computed as the value determined by one CD-CT CV% minus the value determined by the corresponding ULD-CT. The green dots represent the paired difference between CD and ULD CV% values; the bold line is the mean of all differences. As the plots in Figure 4 illustrate, the mean is around zero per each tool, confirming that the bias (distance between zero line and mean line) is negligible. Moreover, except for some outliers, most green dots do not exceed the maximum allowed difference limits, according to which the differences within mean ± 1.96 SD are considered not relevant, demonstrating that the segmentation algorithms can work similarly if they use CD-CT data and ULD-CT ones.
Figure 3.
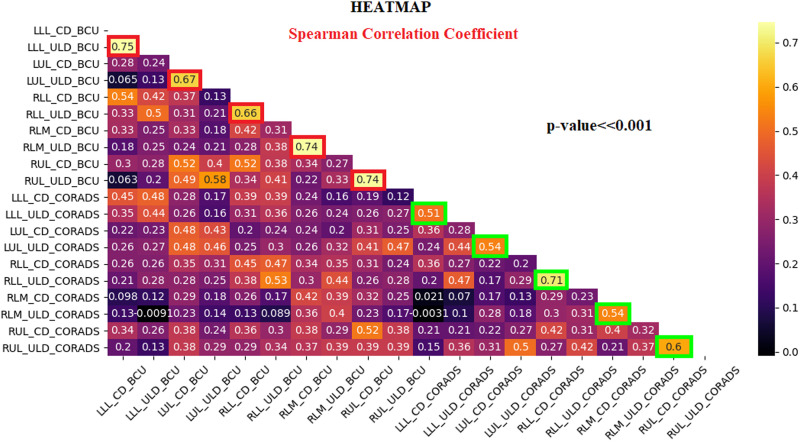
Spearman correlation coefficient heatmap. R values range in [−1, 1] interval.
Figure 4.
BA plots generated using paired values, that is, CD-CT and ULD-CT CV% values, obtained from BCUnet, CORADS, CLARA, and Pneumonia tools. The black line is the mean of differences between two measurements; the dashed lines represent the test constraints (mean −1.96 std/mean +1.96 std) and the dots are the paired differences of the two measurements (both dose protocols) for each patient.
After reaching the previous results from CV% data calculated with AI segmentation algorithms on total lungs, these assays have been verified on data obtained with lung lobe lesion segmentation algorithms, using BCUnet and CORADS tools. Data under statistics were the lung lobe COVID-19 lesion volume percentage for each patient and each protocol, as explained in “Statistical analysis” section. Hence, data have been proved non-parametric according to the Shapiro test (P < .01), and also using lobe segmentation, BCUnet and CORADS tools result different according to the KW test. Since we implemented only two AI tools for lung lobe segmentation, Dunn’s test has not been applied. Considering correlation analysis, LLL%, LUL%, RLL%, RLM%, and RUL% data show significant R values, between CD-CT and ULD-CT protocol, greater than .66 for BCUnet tool (red squares in Figure 5) and greater than .51 for CORADS tool (green squares in Figure 5).
Figure 5.
Spearman correlation coefficient heatmap for lung lobe lesions volume percentage on CD and ULD-CT protocols. R values range in [−1, 1] interval.
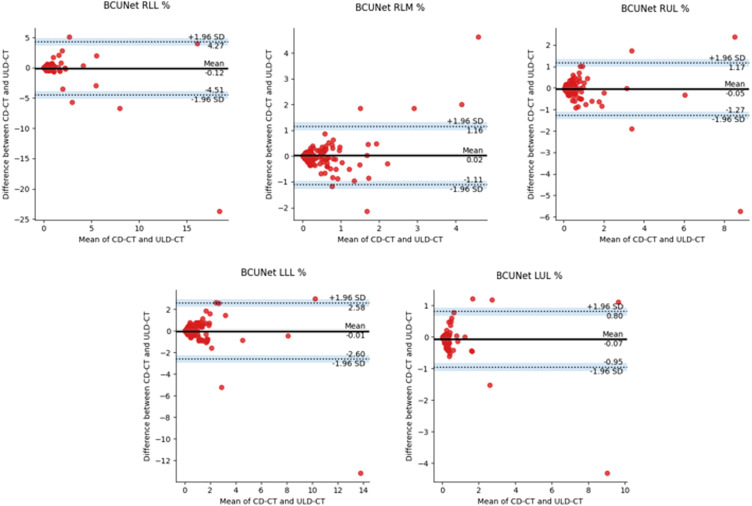
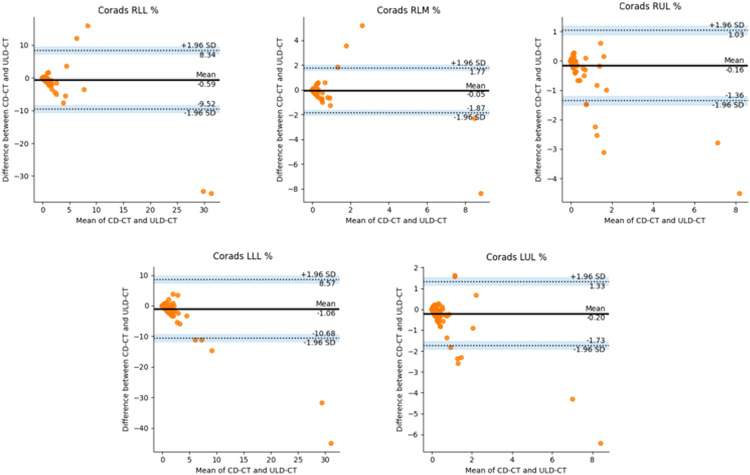
In Figure 6, BA plots on LLL%, LUL%, RLL%, RLM%, and RUL% of BCUnet tool are presented. The paired measurements are contained in the allowed limits. OnlyRLM% BA plot shows more scattered data, always staying in the confidence interval limits. In Figure 7, BA plots on LLL%, LUL%, RLL%, RLM%, and RUL% of CORADS tool are shown. As in the previous plots, a low bias is obtained and paired measurements are contained in the allowed limits, as explained in the captions of Figure 6 and Figure 7. These last results confirm that AI-based segmentation tools took out comparable outcomes when obtained on both CD-CT and ULD-CT data.
Figure 6.
BA plots generated using paired values, examined on LLL%, LUL%, RLL%, RLM%, and RUL% of BCUnet tool. The black line is the mean of differences between two measurements; the dashed lines represent the test limits (mean −1.96 std/mean +1.96 std) and the dots are the paired differences of the two measurements (both dose protocols) for each patient.
Figure 7.
BA plots generated using paired values, examined on LLL%, LUL%, RLL%, RLM%, and RUL% of CORADS tool. The black line is the mean of differences between two measurements; the dashed lines represent the test limits (mean −1.96 std/mean +1.96 std) and the dots are the paired differences of the two measurements (both dose protocols) for each patient.
Discussion
AI-based tools supporting radiological evaluation can offer significant benefit in clinical practice. COVID-19 pandemic has led to the development and refinement of AI algorithms for disease diagnosis and monitoring, in particular for the automation of lesion segmentations on CT images. However, the reliability of AI-based techniques requires careful evaluation of the reproducibility with respect to the use of different acquisition techniques. Furthermore, lack of knowledge of COVID-19 disease felt the need to increase monitoring for fast diagnosis and reliable prevention, leading patients to greater radiological exposure. Thus, low dose protocols for CT scans have been implemented. 20
In this work, the agreement of AI-based COVID-19 lung lesions segmentation methods between chest CT images acquired following both CD-CT and ULD-CT protocols has been evaluated for the first time. Four different DL-based segmentation tools, trained on CD-CT protocol images, have been considered. The CV% parameter has been calculated on both dose protocols data, allowing such statistical inferences. First of all, the data showed on average a behavior far from a Gaussian distribution, thus implementing non-parametric tests (e.g., KW test). The AI tools have been pairwise compared to estimate their differences when applied on both dose protocols. As shown by the Spearman correlation coefficients (R > .6 and P-value < .05), a good agreement between CD and ULD-CT CV% values has resulted, confirmed by the BA test (Figure 4). However, although the lack of diagnostic support tools trained on specific ULD-CT data, it does not represent a critical limitation, since suitability of AI tools designed on conventional datasets have been proved. Besides, the reliability of ULD protocols has been already demonstrated on comparable diagnostic performance evaluation for viral pneumonia detection on CT images,39-41 but these results can consolidate the role of ULD-CT in clinical routine with the undeniable advantage of high dose reduction rate. This study should be considered as a preliminary investigation, since it requires further development for a comprehensive evaluation. Indeed, the application of retrospective noise reduction algorithms 42 should be evaluated to improve the results of conventional algorithms on ULD-CT data. In addition, the inclusion of ULD-CT data for AI model training should be assessed. Noteworthy, the patients’ body mass index (BMI) may have a considerable effect on the signal to noise ratio of the resulting ULD-CT images,43,44 and consequently on the analyzed algorithms’ results. The influence of BMI on the results agreement relative to both ULD-CT and CD-CT protocols deserves to be further investigated.
Among the examinations considered, a limitation of the present study is an unrevealed quantifiable lesion load. In order to mitigate this limitation, two different segmentation tasks have been considered, that is, lung and lobes segmentation. Although it is a very specific work, our approach can also be applied to other anatomical sectors, analyzing different classification tasks.45-50 In conclusion, this work investigates the applicability of automatic segmentation techniques, trained on CD-CT protocol, to the images acquired in ULD mode. This preliminary study confirms the suitability of available AI-based segmentation tools on ULD-CT data, for supporting diagnosis and quantification of COVID-19 lung lesions.
Footnotes
Authors Contributions: MA and CC: conceived and designed the work. DB and CC: CT acquisition. GE, MV, MA, DB, MR: data elaboration and analysis; MA, GE: writing and editing; CC, MS: revision.
Declaration of Conflicting Interests: The authors declared no potential conflicts of interest with respect to the research, authorship, and/or publication of this article.
Funding: The authors disclosed receipt of the following financial support for the research, authorship, and publication of this article: This work was partially funded by the Italian Ministry of Health for the “Ricerca Corrente” project and by POR CAMPANIA FESR 2014 - 2020 for the “Protocolli TC del torace a bassissima dose e tecniche di intelligenza artificiale per la diagnosi precoce e quantificazione della malattia da COVID-19” project.
ORCID iDs
Marco Aiello https://orcid.org/0000-0002-3676-0664
Dario Baldi https://orcid.org/0000-0001-7464-4499
Carlo Cavaliere https://orcid.org/0000-0002-3297-2213
References
- 1.WHO dashboard, consulted on 08/04/2021. https://covid19.who.int/.
- 2.Tahamtan A, Ardebili A. Real-time RT-PCR in COVID-19 detection: issues affecting the results. Expert Rev Mol Diagn. 2020; 20: 453-454. doi: 10.1080/14737159.2020.1757437. [DOI] [PMC free article] [PubMed] [Google Scholar]
- 3.Chung M, Bernheim A, Mei X, et al. CT imaging features of 2019 novel coronavirus (2019-nCoV). Radiology. 2020;295:202-207. doi: 10.1148/radiol.2020200230. [DOI] [PMC free article] [PubMed] [Google Scholar]
- 4.Huang G, Gong T, Wang G, et al. Timely diagnosis and treatment shortens the time to resolution of coronavirus disease (COVID-19) pneumonia and lowers the highest and last CT scores from sequential chest CT. Am J Roentgenol. 2020;215:367-373. doi: 10.2214/AJR.20.23078. [DOI] [PubMed] [Google Scholar]
- 5.Bandirali M, Sconfienza LM, Serra R, et al. Chest radiograph findings in asymptomatic and minimally symptomatic quarantined patients in codogno, Italy during COVID-19 pandemic. Radiology. 2020;295:E7. doi: 10.1148/radiol.2020201102. [DOI] [PMC free article] [PubMed] [Google Scholar]
- 6.Rubin GD, Ryerson CJ, Haramati LB, et al. The role of chest imaging in patient management during the COVID-19 pandemic: a multinational consensus statement from the fleischner society. Radiology. 2020;296(1):172-180. doi: 10.1148/radiol.2020201365. [DOI] [PMC free article] [PubMed] [Google Scholar]
- 7.WHO publications , consulted on 08/04/2021, ‘’Use of chest imaging in COVID19”. https://www.who.int/publications/i/item/use-of-chest-imaging-in-covid-19
- 8.Brenner DJ, Elliston CD, Hall EJ, Berdon WE. Estimated risks of radiation-induced fatal cancer from pediatric CT. AJR Am J Roentgenol. 2001;176:289-296. doi: 10.2214/ajr.176.2.1760289. [DOI] [PubMed] [Google Scholar]
- 9.Greess H, Wolf H, Baum U, et al. Dose reduction in computed tomography by attenuation-based on-line modulation of tube current: evaluation of six anatomical regions. Eur Radiol. 2000;10:391-394. doi: 10.1007/s003300050062. [DOI] [PubMed] [Google Scholar]
- 10.Toth TL. Dose reduction opportunities for CT scanners. Pediatr Radiol. 2002;32:261-267. doi: 10.1007/s00247-002-0678-7. [DOI] [PubMed] [Google Scholar]
- 11.Haaga JR. Radiation dose management. Am J Roentgenol. 2001;177:289-291. doi: 10.2214/ajr.177.2.1770289. [DOI] [PubMed] [Google Scholar]
- 12.Diederich S, Lenzen H, Windmann R, et al. Pulmonary nodules: experimental and clinical studies at low-dose CT. Radiology. 1999;213:289-298. doi: 10.1148/radiology.213.1.r99oc29289. [DOI] [PubMed] [Google Scholar]
- 13.Jurik AG, Jessen KA, Hansen J. Image quality and dose in computed tomography. Eur Radiol. 1997;7:77-81. doi: 10.1007/s003300050114. [DOI] [PubMed] [Google Scholar]
- 14.Mayo JR, Hartman TE, Lee KS, Primack SL, Vedal S, Müller NL. CT of the chest: minimal tube current required for good image quality with the least radiation dose. Am J Roentgenol. 1995;164:603-607. doi: 10.2214/ajr.164.3.7863879. [DOI] [PubMed] [Google Scholar]
- 15.Naidich DP, Marshall CH, Gribbin C, Arams RS, McCauley DI. Low-dose CT of the lungs: preliminary observations. Radiology. 1990;175:729-731. doi: 10.1148/radiology.175.3.2343122. [DOI] [PubMed] [Google Scholar]
- 16.Rusinek H, Naidich DP, McGuinness G, et al. Pulmonary nodule detection: low-dose versus conventional CT. Radiology. 1998;209:243-249. doi: 10.1148/radiology.209.1.9769838. [DOI] [PubMed] [Google Scholar]
- 17.Ware DE, Huda W, Mergo PJ, Litwiller AL. Radiation effective doses to patients undergoing abdominal CT examinations. Radiology. 1999; 210:645-650. doi: 10.1148/radiology.210.3.r99mr05645. [DOI] [PubMed] [Google Scholar]
- 18.Baldi D, Tramontano L, Alfano V, Punzo B, Cavaliere C, Salvatore M. Whole body low dose computed tomography using third-generation dual-source multidetector with spectral shaping: protocol optimization and literature review. Dose-Response. 2020. Dec 29;18(4). doi: 10.1177/1559325820973131. [DOI] [PMC free article] [PubMed] [Google Scholar]
- 19.Schaal M, Severac F, Labani A, Jeung MY, Roy C, Ohana M. Diagnostic performance of ultra-low-dose computed tomography for detecting asbestos-related pleuropulmonary diseases: prospective study in a screening setting. PLoS One. 2016;11:e0168979. doi: 10.1371/journal.pone.0168979. [DOI] [PMC free article] [PubMed] [Google Scholar]
- 20.Dangis A, Gieraerts C, De Bruecker Y, et al. Accuracy and reproducibility of low-dose submillisievert chest CT for the diagnosis of COVID-19. Radiology: Cardiothoracic Imaging. 2020;2:e200196. doi: 10.1148/ryct.2020200196. [DOI] [PMC free article] [PubMed] [Google Scholar]
- 21.Aggarwal R, Sounderajah V, Martin G, et al. Diagnostic accuracy of deep learning in medical imaging: a systematic review and meta-analysis. NPJ digital medicine. 2021;4:65-23. doi: 10.1038/s41746-021-00438-z. [DOI] [PMC free article] [PubMed] [Google Scholar]
- 22.Lundervold AS, Lundervold A. An overview of deep learning in medical imaging focusing on MRI. Z Med Phys. 2019;29:102-127. doi: 10.1016/j.zemedi.2018.11.002. [DOI] [PubMed] [Google Scholar]
- 23.Saba L, Agarwal M, Patrick A, et al. Six artificial intelligence paradigms for tissue characterisation and classification of non-COVID-19 pneumonia against COVID-19 pneumonia in computed tomography lungs. Int J CARS. 2021;16(3):423-434. doi: 10.1007/s11548-021-02317-0. [DOI] [PMC free article] [PubMed] [Google Scholar]
- 24.Kermany DS, Goldbaum M, Cai W, et al. Identifying medical diagnoses and treatable diseases by image-based deep learning. Cell. 2018;172:1122-1131. e9 doi: 10.1016/j.cell.2018.02.010. [DOI] [PubMed] [Google Scholar]
- 25.Rajaraman S, Candemir S, Kim I, Thoma G, Antani S. Visualization and interpretation of convolutional neural network predictions in detecting pneumonia in pediatric chest radiographs. Appl Sci. 2018;8:1715. doi: 10.3390/app8101715. [DOI] [PMC free article] [PubMed] [Google Scholar]
- 26.Li L, Qin L, Xu Z, et al. Using artificial intelligence to detect COVID-19 and community-acquired pneumonia based on pulmonary CT: evaluation of the diagnostic accuracy. Radiology. 2020;296:E65-E71. doi: 10.1148/radiol.2020200905. [DOI] [PMC free article] [PubMed] [Google Scholar]
- 27.Harmon SA, Sanford TH, Xu S, et al. Artificial intelligence for the detection of COVID-19 pneumonia on chest CT using multinational datasets. Nat Commun. 2020;11:4080. doi: 10.1038/s41467-020-17971-2. [DOI] [PMC free article] [PubMed] [Google Scholar]
- 28.Wang J, Wu CJ, Bao ML, Zhang J, Wang XN, Zhang YD. Machine learning-based analysis of MR radiomics can help to improve the diagnostic performance of PI-RADS v2 in clinically relevant prostate cancer. Eur Radiol. 2017;27:4082-4090. doi: 10.1007/s00330-017-4800-5. [DOI] [PubMed] [Google Scholar]
- 29.Ronneberger O, Fischer P, Brox T. U-net: convolutional networks for biomedical image segmentation. Presented at the MICCAI. 2015;9351:234-241. [Google Scholar]
- 30.Roth H, Xu Z, Diez CT, et al. Rapid artificial intelligence solutions in a pandemic - the COVID-19-20 lung CT lesion segmentation challenge. Res Sq. 2021;1:571332. doi: 10.21203/rs.3.rs-571332/v1. [DOI] [PMC free article] [PubMed] [Google Scholar]
- 31.Lessmann N, Sánchez CI, Beenen L, et al. Automated assessment of CO-RADS and chest CT severity scores in patients with suspected COVID-19 using artificial intelligence. Radiology. 2020;298(1):202439. doi: 10.1148/radiol.2020202439. [DOI] [PMC free article] [PubMed] [Google Scholar]
- 32.Chaganti S, Grenier P, Balachandran A, et al. Automated quantification of CT patterns associated with COVID-19 from chest CT. Radiol Artif Intell. 2020;2:e200048. doi: 10.1148/ryai.2020200048. [DOI] [PMC free article] [PubMed] [Google Scholar]
- 33.Shapiro SS, Wilk MB. An analysis of variance test for normality (complete samples). Biometrika. 1965;52:591-611. [Google Scholar]
- 34.Kruskal WH, Wallis WW. Use of ranks in one-criterion variance analysis. J Am Stat Assoc. 1952;47(Issue 260):583-621. [Google Scholar]
- 35.Dunn OJ. Multiple comparisons using rank sums. Technometrics. 1964;6:241-252. [Google Scholar]
- 36.Zwillinger D, Kokoska S. CRC Standard Probability and Statistics Tables and Formulae. New York:Chapman & Hall;2000:7. Section 14. [Google Scholar]
- 37.Altman DG, Bland JM. Measurement in medicine: the analysis of method comparison studies. Journal of the Royal Statistical Society. Series D (The Statistician). 1983;32:307-317. doi: 10.2307/2987937. [DOI] [Google Scholar]
- 38.Tang H Zhang C and Xie X. Automatic pulmonary lobe segmentation using deep learning. In: 2019 IEEE 16th international symposium on biomedical imaging (ISBI 2019) 2019;1225-1228. doi: 10.1109/ISBI.2019.8759468. [DOI] [Google Scholar]
- 39.Argentieri G, Bellesi L, Pagnamenta A, et al. Diagnostic yield, safety, and advantages of ultra-low dose chest CT compared to chest radiography in early stage suspected SARS-CoV-2 pneumonia. Medicine. 2021;100:e26034. doi: 10.1097/MD.0000000000026034. [DOI] [PMC free article] [PubMed] [Google Scholar]
- 40.Greffier J, Hoballah A, Sadate A, et al. Ultra-low-dose chest CT performance for the detection of viral pneumonia patterns during the COVID-19 outbreak period: a monocentric experience. Quant Imag Med Surg. 2021;11:3190-3199. doi: 10.21037/qims-20-1176. [DOI] [PMC free article] [PubMed] [Google Scholar]
- 41.Zarei F, Jalli R, Chatterjee S, et al. Evaluation of Ultra Low Dose Chest CT Imaging for Covid 19 Diagnosis and Follow up; 2020. arXiv:2005.03347 [physics]. [Google Scholar]
- 42.Mohammadinejad P, Mileto A, Yu L, et al. CT noise-reduction methods for lower-dose scanning: strengths and weaknesses of iterative reconstruction algorithms and new techniques. Radiographics. 2021;41:1493-1508. doi: 10.1148/rg.2021200196. [DOI] [PubMed] [Google Scholar]
- 43.Qurashi AA, Rainford LA, Alhazmi FH, et al. Low radiation dose implications in obese abdominal computed tomography imaging. Appl Sci. 2021;11:2456. doi: 10.3390/app11062456. [DOI] [Google Scholar]
- 44.Qurashi AA, Rainford LA, Alshamrani KM, Foley SJ. The impact of obesity on abdominal Ct radiation dose and image quality. Radiat Prot Dosimetry. 2019;185:17-26. doi: 10.1093/rpd/ncy212. [DOI] [PubMed] [Google Scholar]
- 45.Ahn Y, Yoon JS, Lee SS, et al. Deep learning algorithm for automated segmentation and volume measurement of the liver and spleen using portal venous phase computed tomography images. Korean J Radiol. 2020;21:987-997. doi: 10.3348/kjr.2020.0237. [DOI] [PMC free article] [PubMed] [Google Scholar]
- 46.Borrelli P, Kaboteh R, Enqvist O, et al. Artificial intelligence-aided CT segmentation for body composition analysis: a validation study. European Radiology Experimental. 2021;5:11. doi: 10.1186/s41747-021-00210-8. [DOI] [PMC free article] [PubMed] [Google Scholar]
- 47.Lee H, Troschel FM, Tajmir S, et al. Pixel-level deep segmentation: artificial intelligence quantifies muscle on computed tomography for body morphometric analysis. J Digit Imag. 2017;30:487-498. doi: 10.1007/s10278-017-9988-z. [DOI] [PMC free article] [PubMed] [Google Scholar]
- 48.Lindgren Belal S, Sadik M, Kaboteh R, et al. Deep learning for segmentation of 49 selected bones in CT scans: first step in automated PET/CT-based 3D quantification of skeletal metastases. Eur J Radiol. 2019;113:89-95. doi: 10.1016/j.ejrad.2019.01.028. [DOI] [PubMed] [Google Scholar]
- 49.Paris MT. Body composition analysis of computed tomography scans in clinical populations: the role of deep learning. LFG. 2020;13:28-31. doi: 10.1159/000503996. [DOI] [PubMed] [Google Scholar]
- 50.Rister B, Yi D, Shivakumar K, Nobashi T, Rubin DL. CT-ORG, a new dataset for multiple organ segmentation in computed tomography. Sci Data. 2020;7:381. doi: 10.1038/s41597-020-00715-8. [DOI] [PMC free article] [PubMed] [Google Scholar]


