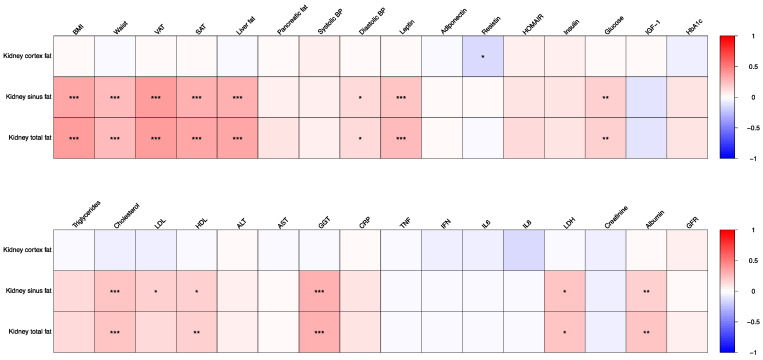
Figure 1.
Repeated measures correlations of kidney cortex fat, kidney sinus fat and kidney total fat over all time points (time points T0, T1, and T3 combined). The asterisks *, ** and *** represent p-values (after Bonferroni correction) of 0.05, 0.01 and 0.001, respectively. Abbreviations: LDL, low density lipoprotein, SAT, subcutaneous adipose tissue; BMI, body mass index; VAT, visceral adipose tissue, ALT, alanine aminotransferase; AST, aspartat aminotransferase, GGT, gamma glutamyl transferase, CRP, C-reactive protein, TNF, tumour necrosis factor, IFN, interferon, IL, Interleukin, LDH, lactate dehydrogenase.

