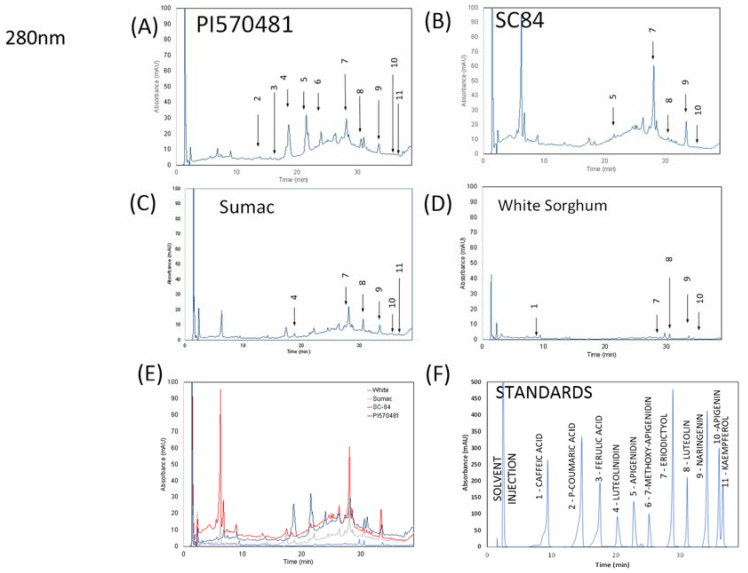
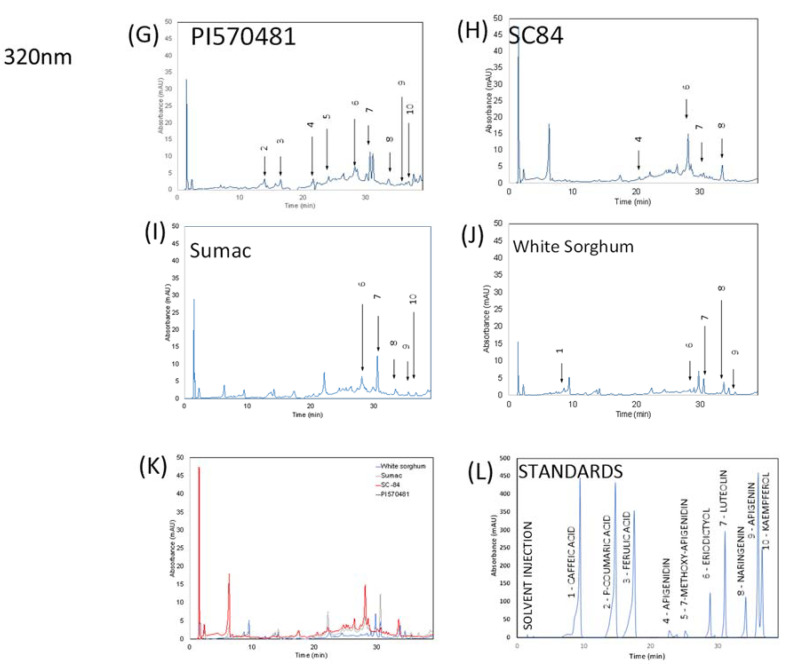
Figure 1.
HPLC analysis of sorghum extracts. The chromatograms of sorghum varieties (5 mg/mL of dried extract) at 280 nm (A–D), sorghum genotype chromatograms overlaid at 280 nm (E) and the mixture of standards (0.09 mg/mL) at 280 nm (F), (5 mg/mL of dried extract) at 320 nm (G–J), sorghum genotype chromatograms overlaid at 320 nm (K), and the mixture of standards (0.09 mg/mL) at 320 nm (L).


