

Abstract
Inhibition of the SARS-CoV-2 main protease (Mpro) is a major focus of drug discovery efforts against COVID-19. Here we report a hit expansion of non-covalent inhibitors of Mpro. Starting from a recently discovered scaffold (The COVID Moonshot Consortium. Open Science Discovery of Oral Non-Covalent SARS-CoV-2 Main Protease Inhibitor Therapeutics. bioRxiv 2020.10.29.339317) represented by an isoquinoline series, we searched a database of over a billion compounds using a cheminformatics molecular fingerprinting approach. We identified and tested 48 compounds in enzyme inhibition assays, of which 21 exhibited inhibitory activity above 50% at 20 μM. Among these, four compounds with IC50 values around 1 μM were found. Interestingly, despite the large search space, the isoquinolone motif was conserved in each of these four strongest binders. Room-temperature X-ray structures of co-crystallized protein–inhibitor complexes were determined up to 1.9 Å resolution for two of these compounds as well as one of the stronger inhibitors in the original isoquinoline series, revealing essential interactions with the binding site and water molecules. Molecular dynamics simulations and quantum chemical calculations further elucidate the binding interactions as well as electrostatic effects on ligand binding. The results help explain the strength of this new non-covalent scaffold for Mpro inhibition and inform lead optimization efforts for this series, while demonstrating the effectiveness of a high-throughput computational approach to expanding a pharmacophore library.
Keywords: SARS-CoV-2, drug discovery, main protease inhibitor, antiviral therapeutics, hit expansion
Introduction
The development of antiviral therapeutics is a major focus of COVID-19 research. The SARS-CoV-2 main protease, Mpro (3CLpro), is responsible for cleaving the viral polypeptide pp1a and pp1ab into functional protein subunits essential for viral replication. Because of this key role, and together with the low mutation rate of the active site2−6 which suggests that mutations will not broadly impact the efficacy of SARS-CoV-2 Mpro inhibitors, as well as a lack of homologous proteases in humans, Mpro is a prime target for antiviral drug discovery.4,7 Recent studies have confirmed the effectiveness of targeting Mpro for inhibiting viral replication.8−10 Several inhibitors of varying affinity have been discovered, including some with activities as low as 20 nM, by optimizing compounds based on structure–activity relationships (SARs).11,12 Pfizer has developed two Mpro inhibitors, PF-07321332 (Nirmatrelvir)13,14 and PF-07304814.15 The former is orally bio-available and has been authorized for emergency use in the USA with the cytochrome P450 3A4 inactivator Ritonavir under the brand name Paxlovid.16 The latter inhibitor is given intravenously and is currently in clinical trials.17 The PF-07321332 inhibitor has a kinetic inhibition constant (Ki) of 3.1 nM.14
For Mpro both covalent and non-covalent inhibitors have been discovered. We focus here on non-covalent inhibitors, which can act alone or provide starting points for optimized covalent and reversible covalent inhibitors.
Over the past two decades, efforts to develop non-covalent inhibitors of the main proteases of human coronaviruses such as MERS and SARS-CoV-1 have resulted in only a handful of non-covalent pharmacophores (scaffolds) that can be used to derive molecular series for optimization. These optimization efforts have resulted in relatively few non-covalent inhibitors with IC50 less than 1 μM in in vitro kinetic assays.18−20 We use as a starting point here selected results from the PostEra COVID Moonshot,1,21 which, through massive crowdsourcing and high-throughput experimental assays, has helped to discover a number of new motifs for non-covalent inhibitors with IC50 values below 2 μM. A large proportion of these are isoquinoline-containing compounds, such as four of the compounds shown in Figure 1. Crystal structures of many such compounds were determined through a collaboration between the Diamond Light Source XChem X-ray project and PostEra and were produced by high-throughput, automated methods. For all compounds in the isoquinoline series the isoquinoline nitrogen forms a strong hydrogen bond (2.6 Å to 2.8 Å) with His163 of Mpro. Another hydrogen bond can be formed between a carbonyl oxygen and Glu166 of Mpro; this interaction is also found in many of the compounds from this series. Of the 362 unique quinoline-containing compounds from the PostEra dataset, 327 experimentally measured fluorescence IC50 values have been reported. Of these, 179 have an IC50 under 5 μM, 48 between 5 and 20 μM, 23 between 20 and 30 μM, and 77 over 30 μM.
Figure 1.

Selected non-covalent inhibitors from the COVID-19 Moonshot project1 with PostEra COVID Moonshot molecule ID, and IC50 values, in μM. The starting compound for the present hit expansion effort is labeled in bold.
Having discovered inhibitors (hits), a next step in the hit-to-lead process can be hit expansion, in which chemically similar molecules are identified, assayed, and compared. Hit expansion aims at producing inhibitors of similar or increased activity to the original hit, expanding diversity beyond a particular scaffold, and extending understanding of SARs.22 High-throughput parallel expansion has been found to be effective in this regard.23 Furthermore, serendipitous findings arising from the addition of random diversity to the hit compounds often results in discoveries of novel and unpredictable mechanisms of action.24 These types of efforts can be automated and may include cheminformatics or other high-throughput modeling approaches.25 Here we explore the ability of a fingerprint-based, automated hit expansion method to produce new Mpro inhibitors starting from a parent inhibitor.
Results
As a starting compound for our expansion we selected the chiral COVID-19 Moonshot inhibitor MAT-POS-b3e365b9-1 (bold in Figure 1). This compound is an intermediate product of a manual, crowd-sourced SAR optimization strategy, in which a weak (IC50 ≈ 25 μM) aminopyridine SARS CoV-2 Mpro inhibitor was successively modified to include an isoquinoline and a halogen group. Then, an oxane moiety was added to the m-chlorophenyl group to allow for stereoselective binding of the inhibitor, and further improvement of the affinity to an IC50 = 80 nM was achieved by replacing the out-of-plane hydrogen of the aliphatic heterocycle with a methoxy group. This starting compound was the most potent non-covalent inhibitor characterized by the COVID-19 Moonshot project at the time our expansion was performed and compounds were ordered.
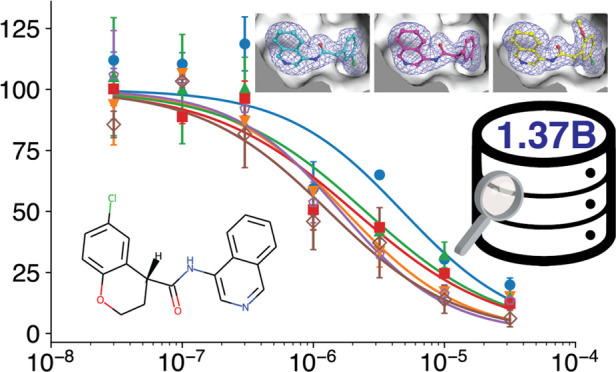
We performed the automated computational hit expansion by examining 1.37 billion compounds in the Enamine REAL library (including stereoisomers and tautomers), a database of commercially available drug-like fragments complying with Lipinki’s “rule of five” 26 and Veber criteria27 for orally active compounds (molecular weight ≤ 500 Da, SlogP ≤ 5, number of hydrogen bond acceptors ≤ 10, number of hydrogen bond donors ≤ 5, number of rotatable bonds ≤ 10, and total polar surface area ≤ 140 Å2).28
Enzymatic Activity Assays
We tested 48 compounds for activity against Mpro (Figure 2). Our screening yielded 26 novel inhibitors with less than 50% residual enzymatic activity in the primary screen at 20 μM, and 21 satisfying the same threshold in both the primary and the confirmation screens (cf. Figure 3 and Table 1). Of these, we selected five inhibitors (compounds 6, 12, 17, 19, and 21) with high Z-scores for further characterization. The hits include a compound already characterized by the COVID Moonshot project (compound 21, Moonshot ID ADA-UCB-6c2cb422-1) and four others that, to our knowledge, have not been characterized previously. These compounds have the isoquinoline group in common, with either halogen substitutions at the meta position of the phenyl group (compounds 6 and 19), a methoxy (compound 12), methyl (compound 19), or 5-bromo-2,3-dihydrofuran (compound 6) group instead of the oxane moiety, or the addition of a methanesulfonyl functional group (compound 17).
Figure 2.
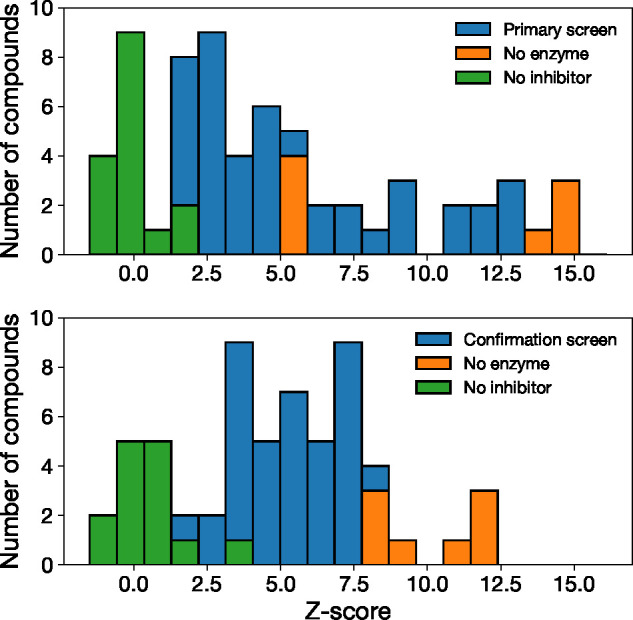
Activity of non-covalent SARS-CoV-2 Mpro inhibitors identified by scaffold expansion around MAT-POS-b3e365b9-1. Histogram of Z-scores from primary (top panel) and confirmation screend (bottom panel).
Figure 3.
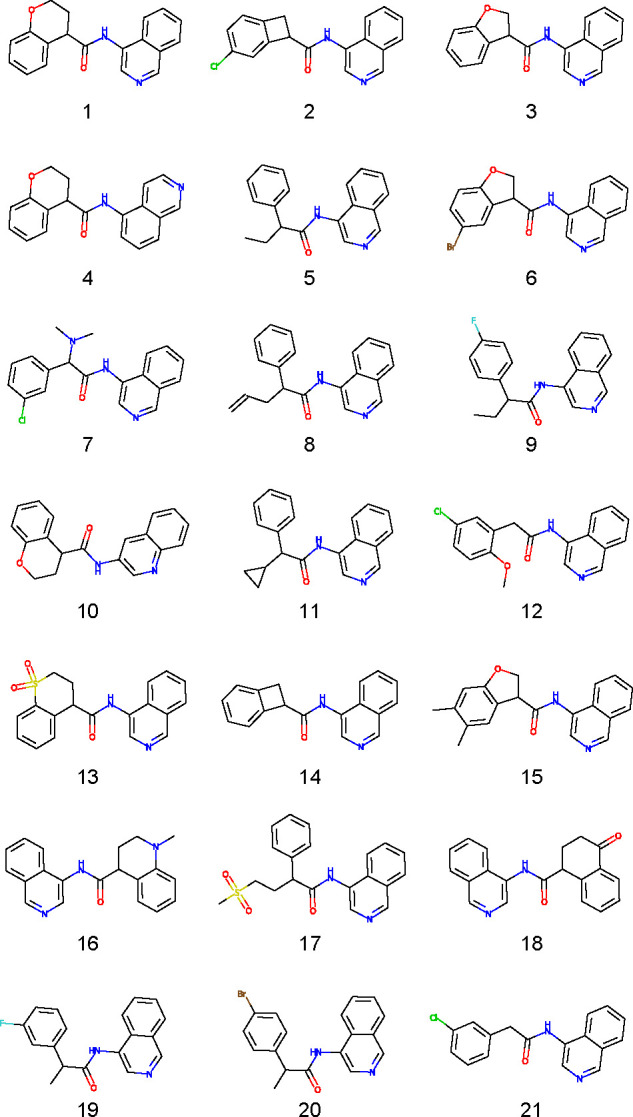
Top compounds assayed in the hit expansion with ≤50% residual activity at 20 μM.
Table 1. Activity of the Compounds Shown in Figure 3 against Mpro: Similarity to Starting Compound PostEra MAT-POS-b3e365b9-1, and Z-Scores from Primary and Confirmation Screen.
| compd | MAP4 | Z | Z (confirmation) |
|---|---|---|---|
| 1 | 0.6602 | 4.30 | 4.63 |
| 2 | 0.4404 | 8.50 | 5.01 |
| 3 | 0.4072 | 3.10 | 7.06 |
| 4 | 0.3867 | 2.80 | 5.96 |
| 5 | 0.3672 | 3.60 | 7.17 |
| 6 | 0.3652 | 5.00 | 7.73 |
| 7 | 0.3643 | 3.80 | 6.70 |
| 8 | 0.3340 | 9.00 | 5.54 |
| 9 | 0.3262 | 10.80 | 7.56 |
| 10 | 0.3232 | 4.30 | 8.06 |
| 11 | 0.3164 | 9.50 | 5.69 |
| 12 | 0.3018 | 5.00 | 11.67 |
| 13 | 0.2979 | 11.30 | 6.60 |
| 14 | 0.2910 | 4.50 | 6.97 |
| 15 | 0.2900 | 9.50 | 7.23 |
| 16 | 0.2891 | 2.70 | 5.53 |
| 17 | 0.2871 | 13.00 | 8.06 |
| 18 | 0.2871 | 12.00 | 6.54 |
| 19 | 0.2852 | 13.20 | 8.11 |
| 20 | 0.2842 | 11.90 | 6.86 |
| 21 | 0.2549 | 12.80 | 9.83 |
These five inhibitors were further characterized in a dose–response experiment (Figure 4). Consistent with the high similarity scores to the starting compound, the IC50 values of these inhibitors (Table 2) were also similar and between 1.6 and 4.8 μM, but not statistically different from the control compound 21 or from the micromolar inhibitor MCULE-5948770040.29
Figure 4.
Concentration curves of the top four inhibitors (solid symbols) and of control compounds 21 and MCULE-594877004029 (open symbols).
Table 2. Inhibitory Concentrations (IC50 Values) of the Compounds from Figure 4.
| compd | IC50 (μM) |
|---|---|
| 6 | 4.8 ± 3.4 |
| 12 | 1.8 ± 0.8 |
| 17 | 2.5 ± 2.1 |
| 19 | 2.1 ± 1.0 |
| 21 | 1.6 ± 0.7 |
| MCULE-5948770040 | 1.3 ± 0.7 |
Structure–Activity Relationship (SAR) from Similarity Search
Given the size of the screened database it is interesting that, among the 48 similar molecules tested, the most potent ones exhibit only minor modifications to the original scaffold retaining the isoquinoline, the halophenyl ring, and the amide bond connecting the two. These salient features may therefore be critical for the activity of this class of inhibitors. They also demonstrate the necessity for searching a comprehensive molecule database, since more global changes to the molecules did not lead to improved inhibition. In other words, minute modifications of the scaffold would have likely been missing from smaller databases. To test the hypothesis that the similarity in activity is consistent with a SAR model generated from the COVID-19 Moonshot dataset, we used machine learning to predict the importance of individual molecular features for the reference compound and the top five inhibitors (Figure 5).
Figure 5.
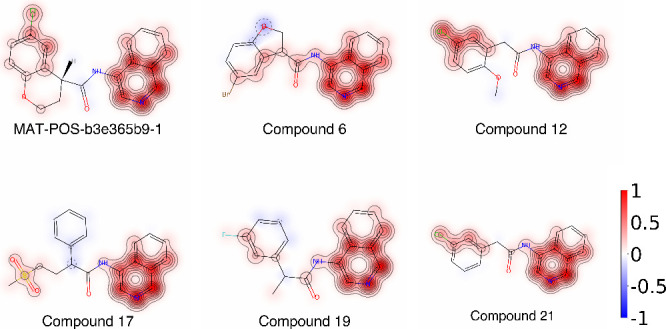
Selected inhibitors and molecular regions of importance for inhibitory activity, according to a support vector regression model trained on pIC50 values. The attribution weights are normalized to [−1, 1] as indicated by the color scale.
Although we do not explicitly explore the combinatorial effect of the various substitutions, e.g., by separately varying the scaffold and the chloro substitutions, the results can be interpreted in terms of a manual SAR. The slight increase in IC50 from compound 21 to compound 12 (cf. Table 2) is due to the addition of the methoxy group, in qualitative agreement with the negative weight predicted for it by the model. The IC50 increases further with compound 19, where the methylene bridge between the amide and the phenyl ring bears an additional methyl group, and the chlorine is simultaneously replaced by a fluorine. The model predicts that both contributions reduce the activity. A rigidification of the above-mentioned connection between the amide and the phenyl ring was made in compound 6, and chlorine was replaced by bromine, resulting in an even weaker binder.
Generally, the most important functional groups of the isoquinoline derivatives are the 4-aminopyridine ring fused to a phenyl ring and the halogen and its closest atoms on the second phenyl ring. On the other hand, the substitutions that differentiate our top inhibitors from the reference compound and from compound 21 are predicted to be of minor relevance for the activity. This finding is in agreement with the observed minor changes in IC50 values. Finally, the halogen accounts for an order of magnitude improvement in binding strength; this is supported by a compound nearly identical to compound 21 but without the halogen substituent (PostEra ID RAL-THA-2d450e86-1, cf. Figure 1) which has a reported IC50 = 14 μM.
Crystallography
To examine the molecular basis of inhibition of hit compounds, we determined room-temperature X-ray structures of Mpro co-crystallized with compound 12, compound 19, and compound 21 up to 1.90 Å resolution (Table S1). Other hits selected from the inhibition assay results were attempted but did not co-crystallize. Each ligand was modeled with unambiguous electron density in the active site (Figure 6a–c).
Figure 6.

Room-temperature X-ray crystal structures of Mpro co-crystallized with compound 21 (Z1530724813), compound 19 (Z1530724963), and compound 12 (Z1530718726). Isoquinoline compounds (a) compound 21, (b) compound 19, and (c) compound 12 modeled into electron density as polder omit maps in blue mesh contoured at 3σ. Intermolecular interactions between Mpro and compounds (d–f) are shown with H-bonds as black dashes and possible CH−π interactions as blue dots (another possibility is a halogen−π interaction). Distances in Å.
The structures show that all three ligands form a hydrogen bond (d = 2.9 Å) between the isoquinoline and the ε-nitrogen on His163 in S1 subsite of the binding pocket. Another hydrogen bond (d = 3.1 Å) forms between the ligand carbonyl O and Glu166 backbone N in the S3 site. The amide NH group of the ligand forms a hydrogen bond with a water molecule (the water molecule is not shown in Figure 6, but it is included in the analysis of water structure below). Moreover, one discerns a weak interaction (d = 3.9 Å to 4.1 Å) between the C2–C3 edge of the m-chlorophenyl group with the imidazole of the catalytic His41 in the S2 site. Halogen bonding has been recognized as a useful tool in drug design, in part for its tunability;30 a halogen bond, with an average distance of 3 Å, is a relatively weak interaction but can contribute several kcal/mol to the binding energy of a ligand.31,32 While the geometries found in our crystal structures do not correspond to a classical RX–Y halogen bond,33 the interaction may be of a halogen−π30−32 nature. It may alternatively, or also, involve CH−π interactions. The methoxy and methyl substitutions in compounds 12 and 19, respectively, do not lead to additional interactions with the protein, which partially explains their lack of (significant) effect on activity. They can thus be understood as neutral substitutions of the ligand scaffold, potentially only having a steric or entropic effect on binding.
Potential Role of Water Molecules in Stabilizing the Ligand Pose
Given the polar nature of most of the interactions discussed here, it is natural to look at the complex–solvent interactions, their qualitative change upon ligand binding and to elucidate the role of individual water molecules. Such an approach can form the basis for even more quantitative modeling of binding strength. The important role of water in mediating protein–ligand interactions is well known and can make modeling and prediction in drug discovery difficult.34,35 We performed a set of analyses to identify the locations of both trapped and displaced water molecules that impact the stability of the ligand binding pose.
The efforts of the global community to find drugs targeting SARS-CoV-2 proteins has led to an explosion in the number of crystal structures of these proteins, creating an unprecedented collection of structures of Mpro for analysis. Making use of this wealth of data, we aligned 550 SARS-CoV-2 Mpro structures deposited in the Protein Data Bank (see Table S2 for the list of structures) and interpolated the water oxygen positions onto a 3D grid around the active site (see Methods). In Figure 7, we show the crystallographic water molecule loci satisfying our density threshold in the crystallographic ensemble as red surfaces.
Figure 7.

Solvent sampling densities around the protease active site. (a) The isosurfaces shown represent the volumes within which water oxygen atoms are observed at a 1% maximum occupancy value with respect to (red) the ensemble of 280 currently available Mpro structures, which yielded 550 monomers and (blue) a 5 ns NPT simulation of rigid protein and ligand (compound 21, Z1530724813). Panels (b) and (c) show volumes in the active site that are strongly sampled by water oxygen atoms in the crystallographic ensemble and are occupied by the ligand (compound 21) and similar analogues. Both volumes shown are active hydrogen-bonding sites between the protein and solvent or ligand molecules. Displacement of solvent molecules within these volumes enables strong protein–ligand interactions to occur, thus partially explaining the strong homology of isoquinoline ligand orientation in the ensemble of crystal structures.
To elucidate water positions specific to these isoquinoline ligands and to determine if stable water molecules with kinetics too fast to capture with crystallography were also important, we performed a constrained molecular dynamics (MD) simulation of the ligand compound 21 in the binding pocket in explicit water and analyzed the water molecule positions in the same way, showing these as blue surfaces.
Generally, crystallographic and MD water locations coincide, demonstrating good qualitative agreement between simulated and crystallographic water molecule positions. A large cluster found only in the simulation and not in the crystallographic database analysis is found to interact with the amide nitrogen on the ligand, an interaction that appears to be ligand-specific (a majority of the crystal structures either do not contain bound ligands or contain ligands bound in poses that differ from the isoquinoline series). Notably, some crystallographic waters found in the set of Mpro crystal structures overlap with ligand compound 21 atoms and are therefore absent in the MD simulation, indicating water displacement. Panels (b) and (c) of Figure 7 show ligand substructures that form hydrogen bonds with the backbone of Glu166 and the side chain of His163, respectively, together with clusters of crystallographic waters found in the same positions as ligand atoms. In lieu of the ligand forming hydrogen bonds with the protein in the complex, water molecules are bonding partners in the fully solvated apo-protein structure. Key non-covalent protein–ligand interactions arise from the displacement of non-catalytic hydration water observed at reproducible positions in the binding pocket, as well as from displacement of water from the ligand solvation shell. Displacement of water molecules by ligands in protein binding sites is known to contribute to binding affinity with standard free energies of ΔG0 ≈ 8 kcal/mol36,37 and is likely a contributing factor to the binding strength of this series.
Density Functional Theory-Optimized Binding Pocket Geometry and Electrostatic Surface Analysis
Finally, using quantum chemistry, we examine some aspects of the electrostatic interactions of ligands with the active site. The electrostatic potential Vel was calculated for the ligand alone, for the protein environment alone, and for the ligand bound to protein, all using a continuum solvent mimicking an aqueous environment. The density functional theory (DFT)-optimized geometry is in excellent agreement with the corresponding X-ray structure (RMSD 0.71 Å), indicating that the choices of interacting atoms used to define the cluster and the water placement were robust. Figure 8 displays a particular result from these calculations. The electrostatic potentials of the m-chlorophenyl moiety as calculated for the ligand alone (panel a) and in the protein active site (panel b) are substantially different. The full system used for the protein–ligand calculation is shown in panels (b) and (c). The anisotropic nature of the electrostatic potential on the Cl suggests that it is interacting with three or four neighboring protein sites. This result supports the order of magnitude change in affinity associated with the halogen group discussed above, and also the effect of various halogen substitutions in a hit expansion around the similar MCULE-5948770040 scaffold, as discussed by Kneller et al.38
Figure 8.

Electrostatic potential Vel at a distance of 1 Å along the surface normal, projected onto the molecular surface of the isoquinoline pharmacophore, and its interaction with protein, calculated using density functional theory. Projected potential surface map of the ligand only, (a); Projected potential surface map of ligand compound 21 in protein environment, (b); the same model as in (b) but illustrated with atomic ball-and-stick representation to guide the eye, (c). The system was modeled in a continuum solvent (see Methods). The colors correspond to the electrostatic potential values in Hartree atomic units (a.u.) on the surface as indicated by the accompanying color key.
Discussions and Conclusion
Inhibition of the SARS-CoV-2 main protease (Mpro) is a major focus of drug discovery efforts against COVID-19. The list of Mpro inhibitors is rapidly growing,39 and SARs have been identified for several series. Various modes of inhibition have been developed, including small-molecule covalent inhibitors, peptidomimetic covalent inhibitors, non-covalent inhibitors, and metal-conjugated inhibitors. We report here a hit expansion of non-covalent inhibitors of Mpro, focusing on an isoquinoline scaffold discovered as part of the PostEra COVID Moonshot.1 A novelty of the present work is the use of a cheminformatics-based hit expansion, in which we performed an automated computational search of a billion-compound database using a molecular fingerprinting approach. In this hit expansion, 48 selected compounds were identified and tested, of which 21 exhibited inhibitory activity above 50% (IC50) at 20 μM. Four new non-covalent inhibitors with IC50 ≈ 1 μM were found. The isoquinoline motif is present in each of the four strongest binders, and the success of this hit expansion in demonstrating its importance was chiefly enabled by the enormous size of the database searched. A simple machine-learning model trained on COVID-19 Moonshot data suggests that the strong homology of the ligands is consistent with the SAR implied by the Moonshot dataset, which amounts to a manual hit expansion method guided by human intuition. Room-temperature X-ray structures of co-crystallized protein–inhibitor complexes reveal essential hydrogen bonds with the binding site and water molecules. MD simulation and quantum chemical DFT calculations further probe the nature of these interactions as well as charge effects on ligand binding.
These compounds will benefit from optimization to improve binding affinity, solubility, desired anti-viral effect in live cells, and other key properties such as selectivity and metabolic stability. Nevertheless, we have demonstrated the potential of high-throughput, automated cheminformatics-based computational hit expansions for rapidly expanding the size of a set of hits for lead optimization.
Methods
Selection of Compounds
We selected compounds by scaffold similarity to the starting compound PostEra MAT-POS-b3e365b9-1. To this end, we employed the MAP4 MinHash-based, atom-pair molecule fingerprint with 1024 permutations.40 MAP4 combines chemical environments of radius r = 1 and r = 2 around pairs of atoms with their topological distance, and for every such set of descriptors returns the member with the minimum SHA-1 hash under a random permutation, resulting in a similarity measure between molecules that is an unbiased estimator of the Jaccard index.41 MAP4 has been shown to outperform comparable methods in the task of separating active binders from decoys by similarity.40
We computed MAP4 fingerprints for the Enamine REAL library and employed the dask42-distributed and NVIDIA RAPIDS43 GPU-accelerated data analytics libraries to parallelize the calculation of fingerprints and to reduce the dataset to the most similar compounds. We selected 47 unique scaffolds (cf. Supporting Information) having the highest fingerprint similarity (≥0.28125) and included a control compound (Enamine ID Z1530724813/PostEra COVID Moonshot ID ADA-UCB-6c2cb422-1, similarity 0.2549), for which an IC50 has been reported by the PostEra project. These compounds were filtered for potential pan-assay interference compounds (PAINS) and purchased from Enamine. Our experimental characterization did not include the starting compound itself, as it was unavailable from Enamine; however, we included an additional control (MCULE-5948770040) that was previously found to be a potent, non-covalent Mpro inhibitor29 in a study unrelated to the PostEra project.
SARS-CoV-2 Mpro Expression, Purification, and Enzyme Inhibition Assay
Protein purification supplies were purchased from Cytiva (Piscataway, NJ, USA). A gene construct encoding Mpro (NSP5) from SARS-CoV-2 was cloned into plasmid pD451-SR44 (Atum, Newark, CA) and expressed and purified with protocols detailed in ref (45). Briefly, the authentic N-terminus was achieved by including an NSP4-NSP5 autoprocessing sequence flanked by maltose binding protein and Mpro. At the C-terminus, a sequence encoding the human rhinovirus 3C (HRV-3C) cleavage site was followed by a His6-tag. The authentic N-terminal sequence was then created by autocleavage during expression, while the C-terminus was generated by HRV-3C treatment following Ni-immobilized metal affinity chromatography.
Compounds were purchased from Enamine as 10 mM stock solutions in DMSO and stored at 20 °C. All compounds are >90% pure by LC-MS. The assays were performed in 40 μL total volume in black half-area 96-well plates at 25 °C as previously described.29,46,47 The assay buffer contained 20 mM Tris-HCl pH 7.3, 100 mM NaCl, 1 mM EDTA, and 2 mM reduced glutathione with 5% v/v final DMSO concentration. Reaction final concentrations were 250 nM Mpro enzyme, 20 μM inhibitor, and 40 μM FRET peptide substrate. The FRET substrate DABCYLKTSAVLQSGFRKM-E(EDANS) trifluoroacetate salt was purchased from Bachem (PN 4045664). Initial rates were determined for time points in the linear range by linear regression in Excel, residual activities were determined by normalizing candidate initial rates to the average of the positive controls, and Z-scores were determined by dividing the difference between the candidate initial rate and average positive control initial rate by the standard deviation of the positive control initial rates. The Z′ statistics for the plate were calculated using the published equation.48Figure S1 shows good agreement between the primary and the confirmation screen (Spearman-ρ = 0.44, P = 0.00164).
IC50 Determination
To determine the concentration at which a compound was able to achieve 50% inhibition of Mpro activity in vitro (IC50), the FRET assay was performed at seven concentrations of inhibitor (0.03–31.6 μM) in duplicate. Initial rates were normalized to no inhibitor control (100% activity) and no enzyme control (0% activity), and nonlinear regression of the [Inhibitor] vs normalized response IC50 equation was performed to fit the data using GraphPad Prism 9, yielding IC50 and its 95% confidence interval.
Structure–Activity Model
To derive a structure–activity model, we trained a support vector regression model on 1365 fluorescence IC50 values from the COVID-19 Moonshot dataset1 using scikit-learn.49 For every molecule we computed the 2048-bit Morgan fingerprint as a feature vector using RDKit50 and the label as −log10 IC50 [μM], normalized by the mean and standard deviation of the training dataset. We then split the training fingerprints and labels into training and test sets using a 9:1 ratio. This model reproduced the order of experimentally measured activity values of the test set with a Spearman-ρ rank correlation coefficient of 0.73 and a mean-square error of 0.353 (in log10 IC50 units). To determine which parts of the molecule are important for predicting the affinity value, we used the GetSimilarityMapForModel function in RDkit, which removes a single atom and then recomputes the fingerprint for every atom in the molecule.
Crystallization
Three compounds with favorable IC50 values were crystallized in complex with Mpro and their structures determined using X-ray diffraction. Crystallization reagents were purchased from Hampton Research (Aliso Viejo, CA, USA). Crystallographic tools were purchased from MiTeGen (Ithaca, NY, USA) and Vitrocom (Mountain Lakes, NJ, USA). Mpro concentrated to ∼5.0 mg/mL in 20 mM Tris pH 8.0, 150 mM NaCl, and 1 mM TCEP was used for crystallization by sitting-drop vapor diffusion. Conditions for growing crystalline aggregates of ligand-free Mpro were identified by high-throughput screen at the Hauptman-Woodward Research Institute,51 reproduced locally, and then used for microseeding to nucleate Mpro crystals in subsequent co-crystallization experiments. Lyophilized samples of compounds 12 (Z1530718726), 19 (Z1530724963), and 21 (Z1530724813) (Enamine, Monmouth Jct., NJ, USA) were dissolved in 100% DMSO as 50 mM stocks and stored at −20 °C. Compound 21 corresponds to PostEra COVID Moonshot ID ADA-UCB-6c2cb422-1. Compounds were mixed with Mpro in a 5:1 molar ratio and allowed to incubate on ice for a minimum of 1 h. Crystals suitable for room-temperature X-ray diffraction grew after 1 week in 20 μL drops at a 1:1 mixture with 18–20% PEG3350, 0.1 M Bis-Tris pH 6.5, nucleated with 0.2 μL of 1:200 dilution microseeds after incubation at 14 °C.
Room-Temperature X-ray Data Collection and Structure Refinement
Protein crystals were mounted using a MiTeGen (Ithaca, NY) room-temperature capillary system. X-rays for crystallography were generated from a Rigaku HighFlux HomeLab employing a MicroMax-007 HF X-ray generator with Osmic VariMax optics. Diffraction images were collected using an Eiger R 4M hybrid photon-counting detector. Diffraction datasets were reduced and scaled using Rigaku CrysAlis Pro software package. Molecular replacement was performed using the ligand-free room-temperature Mpro structure (PDB ID 6WQF,44) using Phaser.52 Structure refinement was performed with Phenix.refine from the Phenix suite53 and manual refinement in COOT54 assisted by Molprobity.55 Data collection and refinement statistics are listed in Table S1. The structures and corresponding structure factors of the room-temperature co-crystal complexes have been deposited into the Protein Data Bank (PDB).
Crystal Structure Hydration Analysis
To determine the average locations of water molecules around the active site in the ensemble of Mpro structures deposited in the PDB, the Dali server56 was used to identify homologues of the SARS-CoV-2 Mpro. The query structure was the Mpro:compound 21 protein–ligand complex reported here. The search across the full PDB database returned 277 crystal structures with strong structural homology. The three room-temperature X-ray structures reported here were also included in this set of structures. Alignment of all chains in the 280 Mpro-analogous structures was performed using the align function in PyMOL,57 with the Mpro:compound 21 complex used as the target structure. Chains with strong alignments (RMSD smaller than 5.0 Å, number of aligned residues greater than 50, and alignment score greater than 150) were included in the structural ensemble; all crystallographic waters and resolved small molecules within 5.0 Å of any protein atom were maintained in the aligned structures. The final count of monomeric Mpro homologues was 550 structures. Once all structures were aligned, a 3D histogram of crystal water oxygen atom positions was calculated around the active site of the enzyme. Each of the original 280 crystal structures was given an equal weight during the creation of the histogram to avoid over-weighting of the results toward structures from multimeric Mpro or NMR datasets. Each cubic bin (voxel) was 0.25 Å × 0.25 Å × 0.25 Å. The resulting 3D histogram was then imported into Visual Molecular Dynamics (VMD)58 to enable the visualization of hydration hot spots identified from the ensemble of crystal structures.
Molecular Dynamics Sampling of Water Positions in the Constrained Mpro:Compound 21 Complex
To obtain a dynamic view of the hydration structure of Mpro specific to the isoquinoline ligands, all-atom explicit solvent MD simulations of the protonated Mpro:compound 21 complex were performed to model the protein in a bulk solvent environment. Here, both the protein and the ligand were completely restrained to prevent deviation away from the crystal structure geometry so that the solvation hot spots for the specific bound structure could be identified. Additional details regarding the MD simulation protocol are provided below. The 5 ns trajectory was analyzed in a similar fashion to the crystal structure ensemble to generate a 3D histogram of solvent oxygen atom positions around the ligand.
Parameters for the solvated Mpro:compound 21 complex were assigned in AmberTools21 tleap,59 using the ff19SB force field60 and GAFF/AM1-BCC parameters61,62 for the ligand compound 21. Resolved crystal waters were maintained. Protonation states of His residues were assigned using PropKa,63,64 and all His side chains were singly protonated. His172 and His163 were protonated at the ε-nitrogen position. The other histidines, His41 and His164, were protonated at the δ-nitrogen. The system was solvated in a box of TIP3P water molecules with a minimum distance of 12 Å from the protein to the nearest face of the box. Sodium and chloride ions were added to neutralize charge and maintain a 0.1 M ionic concentration. The OpenMM molecular simulation software package65 was used to perform the MD simulations. The protein and ligand atoms were constrained by setting their masses to zero. The particle mesh Ewald (PME) method was used to account for long-range electrostatics interactions. A Langevin thermostat was used to keep the temperature of the solvent at 310 K. A Monte Carlo barostat was used to maintain the pressure at 1 atm. A time step of 2 fs was used to propagate the solvent atoms, with frames written every 2 ps. A total of 5 ns was performed for adequate sampling around the static protein–ligand complex.
Quantum Chemical Calculations
To examine specific static binding interactions in detail, quantum mechanical calculations were performed using DFT with the ORCA package.66 We optimized the geometry of a cluster model of the ligand in the binding pocket and used this geometry to calculate the electrostatic potential in the ligand-only, protein-only, and complex configurations. Starting geometries of the ligands were derived from crystallography, and the bound-complex geometries included all residues within 5 Å of the ligand as well as six stably bound water molecules identified in the MD water analysis. Two carboxylic groups, belonging to Glu166 and Asp187, were protonated (i.e., COO– → COOH) to mimic an overall neutral charge of the protein.67 The two carboxylic groups were chosen due to their peripheral position in the model and hence limited impact on the substrate–binding pocket interaction. Constraints were imposed on the protein backbone. The model with bound ligand contained 268 atoms and 2571 basis functions. The optimized geometry and the list of all constraints are available as Supporting Information.
The model was optimized at the BP86/Def2-SVP level of theory.68−70 Grimme’s D3 dispersion corrections were applied in all calculations.71,72 Single-point energy calculations at the optimized geometries were performed at the B3LYP/Def2-SVP level of theory.73,74 These calculations included D3 dispersion corrections as well as the CPCM polarizable continuum solvent model.75 The dielectric constant was set to εr = 4 during geometry optimization to mimic a protein environment. All calculations used the resolution-of-the-identity (RI) approximation and automatically generated auxiliary basis sets as implemented in ORCA.76−78
For any single point in the vicinity of an atom, the electrostatic potential was computed using the ORCA_vpot module, with the density computed at the B3LYP/Def2-SVP level of theory in a continuum solvent with εr = 80. This computation was performed for the complex, the ligand, and the environment (including water molecules). A Python script79 was used to call the ORCA_vpot module to generate electrostatic potentials around the 4096000 = 160 × 160 × 160 points specified to surround the model of the protein active site and to convert the computed electrostatic potentials to the .cube file format for visualization. The .cube file was visualized using the Chimera program.80
Acknowledgments
This research was supported by the U.S. Department of Energy (DOE) Office of Science through the National Virtual Biotechnology Laboratory (NVBL), a consortium of DOE national laboratories focused on response to COVID-19, with funding provided by the Coronavirus CARES Act. CARES act funding to the Oak Ridge Leadership Computing Facility (OLCF) through DOE ASCR in support of this research is also acknowledged, as is the Laboratory Directed Research and Development Program at Oak Ridge National Laboratory (ORNL). This research used resources at the Spallation Neutron Source and the High Flux Isotope Reactor, which are DOE Office of Science User Facilities operated by ORNL. This research also used resources of the Spallation Neutron Source Second Target Station Project at ORNL. The Office of Biological and Environmental Research supported research at the ORNL Center for Structural Molecular Biology (CSMB), a DOE Office of Science User Facility. We acknowledge a computing allocation on Google Cloud for COVID-19 research that enabled the similarity search on the compound dataset. We thank Marti Head for discussions and a careful reading of the manuscript. This research also used resources of the OLCF at ORNL, which is supported by the Office of Science of the U.S. DOE under Contract No. DE-AC05-00OR22725.
Supporting Information Available
The Supporting Information is available free of charge at https://pubs.acs.org/doi/10.1021/acsptsci.2c00026.
Figure S1, validation of the enzymatic assay; Table S1, crystallographic data collection and refinement statistics for room-temperature structures of Mpro in complex with compounds 12, 19, and 21; and Table S2, list of Mpro crystal structures (PDB IDs) used for the hydration analysis (PDF)
Characterization of compounds, including purity, molecular formula (SMILES) strings, and activities (XLSX)
Accession Codes
The PDB accession codes are 7S3K for Mpro:compound 12, 7S4B for Mpro:compound 19, and 7S3S for Mpro:compound 21.
ORNL is managed by UT-Battelle, LLC for the DOE Office of Science, the single largest supporter of basic research in the physical sciences in the United States. This manuscript has been coauthored by UT-Battelle, LLC, under contract DE-AC05-00OR22725 with the U.S. Department of Energy (DOE). The U.S. government retains and the publisher, by accepting the article for publication, acknowledges that the U.S. government retains a nonexclusive, paid-up, irrevocable, worldwide license to publish or reproduce the published form of this manuscript, or allow others to do so, for U.S. government purposes. DOE will provide public access to these results of federally sponsored research in accordance with the DOE Public Access Plan (http://energy.gov/downloads/doe-public-access-plan).
The authors declare no competing financial interest.
Supplementary Material
References
- Jaroszewski L.; Iyer M.; Alisoltani A.; Sedova M.; Godzik A. The interplay of SARS-CoV-2 evolution and constraints imposed by the structure and functionality of its proteins. PLoS Comput. Biol. 2021, 17, e1009147 10.1371/journal.pcbi.1009147. [DOI] [PMC free article] [PubMed] [Google Scholar]
- Acharya A.; Agarwal R.; Baker M. B.; Baudry J.; Bhowmik D.; Boehm S.; Byler K. G.; Chen S. Y.; Coates L.; Cooper C. J.; Demerdash O.; Daidone I.; Eblen J. D.; Ellingson S.; Forli S.; Glaser J.; Gumbart J. C.; Gunnels J.; Hernandez O.; Irle S.; Kneller D. W.; Kovalevsky A.; Larkin J.; Lawrence T. J.; LeGrand S.; Liu S.-H.; Mitchell J.; Park G.; Parks J.; Pavlova A.; Petridis L.; Poole D.; Pouchard L.; Ramanathan A.; Rogers D. M.; Santos-Martins D.; Scheinberg A.; Sedova A.; Shen Y.; Smith J. C.; Smith M. D.; Soto C.; Tsaris A.; Thavappiragasam M.; Tillack A. F.; Vermaas J. V.; Vuong V. Q.; Yin J.; Yoo S.; Zahran M.; Zanetti-Polzi L. Supercomputer-Based Ensemble Docking Drug Discovery Pipeline with Application to Covid-19. J. Chem. Inf. Model. 2020, 60, 5832–5852. 10.1021/acs.jcim.0c01010. [DOI] [PMC free article] [PubMed] [Google Scholar]
- Joshi R. S.; Jagdale S. S.; Bansode S. B.; Shankar S. S.; Tellis M. B.; Pandya V. K.; Chugh A.; Giri A. P.; Kulkarni M. J. Discovery of potential multi-target-directed ligands by targeting host-specific SARS-CoV-2 structurally conserved main protease. J. Biomol. Struct. Dyn. 2021, 39, 3099–3114. 10.1080/07391102.2020.1760137. [DOI] [PMC free article] [PubMed] [Google Scholar]
- Pavlova A.; Lynch D. L.; Daidone I.; Zanetti-Polzi L.; Smith M. D.; Chipot C.; Kneller D. W.; Kovalevsky A.; Coates L.; Golosov A. A.; et al. Inhibitor binding influences the protonation states of histidines in SARS-CoV-2 main protease. Chem. Sci. 2021, 12, 1513–1527. 10.1039/D0SC04942E. [DOI] [PMC free article] [PubMed] [Google Scholar]
- Zanetti-Polzi L.; Smith M. D.; Chipot C.; Gumbart J. C.; Lynch D. L.; Pavlova A.; Smith J. C.; Daidone I. Tuning proton transfer thermodynamics in SARS-Cov-2 main protease: implications for catalysis and inhibitor design. J. Phys. Chem. Lett. 2021, 12, 4195–4202. 10.1021/acs.jpclett.1c00425. [DOI] [PMC free article] [PubMed] [Google Scholar]
- Hilgenfeld R.; Peiris M. From SARS to MERS: 10 years of research on highly pathogenic human coronaviruses. Antiviral Res. 2013, 100, 286–295. 10.1016/j.antiviral.2013.08.015. [DOI] [PMC free article] [PubMed] [Google Scholar]
- Zhang L.; Lin D.; Sun X.; Curth U.; Drosten C.; Sauerhering L.; Becker S.; Rox K.; Hilgenfeld R. Crystal structure of SARS-CoV-2 main protease provides a basis for design of improved α-ketoamide inhibitors. Science 2020, 368, 409–412. 10.1126/science.abb3405. [DOI] [PMC free article] [PubMed] [Google Scholar]
- Jin Z.; Du X.; Xu Y.; Deng Y.; Liu M.; Zhao Y.; Zhang B.; Li X.; Zhang L.; Peng C.; et al. Structure of M pro from SARS-CoV-2 and discovery of its inhibitors. Nature 2020, 582, 289–293. 10.1038/s41586-020-2223-y. [DOI] [PubMed] [Google Scholar]
- Qiao J.; Li Y.-S.; Zeng R.; Liu F.-L.; Luo R.-H.; Huang C.; Wang Y.-F.; Zhang J.; Quan B.; Shen C.; et al. SARS-CoV-2 Mpro inhibitors with antiviral activity in a transgenic mouse model. Science 2021, 371, 1374–1378. 10.1126/science.abf1611. [DOI] [PMC free article] [PubMed] [Google Scholar]
- Zhang C.-H.; Stone E. A.; Deshmukh M.; Ippolito J. A.; Ghahremanpour M. M.; Tirado-Rives J.; Spasov K. A.; Zhang S.; Takeo Y.; Kudalkar S. N.; et al. Potent noncovalent inhibitors of the main protease of SARS-CoV-2 from molecular sculpting of the drug perampanel guided by free energy perturbation calculations. ACS Cent. Sci. 2021, 7, 467–475. 10.1021/acscentsci.1c00039. [DOI] [PMC free article] [PubMed] [Google Scholar]
- Han S. H.; Goins C. M.; Arya T.; Shin W.-J.; Maw J.; Hooper A.; Sonawane D. P.; Porter M. R.; Bannister B. E.; Crouch R. D.; et al. Structure-Based Optimization of ML300-Derived, Noncovalent Inhibitors Targeting the Severe Acute Respiratory Syndrome Coronavirus 3CL Protease (SARS-CoV-2 3CLpro). J. Med. Chem. 2022, 65, 2880. 10.1021/acs.jmedchem.1c00598. [DOI] [PMC free article] [PubMed] [Google Scholar]
- Halford B.Pfizer unveils its oral SARS-CoV-2 inhibitor. Chemical & Engineering News, Apr 7, 2021. https://cen.acs.org/acs-news/acs-meeting-news/Pfizer-unveils-oral-SARS-CoV/99/i13
- Owen D. R.; Allerton C. M.; Anderson A. S.; Aschenbrenner L.; Avery M.; Berritt S.; Boras B.; Cardin R. D.; Carlo A.; Coffman K. J.; et al. An oral SARS-CoV-2 Mpro inhibitor clinical candidate for the treatment of COVID-19. Science 2021, 374, 1586–1593. 10.1126/science.abl4784. [DOI] [PubMed] [Google Scholar]
- Cully M. A tale of two antiviral targets-and the COVID-19 drugs that bind them. Nat. Rev. Drug Disc. 2022, 21, 3. 10.1038/d41573-021-00202-8. [DOI] [PubMed] [Google Scholar]
- U.S. Food & Drug Administration . FDA Website, 2021. (accessed 2022-03-17). [Google Scholar]
- Halford B.Pfizer’s novel COVID-19 antiviral heads to clinical trials, online. Chemical & Engineering News, Sept 17, 2020.
- Jacobs J.; Zhou S.; Dawson E.; Daniels J. S.; Hodder P.; Tokars V.; Mesecar A.; Lindsley C. W.; Stauffer S. R.. Discovery of Non-Covalent Inhibitors of the SARS Main Proteinase 3CLpro. Probe Reports from the NIH Molecular Libraries Program [Internet], 2010. https://www.ncbi.nlm.nih.gov/books/NBK133447/. [PubMed] [Google Scholar]
- Liu Y.; Liang C.; Xin L.; Ren X.; Tian L.; Ju X.; Li H.; Wang Y.; Zhao Q.; Liu H.; et al. The development of Coronavirus 3C-Like protease (3CLpro) inhibitors from 2010 to 2020. Eur. J. Med. Chem. 2020, 206, 112711. 10.1016/j.ejmech.2020.112711. [DOI] [PMC free article] [PubMed] [Google Scholar]
- Luttens A.; Gullberg H.; Abdurakhmanov E.; Vo D. D.; Akaberi D.; Talibov V. O.; Nekhotiaeva N.; Vangeel L.; De Jonghe S.; Jochmans D.; et al. Ultralarge Virtual Screening Identifies SARS-CoV-2 Main Protease Inhibitors with Broad-Spectrum Activity against Coronaviruses. J. Am. Chem. Soc. 2022, 144, 2905. 10.1021/jacs.1c08402. [DOI] [PMC free article] [PubMed] [Google Scholar]
- Achdout H.; Aimon A.; Bar-David E.; Barr H.; Ben-Shmuel A.; Bennett J.; Boby M. L.; Borden B.; Bowman G. R.; Brun J.; BVNBS S.; Calmiano M.; Carbery A.; Cattermole E.; Chernyshenko E.; Chodera J. D.; Clyde A.; Coffland J. E.; Cohen G.; Cole J.; Contini A.; Cox L.; Cvitkovic M.; Dias A.; Donckers K.; Dotson D. L.; Douangamath A.; Duberstein S.; Dudgeon T.; Dunnett L.; Eastman P. K.; Erez N.; Eyermann C. J.; Fairhead M.; Fate G.; Fearon D.; Fedorov O.; Ferla M.; Fernandes R. S.; Ferrins L.; Foster R.; Foster H.; Gabizon R.; Garcia-Sastre A.; Gawriljuk V. O.; Gehrtz P.; Gileadi C.; Giroud C.; Glass W. G.; Glen R.; Glinert I.; Godoy A. S.; Gorichko M.; Gorrie-Stone T.; Griffen E. J.; Hart S. H.; Heer J.; Henry M.; Hill M.; Horrell S.; Hurley M. F.; Israely T.; Jajack A.; Jnoff E.; Jochmans D.; John T.; Jonghe S. D.; Kantsadi A. L.; Kenny P. W.; Kiappes J. L.; Koekemoer L.; Kovar B.; Krojer T.; Lee A. A.; Lefker B. A.; Levy H.; London N.; Lukacik P.; Macdonald H. B.; MacLean B.; Malla T. R.; Matviiuk T.; McCorkindale W.; McGovern B. L.; Melamed S.; Michurin O.; Mikolajek H.; Milne B. F.; Morris A.; Morris G. M.; Morwitzer M. J.; Moustakas D.; Nakamura A. M.; Neto J. B.; Neyts J.; Nguyen L.; Noske G. D.; Oleinikovas V.; Oliva G.; Overheul G. J.; Owen D.; Psenak V.; Pai R.; Pan J.; Paran N.; Perry B.; Pingle M.; Pinjari J.; Politi B.; Powell A.; Puni R.; Rangel V. L.; Reddi R. N.; Reid S. P.; Resnick E.; Ripka E. G.; Robinson M. C.; Robinson R. P.; Rodriguez-Guerra J.; Rosales R.; Rufa D.; Schofield C.; Shafeev M.; Shaikh A.; Shi J.; Shurrush K.; Singh S.; Sittner A.; Skyner R.; Smalley A.; Smilova M. D.; Solmesky L. J.; Spencer J.; Strain-Damerell C.; Swamy V.; Tamir H.; Tennant R.; Thompson W.; Thompson A.; Thompson W.; Tomasio S.; Tumber A.; Vakonakis I.; van Rij R. P.; Vangeel L.; Varghese F. S.; Vaschetto M.; Vitner E. B.; Voelz V.; Volkamer A.; von Delft F.; von Delft A.; Walsh M.; Ward W.; Weatherall C.; Weiss S.; White K. M.; Wild C. F.; Wittmann M.; Wright N.; Yahalom-Ronen Y.; Zaidmann D.; Zidane H.; Zitzmann N. Open Science Discovery of Oral Non-Covalent SARS-CoV-2 Main Protease Inhibitor Therapeutics. bioRxiv 2021, 10.1101/2020.10.29.339317. [DOI] [Google Scholar]
- Achdout H.; Aimon A.; Bar-David E.; Barr H.; Ben-Shmuel A.; Bennett J.; Bobby M. L.; Brun J.; BVNBS S.; Calmiano M.; et al. COVID moonshot: open science discovery of SARS-CoV-2 main protease inhibitors by combining crowdsourcing, high-throughput experiments, computational simulations, and machine learning. chemRxiv 2020, 10.26434/chemrxiv.13158218.v1. [DOI] [Google Scholar]
- Chen L.-R.; Wang Y.-C.; Lin Y. W.; Chou S.-Y.; Chen S.-F.; Liu L. T.; Wu Y.-T.; Kuo C.-J.; Chen T. S.-S.; Juang S.-H. Synthesis and evaluation of isatin derivatives as effective SARS coronavirus 3CL protease inhibitors. Bioorg. Med. Chem. Lett. 2005, 15, 3058–3062. 10.1016/j.bmcl.2005.04.027. [DOI] [PMC free article] [PubMed] [Google Scholar]
- Hajduk P. J.; Meadows R. P.; Fesik S. W. NMR-based screening in drug discovery. Q. Rev. Biophys. 1999, 32, 211–240. 10.1017/S0033583500003528. [DOI] [PubMed] [Google Scholar]
- Petros A. M.; Dinges J.; Augeri D. J.; Baumeister S. A.; Betebenner D. A.; Bures M. G.; Elmore S. W.; Hajduk P. J.; Joseph M. K.; Landis S. K.; et al. Discovery of a potent inhibitor of the antiapoptotic protein Bcl-xL from NMR and parallel synthesis. J. Med. Chem. 2006, 49, 656–663. 10.1021/jm0507532. [DOI] [PubMed] [Google Scholar]
- Clark D. E. Virtual screening: is bigger always better? Or can small be beautiful?. J. Chem. Inf. Model. 2020, 60, 4120–4123. 10.1021/acs.jcim.0c00101. [DOI] [PubMed] [Google Scholar]
- Lipinski C. A.; Lombardo F.; Dominy B. W.; Feeney P. J. Experimental and computational approaches to estimate solubility and permeability in drug discovery and development settings. Adv. Drug Delivery Rev. 1997, 23, 3–25. 10.1016/S0169-409X(96)00423-1. [DOI] [PubMed] [Google Scholar]
- Veber D. F.; Johnson S. R.; Cheng H.-Y.; Smith B. R.; Ward K. W.; Kopple K. D. Molecular properties that influence the oral bioavailability of drug candidates. J. Med. Chem. 2002, 45, 2615–2623. 10.1021/jm020017n. [DOI] [PubMed] [Google Scholar]
- Enamine . REAL Database, 2018. version. https://enamine.net/compound-collections/real-compounds/real-database (accessed 2020-04-01, through https://virtual-flow.org/).
- Clyde A.; Galanie S.; Kneller D. W.; Ma H.; Babuji Y.; Blaiszik B.; Brace A.; Brettin T.; Chard K.; Chard R.; et al. High Throughput Virtual Screening and Validation of a SARS-CoV-2 Main Protease Noncovalent Inhibitor. J. Chem. Inf. Model. 2022, 62, 116. 10.1021/acs.jcim.1c00851. [DOI] [PubMed] [Google Scholar]
- Wilcken R.; Zimmermann M. O.; Lange A.; Joerger A. C.; Boeckler F. M. Principles and applications of halogen bonding in medicinal chemistry and chemical biology. J. Med. Chem. 2013, 56, 1363–1388. 10.1021/jm3012068. [DOI] [PubMed] [Google Scholar]
- Cavallo G.; Metrangolo P.; Milani R.; Pilati T.; Priimagi A.; Resnati G.; Terraneo G. The halogen bond. Chem. Rev. 2016, 116, 2478–2601. 10.1021/acs.chemrev.5b00484. [DOI] [PMC free article] [PubMed] [Google Scholar]
- Kolar M. H.; Hobza P. Computer modeling of halogen bonds and other σ-hole interactions. Chem. Rev. 2016, 116, 5155–5187. 10.1021/acs.chemrev.5b00560. [DOI] [PubMed] [Google Scholar]
- Desiraju G. R.; Ho P. S.; Kloo L.; Legon A. C.; Marquardt R.; Metrangolo P.; Politzer P.; Resnati G.; Rissanen K. Definition of the halogen bond (IUPAC Recommendations 2013). Pure Appl. Chem. 2013, 85, 1711–1713. 10.1351/PAC-REC-12-05-10. [DOI] [Google Scholar]
- Bodnarchuk M. S. Water, water, everywhere...It’s time to stop and think. Drug Discovery Today 2016, 21, 1139–1146. 10.1016/j.drudis.2016.05.009. [DOI] [PubMed] [Google Scholar]
- Spyrakis F.; Ahmed M. H.; Bayden A. S.; Cozzini P.; Mozzarelli A.; Kellogg G. E. The roles of water in the protein matrix: a largely untapped resource for drug discovery. J. Med. Chem. 2017, 60, 6781–6827. 10.1021/acs.jmedchem.7b00057. [DOI] [PubMed] [Google Scholar]
- Hamelberg D.; McCammon J. A. Standard free energy of releasing a localized water molecule from the binding pockets of proteins: double-decoupling method. J. Am. Chem. Soc. 2004, 126, 7683–7689. 10.1021/ja0377908. [DOI] [PubMed] [Google Scholar]
- Barillari C.; Taylor J.; Viner R.; Essex J. W. Classification of water molecules in protein binding sites. J. Am. Chem. Soc. 2007, 129, 2577–2587. 10.1021/ja066980q. [DOI] [PubMed] [Google Scholar]
- Kneller D. W.; Li H.; Galanie S.; Phillips G.; Labbé A.; Weiss K. L.; Zhang Q.; Arnould M. A.; Clyde A.; Ma H.; et al. Structural, Electronic, and Electrostatic Determinants for Inhibitor Binding to Subsites S1 and S2 in SARS-CoV-2 Main Protease. J. Med. Chem. 2021, 64, 17366–17383. 10.1021/acs.jmedchem.1c01475. [DOI] [PMC free article] [PubMed] [Google Scholar]
- Gao K.; Wang R.; Chen J.; Tepe J. J.; Huang F.; Wei G.-W. Perspectives on SARS-CoV-2 Main Protease Inhibitors. J. Med. Chem. 2021, 64, 16922. 10.1021/acs.jmedchem.1c00409. [DOI] [PMC free article] [PubMed] [Google Scholar]
- Capecchi A.; Probst D.; Reymond J.-L. One molecular fingerprint to rule them all: drugs, biomolecules, and the metabolome. J. Cheminfo. 2020, 12, 43. 10.1186/s13321-020-00445-4. [DOI] [PMC free article] [PubMed] [Google Scholar]
- Jaccard P. Étude comparative de la distribution florale dans une portion des Alpes et des Jura. Bull. Soc. Vaudoise Sci. Nat. 1901, 37, 547–579. [Google Scholar]
- Dask Development Team . Dask: Library for dynamic task scheduling, 2016. https://dask.org. [Google Scholar]
- NVIDIA RAPIDS . Open GPU Data Science, 2021. https://rapids.ai. [Google Scholar]
- Kneller D. W.; Phillips G.; O’Neill H. M.; Jedrzejczak R.; Stols L.; Langan P.; Joachimiak A.; Coates L.; Kovalevsky A. Structural plasticity of SARS-CoV-2 3CL M pro active site cavity revealed by room temperature X-ray crystallography. Nat. Commun. 2020, 11, 3202. 10.1038/s41467-020-16954-7. [DOI] [PMC free article] [PubMed] [Google Scholar]
- Kneller D. W.; Phillips G.; Kovalevsky A.; Coates L. Room-temperature neutron and X-ray data collection of 3CL Mpro from SARS-CoV-2. Acta Crystallogr. Sect. F: Struct. Biol. Commun. 2020, 76, 483. 10.1107/S2053230X20011814. [DOI] [PMC free article] [PubMed] [Google Scholar]
- Kuo C.-J.; Chi Y.-H.; Hsu J. T.-A.; Liang P.-H. Characterization of SARS main protease and inhibitor assay using a fluorogenic substrate. Biochem. Biophys. Res. Commun. 2004, 318, 862–867. 10.1016/j.bbrc.2004.04.098. [DOI] [PMC free article] [PubMed] [Google Scholar]
- Kneller D. W.; Galanie S.; Phillips G.; O’Neill H. M.; Coates L.; Kovalevsky A. Malleability of the SARS-CoV-2 3CL Mpro active-site cavity facilitates binding of clinical antivirals. Structure 2020, 28, 1313–1320. 10.1016/j.str.2020.10.007. [DOI] [PMC free article] [PubMed] [Google Scholar]
- Zhang J.; Chung T.; Oldenburg K. A simple statistical Parameter for Use in evaluation and validation of High Throughput screening assays. J. Biomol. Screen. 1999, 4, 67–73. 10.1177/108705719900400206. [DOI] [PubMed] [Google Scholar]
- Pedregosa F.; Varoquaux G.; Gramfort A.; Michel V.; Thirion B.; Grisel O.; Blondel M.; Prettenhofer P.; Weiss R.; Dubourg V.; Vanderplas J.; Passos A.; Cournapeau D.; Brucher M.; Perrot M.; Duchesnay E. Scikit-learn: Machine Learning in Python. J. Machine Learning Res. 2011, 12, 2825–2830. [Google Scholar]
- Landrum G.RDKit, 2010https://github.com/rdkit/rdkit. [Google Scholar]
- Luft J. R.; Collins R. J.; Fehrman N. A.; Lauricella A. M.; Veatch C. K.; DeTitta G. T. A deliberate approach to screening for initial crystallization conditions of biological macromolecules. J. Struct. Biol. 2003, 142, 170–179. 10.1016/S1047-8477(03)00048-0. [DOI] [PubMed] [Google Scholar]
- McCoy A. J.; Grosse-Kunstleve R. W.; Adams P. D.; Winn M. D.; Storoni L. C.; Read R. J. Phaser crystallographic software. J. Appl. Crystallogr. 2007, 40, 658–674. 10.1107/S0021889807021206. [DOI] [PMC free article] [PubMed] [Google Scholar]
- Adams P. D.; Afonine P. V.; Bunkóczi G.; Chen V. B.; Davis I. W.; Echols N.; Headd J. J.; Hung L.-W.; Kapral G. J.; Grosse-Kunstleve R. W.; et al. PHENIX: a comprehensive Python-based system for macromolecular structure solution. Acta Crystallogr. Sect. D: Biol. Crystallogr. 2010, 66, 213–221. 10.1107/S0907444909052925. [DOI] [PMC free article] [PubMed] [Google Scholar]
- Emsley P.; Lohkamp B.; Scott W. G.; Cowtan K. Features and development of Coot. Acta Crystallogr. Sect. D: Biol. Crystallogr. 2010, 66, 486–501. 10.1107/S0907444910007493. [DOI] [PMC free article] [PubMed] [Google Scholar]
- Chen V. B.; Arendall W. B.; Headd J. J.; Keedy D. A.; Immormino R. M.; Kapral G. J.; Murray L. W.; Richardson J. S.; Richardson D. C. MolProbity: all-atom structure validation for macromolecular crystallography. Acta Crystallogr. Sect. D: Biological Crystallography 2010, 66, 12–21. 10.1107/S0907444909042073. [DOI] [PMC free article] [PubMed] [Google Scholar]
- Holm L.Structural Bioinformatics; Springer, 2020; pp 29–42. 10.1007/978-1-0716-0270-6_3. [DOI] [Google Scholar]
- Schrödinger, LLC. The PyMOL Molecular Graphics System, Version 1.8, 2015. https://www.pymol.org.
- Humphrey W.; Dalke A.; Schulten K. VMD: visual molecular dynamics. J. Mol. Graphics 1996, 14 (33–8), 27–8. 10.1016/0263-7855(96)00018-5. [DOI] [PubMed] [Google Scholar]
- Case D.; Aktulga H.; Belfon K.; Ben-Shalom I.; Brozell S.; Cerutti D.; Cheatham T. III; Cisneros G.; Cruzeiro V.; Darden T.; Duke R.; Giambasu G.; Gilson M.; Gohlke H.; Goetz A.; Harris R.; Izadi S.; Izmailov S.; Jin C.; Kasavajhala K.; Kaymak M.; King E.; Kovalenko A.; Kurtzman T.; Lee T.; LeGrand S.; Li P.; Lin C.; Liu J.; Luchko T.; Luo R.; Machado R.; Man R.; Manathunga M.; Merz K.; Miao K.; Mikhailovskii O.; Monard G.; Nguyen H.; O’Hearn K.; Onufriev A.; Pan F.; Pantano S.; Qi R.; Rahnamoun A.; Roe D.; Roitberg A.; Sagui C.; Schott-Verdugo S.; Shen J.; Simmerling J.; Skrynnikov N.; Smith J.; Swails J.; Walker R.; Wang J.; Wei H.; Wolf R.; Wu X.; Xue Y.; York D.; Zhao S.; Kollman P.. Amber 2021; University of California, San Francisco, 2021. https://ambermd.org/. [Google Scholar]
- Tian C.; Kasavajhala K.; Belfon K. A.; Raguette L.; Huang H.; Migues A. N.; Bickel J.; Wang Y.; Pincay J.; Wu Q.; et al. ff19SB: Amino-acid-specific protein backbone parameters trained against quantum mechanics energy surfaces in solution. J. Chem. Theory Comput. 2020, 16, 528–552. 10.1021/acs.jctc.9b00591. [DOI] [PMC free article] [PubMed] [Google Scholar]
- Wang J.; Wolf R. M.; Caldwell J. W.; Kollman P. A.; Case D. A. Development and testing of a general amber force field. J. Comput. Chem. 2004, 25, 1157–1174. 10.1002/jcc.20035. [DOI] [PubMed] [Google Scholar]
- Jakalian A.; Jack D. B.; Bayly C. I. Fast, efficient generation of high-quality atomic charges. AM1-BCC model: II. Parameterization and validation. J. Comput. Chem. 2002, 23, 1623–1641. 10.1002/jcc.10128. [DOI] [PubMed] [Google Scholar]
- Søndergaard C. R.; Olsson M. H.; Rostkowski M.; Jensen J. H. Improved treatment of ligands and coupling effects in empirical calculation and rationalization of p K a values. J. Chem. Theory Comput. 2011, 7, 2284–2295. 10.1021/ct200133y. [DOI] [PubMed] [Google Scholar]
- Olsson M. H.; Søndergaard C. R.; Rostkowski M.; Jensen J. H. PROPKA3: consistent treatment of internal and surface residues in empirical p K a predictions. J. Chem. Theory Comput. 2011, 7, 525–537. 10.1021/ct100578z. [DOI] [PubMed] [Google Scholar]
- Eastman P.; Swails J.; Chodera J. D.; McGibbon R. T.; Zhao Y.; Beauchamp K. A.; Wang L. P.; Simmonett A. C.; Harrigan M. P.; Stern C. D.; Wiewiora R. P.; Brooks B. R.; Pande V. S. OpenMM 7: Rapid development of high performance algorithms for molecular dynamics. PLoS Comput. Biol. 2017, 13, e1005659 10.1371/journal.pcbi.1005659. [DOI] [PMC free article] [PubMed] [Google Scholar]
- Aravena D.; Atanasov M.; Auer A. A.; Becker U.; Bistoni G.; Brehm M.; Bykov D.; Chilkuri V. G.; Datta D.; Dutta A. K.; Ganyushin D.; Garcia M.; Guo Y.; Hansen A.; Helmich-Paris B.; Huntington L.; Izsak R.; Kollmar C.; Kossmann S.; Krupicka M.; Lang L.; Lenk D.; Liakos D.; Manganas D.; Pantazis D.; Petrenko T.; Pinski P.; Reimann C.; Retegan M.; Riplinger C.; Risthaus T.; Roemelt M.; Saitow M.; Sandhoefer B.; Sen A.; Sivalingam K.; de Souza B.; Stoychev G.; Van den Heuvel W.; Wezisla B.; Wennmohs F.. ORCA—an ab initio, density functional and semiempirical program package, version 4.2; Max Planck Institute for Kohlenforschung, Muelheim, Germany, 2021. [Google Scholar]
- Blomberg M. R. A.; Borowski T.; Himo F.; Liao R.-Z.; Siegbahn P. E. M. Quantum Chemical Studies of Mechanisms for Metalloenzymes. Chem. Rev. 2014, 114, 3601–3658. 10.1021/cr400388t. [DOI] [PubMed] [Google Scholar]
- Perdew J. P. Density-functional approximation for the correlation energy of the inhomogeneous electron gas. Phys. Rev. B 1986, 33, 8822–8824. 10.1103/PhysRevB.33.8822. [DOI] [PubMed] [Google Scholar]
- Becke A. D. Density functional calculations of molecular bond energies. J. Chem. Phys. 1986, 84, 4524–4529. 10.1063/1.450025. [DOI] [Google Scholar]
- Schäfer A.; Horn H.; Ahlrichs R. Fully optimized contracted Gaussian basis sets for atoms Li to Kr. J. Chem. Phys. 1992, 97, 2571–2577. 10.1063/1.463096. [DOI] [Google Scholar]
- Grimme S.; Antony J.; Ehrlich S.; Krieg H. A consistent and accurate ab initio parametrization of density functional dispersion correction (DFT-D) for the 94 elements H-Pu. J. Chem. Phys. 2010, 132, 154104. 10.1063/1.3382344. [DOI] [PubMed] [Google Scholar]
- Grimme S.; Ehrlich S.; Goerigk L. Effect of the damping function in dispersion corrected density functional theory. J. Comput. Chem. 2011, 32, 1456–1465. 10.1002/jcc.21759. [DOI] [PubMed] [Google Scholar]
- Lee C.; Yang W.; Parr R. G. Development of the Colle-Salvetti correlation-energy formula into a functional of the electron density. Phys. Rev. B 1988, 37, 785–789. 10.1103/PhysRevB.37.785. [DOI] [PubMed] [Google Scholar]
- Becke A. D. Density-functional thermochemistry. III. The role of exact exchange. J. Chem. Phys. 1993, 98, 5648–5652. 10.1063/1.464913. [DOI] [Google Scholar]
- Cossi M.; Rega N.; Scalmani G.; Barone V. Energies, structures, and electronic properties of molecules in solution with the C-PCM solvation model. J. Comput. Chem. 2003, 24, 669–681. 10.1002/jcc.10189. [DOI] [PubMed] [Google Scholar]
- Dunlap B. I.; Connolly J. W. D.; Sabin J. R. On some approximations in applications of Xα theory. J. Chem. Phys. 1979, 71, 3396–3402. 10.1063/1.438728. [DOI] [Google Scholar]
- Baerends E.; Ellis D.; Ros P. Self-consistent molecular Hartree–Fock–Slater calculations I. The computational procedure. Chem. Phys. 1973, 2, 41–51. 10.1016/0301-0104(73)80059-X. [DOI] [Google Scholar]
- Weigend F. Accurate Coulomb-fitting basis sets for H to Rn. Phys. Chem. Chem. Phys. 2006, 8, 1057–1065. 10.1039/b515623h. [DOI] [PubMed] [Google Scholar]
- Retegan M.mep.py, 2021. https://gist.github.com/mretegan/5501553.
- Pettersen E. F.; Goddard T. D.; Huang C. C.; Couch G. S.; Greenblatt D. M.; Meng E. C.; Ferrin T. E. UCSF Chimera—A visualization system for exploratory research and analysis. J. Comput. Chem. 2004, 25, 1605–1612. 10.1002/jcc.20084. [DOI] [PubMed] [Google Scholar]
Associated Data
This section collects any data citations, data availability statements, or supplementary materials included in this article.