

Abstract
In this study, we designed and fabricated transmission parts for a flapping-wing micro-aerial vehicle (FW-MAV), which was fabricated by precision injection molding, and analyzed its warpage phenomena. First, a numerical simulation (Moldflow) was used to analyze the runner balance and temperature, pressure, and stress distributions of the base, gears, and linkage of the transmission structures in an FW-MAV. These data were then applied to fabricate a steel mold for an FW-MAV. Various process parameters (i.e., injection temperature, mold temperature, injection pressure, and packing time) for manufacturing transmission parts for the FW-MAV by precision injection molding were compared. The Taguchi method was employed to determine causes of warpage in the transmission parts. The experimental results revealed that the causes of warpage in the transmission parts were, in order of importance, the mold temperature, injection pressure, packing time, and injection temperature. After the transmission parts were assembled on the FW-MAV, experiments revealed that the MAV could achieve a flight time of 180 s. Mass production of the FW-MAV by precision injection molding could potentially produce substantial savings in time, manpower, and cost.
Keywords: flapping-wing micro-aerial vehicle, precision injection molding, Taguchi method, warpage, optimization
1. Introduction
Advancing knowledge of flapping-wing aerodynamics has prompted the development of small-scale flight vehicles. Promising studies of prototypes include Ashley [1] and a study by Pronsin et al. [2], which presented the first microelectromechanical system (MEMS)-based wing with a titanium-alloy metal (Ti6Al4V) wing structure and a parylene-C wing membrane. Yang et al. [3] fabricated a smart wing with polyvinylidene difluoride (PVDF)-parylene composite skin by an MEMS process and a four-bar linkage transmission system for flapping wings. Comparisons of flapping-wing micro-aerial vehicles (FW-MAVs) are given Table 1 [1,2,3,4,5,6,7,8,9,10,11,12,13,14,15,16,17,18,19,20,21,22,23,24,25,26,27,28,29,30].
Table 1.
References for flapping-wing micro-aerial vehicles.
| Author | Material | Flapping-Wing Type | Fabrication | Flight Time |
|---|---|---|---|---|
| Ashley [1] | Polymer | Fixed wing | Unknown | 960 s |
| Sirirak [2] | Titanium alloy /carbon fiber | Bird | Microelectromechinal system (MEMS) | 80 s |
| Yang [3] | Polyvinylidene dufluonicle (PVDF) | Bird | MEMS | 90 s |
| Ramasamy [4] | Composite carbon fiber | Bird | MEMS | Angle degree |
| Zhang [5] | Carbon fiber reinforced polymer | Bird | MEMS | 100 s |
| Sai [6] | Non-woven fabric plastic | Bird | MEMS | Angle degree |
| Deng [7] | Polymer | Bird | Performed by author’s Lab | Angle degree |
| Phan [8] | Carbon/epoxy | Bee | Performed by author’s Lab | Angle degree |
| Phan [9] | Carbo/epoxy | Bee | Performed by author’s Lab | Flapping Moment |
| Phan [10] | Polyethylene terephthalate | Beetle | MEMS | 1.5 m height on 3 s |
| Truong [11] | POM | Bird | CNC processing | Optimization for gear |
| Badrya [12] | Simulation | Dipteral insert | Simulation | Flapping force |
| Hassanalian [13] | Polymer | Bird | Performed by author’s Lab | 50 m height |
| Nguyen [14] | POM/carbon fiber | Bird | CNC | Thrust |
| Bluman [15] | Model/simulation | Bumblebee | Model/simulation | Angle degree |
| Lu [16] | Carbon fiber | Bat | Performed by author’s Lab | Nosie |
| Herrero [17] | Polystyreme | Bird | CNC | Angle degree |
| Yang [18] | POM/Al/Ti | Bird (dove) |
Bird | CNC |
| Nan [19] (review) |
Polymer Cabon fiber Ti |
Insect Bird |
MEMS CNC Mold |
Thrust Angle degree |
| Nguyen [20] | POM/Carbon fiber | Insect | CNC | Flight speed |
| Jankauski [21] | Model/simulation | Insect | Model/simulation | Frequency |
| Badrya [22] | Polymer | Insect | CNC | Lift force drag force |
| Cao [23] | Polyacrylate | Insect | CNC | Flight speed |
| Gallar [24] | Carbon fiber | Fiber | CNC | Flight speed |
| Lane [25] | PLA/carbon spars/epoxy/Malar | Insect (bumblebee) |
3D printing | Thrust |
| Lee [26] | Model/simulation | Bird | Model/simulation | Angle degree |
| Dong [27] | Polymer | Bird | Performed by author’s Lab | Angle degree |
| Yoon [28] | Carbon/epoxy | Bird | CNC | Camber angle |
| Nauyen [29] | Model/simulation | Insect (beetle) |
Model/simulation | Angle of attack |
| Wang [30] | Model/simulation | Insect | Model/simulation | Angle degree |
| This study | POM | Bird | CNC/mold | 180 s |
Precision injection molding (PIM) is used to manufacture microstructures and is among the most common and versatile methods for mass-producing complex plastic parts. Sul et al. [31] numerically simulated an experimental micro-nozzle. The mold temperature was found to be a key process parameter in injection molding. Shen et al. [32] applied micro-injection molding and micro-injection compression molding to form light-guided plate microstructures. The mold temperature was found to be the key parameter in both processes. Although PIM is a very simple method, the interplay among processing conditions, mold geometry, and material properties is extremely complex. This complexity has motivated the development of process modeling software [33]. Wan et al. [34] performed a Moldflow analysis of window frame manufacturing by injection molding. Jansen et al. [35] studied the effect of processing conditions on mold shrinkage of seven common thermoplastic polymers. The holding pressure was a key parameter, while the effect of the melt temperature was slightly less important. Gao et al. [36] indicated an adaptive optimization method based on the Kriging surrogate model to minimize part warpage by optimizing process parameters for injection molding. The melt temperature was a major key factor affecting warpage of the parts. Hakimian and Sulong [37] investigated the effects of injection molding parameters and types of thermoplastic composites on the shrinkage and warpage properties through numerical simulations using an experimental design method. Oktem et al. [38] focused on applying the Taguchi optimization technique to find optimal levels of process parameters used in the injection of thin-shell plastic components by improving the warpage problem with shrinkage variations. Su et al. [39] revealed optimization of the evaluation of micro-injection molding parameters of a light-guide plate with the Taguchi method. Significant factors affecting the depth of the v-cut were the mold temperature, packing pressure, packing switching, and packing time.
The goal of this study was to use a plastic material (polyoxymethylene, POM) instead of aluminum for the transmission parts of an FW-MAV. This study applied a numerical simulation to calculate the value of the runner balance and temperature, pressure, and stress distributions of the transmission components of an FW-MAV. Following results of a numerical simulation, data were used as a reference for mold fabrication. Then, this study employed PIM to manufacture transmission parts for an FW-MAV. The processing windows of PIM for the transmission parts were discussed. The aim of this study was to apply the Taguchi method to determine the minimum warpage of transmission parts of an FW-MAV fabricated by PIM. Finally, the optimal processing method for mass producing the MAV parts was determined.
2. Experimental Methods
The original MAV and its transmission parts (aluminum, Al 6061, Tripod Aluminum Co., Ltd., Changhua, Taiwan) that were developed by the authors’ lab are shown in Figure 1a,b. The transmission parts of the original MAV were fabricated by a wire computer numerical control (CNC) process, which is expensive and time consuming. The objective of this study was to find an effective alternative. This study redesigned the transmission parts (using plastic material) of an FW-MAV and employed PIM to fabricate the transmission parts. Figure 2 shows the dimensions of the transmission parts of the FW-MAV, consisting of the base, gears, and linkages.
Figure 1.
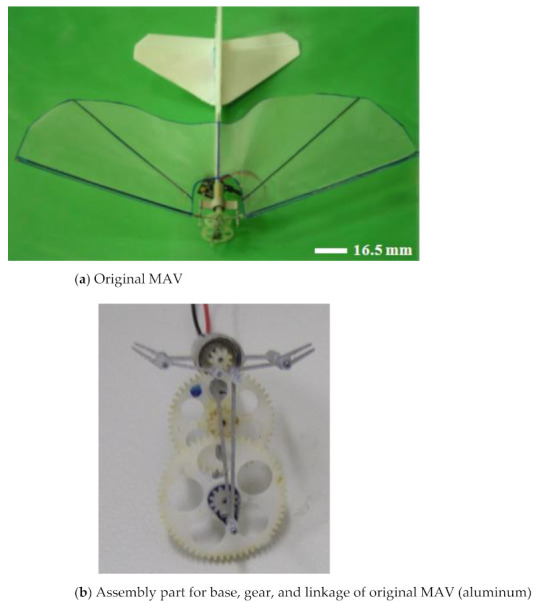
Product of the original flapping-wing MAV.
Figure 2.


The dimensions of flapping-wing MAV’s parts.
Numerical simulation (Moldflow software, Autodesk, San Rafael, CA, USA) was used to simulate warpage of the base, gears, and linkages and to balance the runner of the FW-MAV. The governing equations for mass, momentum, and energy conservation for a non-isothermal, generalized Newtonian fluid are as follows.
Continuity equation:
| (1) |
Momentum equation:
| (2) |
| (3) |
| (4) |
Energy equation:
| (5) |
Then,
| (6) |
where x, y, and z are Cartesian coordinates, t is the time, ρ is the density, u, v, and w are velocities, P is pressure, g is gravity, η is viscosity, cp is the specific heat, k is the thermal conductivity, T is the temperature, and is the shear rate.
The model for fluid viscosity is
| (7) |
| (8) |
| (9) |
| (10) |
| (11) |
where T* denotes the glass-transition temperature and m represents the flow index.
Boundary and initial conditions were as follows:
| (12) |
| (13) |
| (14) |
| (15) |
where Tw is the mold temperature, n is the normal direction and ve is the inlet velocity.
The energy balance on the solid–liquid interface was calculated by the following equation:
| (16) |
| (17) |
where Ts is the solid temperature, Tl is the liquid temperature, Tm is the freezing temperature, s is the z-coordinate for the solid-liquid interface, Lh is the latent heat, ks is solid thermal conductivity, and kl is liquid thermal conductivity.
The model contained the following: (a) five independent variables of three velocities (u, v, and w), one pressure (P), and one temperature (T); and (b) one dependent variable of viscosity (η).
The governing equations in this study were solved by a finite element method. For details of the numerical simulations, see Chiang et al. [40]. A 3D mesh in the Moldflow analysis was used to examine the transmission parts (i.e., base, gears, and linkages) of the FW-MAV. The base parts of the FW-MAV model included 22,100 mesh elements, which were four-node tetrahedral elements, and 11,182 nodes (Figure 3a). The calculation time was about 2159 s for this case. The model had 19,402 mesh elements and 9800 nodes for the gear parts of the FW-MAV (Figure 3b). The calculation time was about 2608 s. Figure 3c shows that the linkage model of the FW-MAV had 32,056 mesh elements and 16,059 nodes. The calculation time was roughly 6029 s. Calculations were performed with Moldflow software (vers. 2009) on a PC equipped with a Pentium 6 3.5-GB CPU, 8 GB of memory, and a 1-TB hard drive.
Figure 3.


The meshes of Moldflow analysis on the parts of the flapping-wing MAV.
A three-plate mold was utilized during PIM. The mold material was T−20. The inlet gate of the three-plate mold had a sidewall pin gate. The mold hardness was 350 micro Vickers (HMV). Figure 4 shows the mold and cavity dimensions for the base, gear, and linkage parts of the FW-MAV. The injection molding machine (220S; Arburg Co., Ltd., Loßburg, Germany) had a screw diameter of 18 mm and clamping force of 25 tons. The mold temperature control machine was the 300S type (Regloplas, St Gallen, Switzerland), with an accuracy of ±1 °C. The transmission parts of the FW-MAV used POM (Delrin@ 900P, DuPont, Wilmington, DE, USA). Its density, tensile strength, tensile modulus, and flexural modulus were 1.42 g/cm3, 70 MPa, 3.3 GPa, and 3.0 GPa, respectively. Its distortion temperature was 162 °C. POM material is a milky-white opaque crystalline thermoplastic with a high elastic modulus, high rigidity, and high hardness, and its specific strength and specific rigidity are close to that of metal. It has strong tensile strength, high flexural strength, reverse fatigue, and good impact resistance. Its friction coefficient is small, its wear resistance is good, and its dimensional stability is good. To sum up, the POM material was selected as the transmission part’s material in this study. The objective was to obtain optimal processing for the transmission parts of the FW-MAV by PIM. PIM processing parameters were the mold temperature (A), melt temperature (B), injection pressure (C), and packing pressure (D). Table 2 indicates the levels and values of the processing parameters of PIM using POM. Due to the numerous and widely varying process parameters involved, the Taguchi [41] method was used to optimize processing conditions in order to minimize warpage of the transmission parts of the FW-MAV. Determining the relative significance of these four process parameters required an array of experiments with as many as 34 runs each. An L9 orthogonal array table was generated to determine the optimal processing conditions to produce minimum warpage during PIM.
Figure 4.


Molds for flapping-wing MAV.
Table 2.
Processing parameters for base/gear/linkage.
| Parameters | Levels | ||
|---|---|---|---|
| Level 1 | Level 2 | Level 3 | |
| A. Mold temperature (°C) | 80/80/80 | 90/90/90 | 100/100/100 |
| B. Melt temperature (°C) | 200/200/200 | 210/210/210 | 220/220/220 |
| C. Injection pressure (bar) | 300/300/300 | 400/400/400 | 500/500/500 |
| D. Packing time (s) | 1/1/1 | 1.5/1.5/1.5 | 2/2/2 |
The error allowance was essential during the final assembly of the MAV after PIM was used to fabricate each part. The main objective of this study was to analyze the warpage of the transmission parts. This study optimized process conditions to find relationships between process parameters and warpage for each transmission part of the FW-MAV. A coordinate measurement machine (CMM) was used to measure the product error of each part of the FW-MAV. This CMM had a three-dimensional (3D) laser scanner (Hawk, Nextc, UK), which measured the warpage of the transmission parts. Figure 5 reveals the measurement points used to calculate the warpage of each transmission part of the FW-MAV.
Figure 5.


The measurement points for each part of the flapping-wing MAV.
An analysis of variance (ANOVA) was separately performed for the warpage results of each transmission part of the FW-MAV, over the noise performance measure (NPM) of the signal-to-noise (S/N) ratio. The sum of squares of the total variance vector, and total degrees of freedom, , were calculated using the following equations:
| (18) |
| (19) |
The sum of squares of the factor effect vector and factor degrees of freedom were calculated using the following equations.
| (20) |
| (21) |
The sum of squares of the error vector, and error degrees of freedom, , were calculated with the following equations.
| (22) |
| (23) |
The calculated experimental error, , was
| (24) |
In these equations, yij is the data from the j-th replicate of the i-th experiment, ȳk is the response of the factor at the k level, Si is the standard deviation per experiment, n is the experiment, r is the number of replicates, and L is the level number.
3. Results and Discussion
Figure 6 indicates the deflection distribution in the X-Z plane of the transmission parts of the FW-MAV in the Moldflow analysis. The deflection analytical results (Figure 6a) show that the maximum negative (−) deflection was at the base end close to the motor, whereas the maximum positive (+) deflection was at the other end of the base. The maximum warpage value was 0.2935 mm for the deflection difference of the base part. It could be seen from the results that the amount of warpage was large, so it was necessary to adjust the characteristic size of the mold insert part during the mold making process to improve the accuracy of the finished product (base). The maximum deflection was positive on the left side of the gear (Nos. 3 and 4) of the FW-MAV and negative on the right side (Figure 6b). The maximum warpage value was 0.1617 mm for the deflection difference of the gear part. The maximum warpage was mostly concentrated in the large gear and middle gear. The results showed that the warpage caused the outer diameter of the gear to shrink and create errors in the fit between the gears. The warpage caused by the uneven shrinkage of the gear could be avoided by increasing the characteristic size of the mold cavity to improve the accuracy of the finished product (gear) during the manufacture of the mold. Figure 6c reveals that the positive deflection was at its maximum on the left end of the linkage (Nos. 5 and 6), and the negative deflection was maximum on the right end of the No. 5 linkage. The maximum warpage value was 0.1389 mm for the deflection difference of the linkage part. It could also be seen from the results that the amount of warpage was large; hence, it was necessary to adjust the characteristic size of the mold insert part when making the mold to improve the accuracy of the finished product (linkage).
Figure 6.


Deflection distribution of X-Z plane for Moldflow analysis on the flapping-wing MAV’s parts. The red circle is the end point of the plastic flow front flowing into the mold cavity.
This study used CMM to measure warpage in the transmission parts of an FW-MAV produced by PIM. The goal of optimal PIM processing is to minimize warpage; the S/N ratio of the Taguchi method must reach a minimum value. Table 3, Table 4 and Table 5 display S/N ratios of warpage of the base-gear-linkage parts of the FW-MAV. Figure 7a shows the S/N ratio with factor levels for warpage of the base part based on Table 3 in PIM. Optimal factor levels for minimizing warpage during PIM were A3B2C1D2 based on this figure’s results. These optimized factor levels meant that a mold temperature of 100 °C, a melt temperature of 210 °C, an injection pressure of 300 bar, and a packing time of 1.5 s were optimal. The data also revealed that the mold temperature was the key process parameter, followed by the injection pressure, and packing pressure while the melt temperature was inconsequential. According to the ANOVA, factor integration of the error term variation did not influence the error of the calculated results of the S/N ratio of the variation, which was large; this meant that the factor had an influence, or otherwise it would belong to the result of the experimental error. S/N ratios of warpage of the gear parts of the FW-MAV are given in Table 4. Table 5 shows the S/N ratio of warpage of the linkage part for the FW-MAV.The variance analysis table of the S/N ratio of warpage of the base part with PIM clearly showed that the variance of the mold temperature’s results was larger than those of the other three process parameters (Table 6). We integrated the factor variances of B, C, and D into the error term and obtained pooled errors, as shown in Table 6. One can see from the table that the most important parameter was the mold temperature with a confidence level of 99.76%. To sum up, we found that the mold temperature was the most important process parameter for PIM for making the base part of an FW-MAV, based on Table 3, Table 6, Table 7 and Figure 7a.
Table 3.
S/N ratio of warpage of base part for the MAV.
| Exp. | y1 | y2 | y3 | y4 | y5 | Ave. | S | S/N |
|---|---|---|---|---|---|---|---|---|
| 1 | 0.0183 | 0.0182 | 0.0178 | 0.0179 | 0.0175 | 0.0179 | 0.0003 | 35.0238 |
| 2 | 0.0172 | 0.0172 | 0.0162 | 0.0165 | 0.0160 | 0.0166 | 0.0006 | 35.7912 |
| 3 | 0.0118 | 0.0120 | 0.0110 | 0.0120 | 0.0100 | 0.0114 | 0.0009 | 39.1483 |
| 4 | 0.0124 | 0.0124 | 0.0126 | 0.0124 | 0.0127 | 0.0125 | 0.0001 | 38.0152 |
| 5 | 0.0132 | 0.0132 | 0.0136 | 0.0137 | 0.0138 | 0.0135 | 0.0003 | 37.2654 |
| 6 | 0.0185 | 0.0185 | 0.0190 | 0.0192 | 0.0189 | 0.0188 | 0.0003 | 34.4095 |
| 7 | 0.0320 | 0.0320 | 0.0320 | 0.0320 | 0.0320 | 0.0320 | 0.0000 | 29.8970 |
| 8 | 0.0400 | 0.0450 | 0.0420 | 0.0430 | 0.0440 | 0.0428 | 0.0019 | 27.3291 |
| 9 | 0.0370 | 0.0370 | 0.0360 | 0.0380 | 0.0400 | 0.0376 | 0.0015 | 28.3963 |
| Optimum | 0.001 | 0.002 | 0.001 | 0.003 | 0.001 | 0.0022 | 0.0000 | 53.1515 |
| Average | 0.0226 | 0.0007 | 33.9195 | |||||
Table 4.
S/N ratio of warpage of gear part for the MAV.
| Exp. | y1 | y2 | y3 | y4 | y5 | Ave. | S | S/N |
|---|---|---|---|---|---|---|---|---|
| 1 | 0.017 | 0.016 | 0.015 | 0.014 | 0.016 | 0.0156 | 0.0011 | 36.4653 |
| 2 | 0.012 | 0.010 | 0.014 | 0.016 | 0.014 | 0.0132 | 0.0023 | 36.6555 |
| 3 | 0.010 | 0.005 | 0.007 | 0.006 | 0.009 | 0.0074 | 0.0021 | 42.5701 |
| 4 | 0.012 | 0.014 | 0.011 | 0.010 | 0.009 | 0.0112 | 0.0019 | 39.9711 |
| 5 | 0.014 | 0.016 | 0.012 | 0.012 | 0.010 | 0.0128 | 0.0023 | 38.8829 |
| 6 | 0.019 | 0.019 | 0.019 | 0.019 | 0.019 | 0.0194 | 0.0000 | 34.2364 |
| 7 | 0.021 | 0.019 | 0.019 | 0.022 | 0.020 | 0.0202 | 0.0013 | 33.8195 |
| 8 | 0.024 | 0.028 | 0.025 | 0.021 | 0.027 | 0.0250 | 0.0027 | 32.2306 |
| 9 | 0.020 | 0.019 | 0.022 | 0.024 | 0.023 | 0.0216 | 0.0021 | 32.7600 |
| Optimum | 0.007 | 0.006 | 0.006 | 0.005 | 0.004 | 0.0056 | 0.0011 | 45.9063 |
| Average | 0.0163 | 0.0018 | 36.3990 | |||||
Table 5.
S/N ratio of shrinkage of linkage part for the MAV.
| Exp. | y1 | y2 | y3 | y4 | y5 | Ave. | S | S/N |
|---|---|---|---|---|---|---|---|---|
| 1 | 0.036 | 0.037 | 0.035 | 0.036 | 0.037 | 0.0362 | 0.0008 | 28.8717 |
| 2 | 0.026 | 0.028 | 0.032 | 0.029 | 0.030 | 0.0290 | 0.0022 | 30.3543 |
| 3 | 0.013 | 0.017 | 0.014 | 0.016 | 0.015 | 0.0150 | 0.0016 | 36.4653 |
| 4 | 0.019 | 0.020 | 0.019 | 0.020 | 0.021 | 0.0198 | 0.0008 | 33.9722 |
| 5 | 0.023 | 0.022 | 0.025 | 0.026 | 0.028 | 0.0248 | 0.0024 | 31.5802 |
| 6 | 0.049 | 0.043 | 0.040 | 0.041 | 0.039 | 0.0424 | 0.0040 | 27.9570 |
| 7 | 0.048 | 0.052 | 0.050 | 0.048 | 0.049 | 0.0494 | 0.0017 | 26.1949 |
| 8 | 0.055 | 0.052 | 0.058 | 0.063 | 0.063 | 0.0582 | 0.0049 | 24.2397 |
| 9 | 0.054 | 0.052 | 0.059 | 0.061 | 0.060 | 0.0572 | 0.0040 | 24.4362 |
| Optimum | 0.010 | 0.011 | 0.008 | 0.009 | 0.007 | 0.0090 | 0.0016 | 41.8932 |
| Average | 0.0369 | 0.0025 | 29.3413 | |||||
Figure 7.


Variation of the S/N ratio with factor levels for warpage of various parts of the flapping-wing MAV.
Table 6.
Variance analysis of S/N ratio of base (b), gear (g), and linkage (l) parts for the MAV.
| Factor | Square Sum | Degree of Freedom | Variance | F Distribution | Confidence |
|---|---|---|---|---|---|
| A | 130.20 (b) 55.07 (g) 87.30 (l) |
2 (b) 2 (g) 2 (l) |
65.100 (b) 27.536 (g) 43.648(l) |
3.4630 (b) 2.2244 (g) 2.4878 (l) |
91.75% (b) 82.95% (g) 85.55% (l) |
| B | 1.10 (b) 1.10 (g) 1.72 (l) |
2 (b) 2 (g) 2 (l) |
0.552 (b) 0.550 (g) 0.858 (l) |
0.0293 (b) 0.0444 (g) 0.0489 (l) |
2.88% (b) 4.32% (g) 4.74% (l) |
| C | 15.29 (b) 25.40 (g) 29.19 (l) |
2 (b) 2 (g) 2 (l) |
7.647 (b) 12.699 (g) 14.595 (l) |
0.4068 (b) 1.0259 (g) 0.8319 (l) |
32.12% (b) 59.88% (g) 53.03% (l) |
| D | 3.79 (b) 17.46 (g) 22.16 (l) |
2 (b) 2 (g) 2 (l) |
1.897 (b) 8.731 (g) 11.079 (l) |
0.1009 (b) 0.7053 (g) 0.6315 (l) |
9.49% (b) 47.77% (g) 44.36% (l) |
| Total | 150.39 (b) 99.03 (g) 140.36 (l) |
8 (b) 8 (g) 8 (l) |
Table 7.
Pooling of errors of S/N ratio of base, gear, and linkage parts for the MAV.
| Factor | Square Sum | Degree of Freedom | Variance | F Distribution | Probability | Confidence |
|---|---|---|---|---|---|---|
| A | 130.20 (b) 55.07 (g) 87.295 (l) |
2 (b) 2 (g) 2 (l) |
65.100 (b) 27.536 (g) 43.648 (l) |
19.3447 (b) 3.7584 (g) 4.935 (l) |
0.24% (b) 8.75% (g) 5.40% (l) |
99.76% (b) 91.25% (g) 94.60% (l) |
| B | Pooling of errors | |||||
| C | Pooling of errors | |||||
| D | Pooling of errors | |||||
| Error | 20.1917 (b) 43.9594 (g) 53.064 (l) |
6 (b) 6 (g) 6 (l) |
3.365 (b) 7.327 (g) 8.844 (l) |
S exp. Error = 1.8345 dB (b) S exp. Error = 2.7068 dB (g) S exp. Error = 2.974 dB (l) |
||
| Total | 150.3925 (b) 99.0321 (g) 140.359 (l) |
8 (b) 8 (g) 8 (l) |
||||
Figure 7b reveals S/N ratios with factor levels for warpage of the gear parts fabricated by PIM. Levels of optimal factors for minimizing warpage were A3B2C1D2 during PIM. These levels of optimized factors were a mold temperature of 100 °C, a melt temperature of 210 °C, an injection pressure of 300 bar, and a packing time of 1.5 s. The mold temperature was the key process parameter for minimizing warpage of the gears, followed by the injection pressure, packing time, and melt temperature. From the ANOVA results, the change in the error term did not affect the integration of the factor, which was larger than the change in the error of the S/N ratio of the calculated results, indicating that the factor had an influence, otherwise it belonged to the experimental error. The table with results of the S/N ratio variance analysis of the warpage of PIM gear parts clearly shows that the variance of the mold temperature’s results was larger than those of the other three process parameters (Table 6). We integrated the factor variances of B, C, and D into the error term and obtained the pooled errors in Table 7. It could be seen from the table that the most important parameter at a 94.60% confidence level was the mold temperature. Finally, this study determined that the mold temperature was the most important process parameter for PIM for making the gear parts of an FW-MAV, based on Table 4, Table 6, Table 7 and Figure 7b.
Table 5 shows the S/N ratio of warpage of the linkage part for the FW-MAV. Figure 7c indicates the S/N ratio with factor levels for warpage of the linkage part with PIM. Levels of optimum factors that were statistically likely to minimize warpage during PIM were A3B2C1D2. These optimized factors were a mold temperature of 100 °C, a melt temperature of 210 °C, an injection pressure of 300 bar, and a packing pressure of 1.5 s. The data revealed that the mold temperature was the key process parameter for minimizing warpage of the linkage part, followed by the injection pressure, packing time, and finally the melt temperature. By way of the ANOVA, transformation of the error term did not affect integration of the factor, which was larger than the transformation of the error S/N ratio of the calculated outcome, indicating that the factor had an influence, otherwise it belonged to the experimental error. The table with the results of the S/N ratio variance analysis of warpage of the linkage part in PIM clearly shows that the variance of the mold temperature’s results was larger than those of the other three process parameters (Table 6). We integrated the factor variances of B, C, and D into the error term. We obtained pooled errors in Table 7, which showed that the most important parameter at a 91.25% confidence level was the mold temperature. Finally, this study determined that the mold temperature was the most important processing parameter for PIM for making the linkage part of an FW-MAV, based on Table 5, Table 6, Table 7 and Figure 7c.
To sum up, the mold temperature was the most important processing parameter for PIM of the transmission parts of an FW-MAV.
Figure 8 shows the various molded parts of the transmission structure by PIM; the authors assembled these components as transmission parts on the FW-MAV. This study was able to fabricate good parts and assemble a fabricated FW-MAV.
Figure 8.
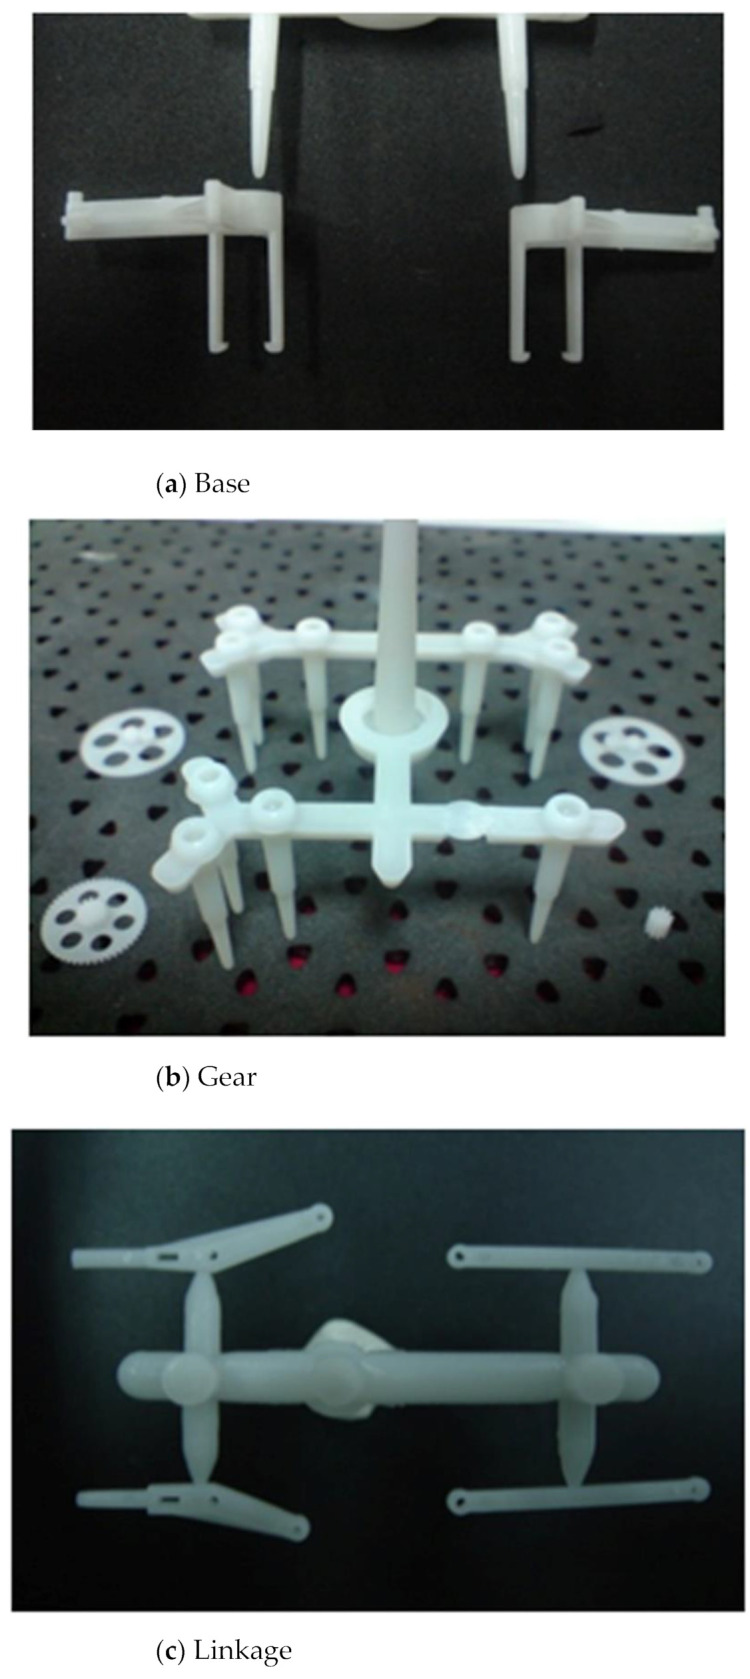

The real product for transmission structures of the flapping-wing MAV.
Table 8 compares the various properties of the FW-MAV with transmission components made of aluminum and plastic materials. The plastic components were lighter than the aluminum components. The weight of the transmission parts of the FW-MAV could be reduced by about 10% using plastic materials. Compared to aluminum parts, when plastic parts were used to mass produce FW-MAV transmission parts, the production process was simpler, the reproduction rate was higher, the production time was shorter, and the cost was lower. Finally, a redesigned and manufactured FW-MAV (transmission parts using plastic material) exhibited longer flight endurance.
Table 8.
Comparison results of the transmission structure of the flapping-wing MAV between aluminum alloy material and plastic material.
| Material Name | ||
|---|---|---|
| Aluminum (6061) | Plastic (POM) | |
| Total weight (g) | 2.528 | 2.279 |
| Fabrication method | WCNC | Precision injection molding |
| Processing | Half automation | Automation |
| Processing flowchart | Complex | Simple |
| Molding time (min/group) | 30 | 2 |
| Reproduction | Low | High |
| Percent defectives | High | Low |
| Costs (NT dollar) | 620 | 12.2 |
| Assembly learning time | Long | Short |
| Flying time (s) | 47 | 106 |
The passive design aspect of improving the performance of the wing frames for FW-MAVs in this study tended to provide a simpler flying platform with a moderate transmission module (base, linkage and gears) but it produced bountiful and interesting phenomena that deserve further biomimetic study. The unsteady lift data and the highly enhanced thrust locomotion acquired from wind tunnel testing greatly contributed to the successful flight of our MAVs. Finally, with the advantages of being lightweight and size miniaturization, we effectively extended the existing domain of MAVs. We herein found natural animals with inclined figure-of-eight flapping similar to our MAV by empirically comparing the wingtip trajectories [42].
4. Conclusions
The goal of this research was to fabricate transmission parts of an FW-MAV by PIM. The objective was to optimize fabrication process parameters using minimum warpage of the transmission parts as the judgment point. This study successfully used numerical simulations to acquire data as references for mold manufacturing. We determined that the mold temperature was the key process parameter of any transmission part of the FW-MAV during PIM. The optimal factor levels in terms of minimizing warpage during PIM were predicted to be A3B2C1D2 for all parts (base, gears, and linkage) of the FW-MAV. The optimal values were a mold temperature of 100 °C, a melt temperature of 210 °C, an injection pressure of 300 bar, and a packing time of 1.5 s. Finally, the experimental results of this study were successfully used to fabricate the transmission parts of an FW-MAV by PIM. The redesigned and fabricated MAV enabled not only the mass production by PIM, but also increased the flight endurance.
Author Contributions
Conceptualization, Y.-K.S.; methodology, H.-Y.H.; formal analysis, F.-Y.F., W.-C.L., and C.-F.H.; writing—original draft, H.-Y.H.; writing—review & editing, Y.L. and M.R. All authors have read and agreed to the published version of the manuscript.
Funding
The authors thank the Ministry of Science and Technology, Taiwan, for financially supporting this research under contract no. MOST 110−2221-E-038–021.
Institutional Review Board Statement
Not applicable.
Informed Consent Statement
Not applicable.
Data Availability Statement
The data presented in this study are available on request from the corresponding author.
Conflicts of Interest
The authors claim that there is no conflict of interest.
Footnotes
Publisher’s Note: MDPI stays neutral with regard to jurisdictional claims in published maps and institutional affiliations.
References
- 1.Ashley S. Palm-size spy planes. Mech. Eng. 1998;120:74–78. doi: 10.1115/1.1998-FEB-3. [DOI] [Google Scholar]
- 2.Pornsin-Sirirak T.N., Tai Y.C., Nassef H., Ho C.M. Titanium-alloy MEMS wing technology for a micro aerial vehicle application. Sens. Actuators A Phys. 2001;89:95–103. doi: 10.1016/S0924-4247(00)00527-6. [DOI] [Google Scholar]
- 3.Yang L.J., Hsua C.K., Hoa J.Y., Feng C.K. Flapping wings with PVDF sensors to modify the aerodynamic forces of a micro aerial vehicle. Sens. Actuators A: Phys. 2007;139:95–103. doi: 10.1016/j.sna.2007.03.026. [DOI] [Google Scholar]
- 4.Ramasamy M., Leishman J.G., Lee T.E. Flow field of a rotating-wing micro air vehicle. J. Aircr. 2007;44:1236–1244. doi: 10.2514/1.26415. [DOI] [Google Scholar]
- 5.Zhang C., Rossi C. A review of compliant transmission mechanisms for bio-inspired flapping-wing micro air vehicles. Bioinspiration Biomim. 2017;12:025005. doi: 10.1088/1748-3190/aa58d3. [DOI] [PubMed] [Google Scholar]
- 6.Sai K.P.P.M., Bharadwaj K., Teja K.R., Dagamoori K., Tarun K.V.S., Vijayan V. Design, fabrication and testing of flapping wing micro air vehicle. Int. J. Eng. Res. Appl. 2016;6:133–150. [Google Scholar]
- 7.Deng S., Oudheusden B.V. Wake structure visualization of a flapping-wing Micro-Air-Vehicle in forward flight. Aerosp. Sci. Technol. 2016;50:204–211. doi: 10.1016/j.ast.2016.01.003. [DOI] [Google Scholar]
- 8.Phan H.V., Park H.C. Generation of Control Moments in an Insect-like Tailless Flapping-wing Micro Air Vehicle by Changing the Stroke-plane Angle. J. Bionic Eng. 2016;13:449–457. doi: 10.1016/S1672-6529(16)60318-9. [DOI] [Google Scholar]
- 9.Phan H.V., Au T.K.L., Park H.C. Clap-and-fling mechanism in a hovering insect-like two-winged flapping-wing micro air vehicle. R. Soc. Open Sci. 2016;3:160746. doi: 10.1098/rsos.160746. [DOI] [PMC free article] [PubMed] [Google Scholar]
- 10.Phan H.V., Kang T., Park H.C. Design and stable flight of a 21 g insect-like tailless flapping wing micro air vehicle with angular rates feedback control. Bioinspiration Biomim. 2017;12:036006. doi: 10.1088/1748-3190/aa65db. [DOI] [PubMed] [Google Scholar]
- 11.Van Truong T., Kureemun U., Tan V.B.C., Lee H.P. Study on the structural optimization of a flapping wing micro air vehicle. Struct. Multidiscip. Optim. 2017;57:653–664. doi: 10.1007/s00158-017-1772-7. [DOI] [Google Scholar]
- 12.Badrya C., Sridharan A., Baeder J.D., Kroninger C.M. Multi-Fidelity Coupled Trim Analysis of a Flapping-Wing Micro Air Vehicle Flight. J. Aircr. 2017;54:1614–1630. doi: 10.2514/1.C034236. [DOI] [Google Scholar]
- 13.Hassanalian M., Abdelkefi A., Wei M., Ziaei-Rad S. A novel methodology for wing sizing of bio-inspired flapping wing micro air vehicles: Theory and prototype. Acta Mech. 2016;228:1097–1113. doi: 10.1007/s00707-016-1757-4. [DOI] [Google Scholar]
- 14.Nguyen Q.V., Chan W.L., Debiasi M. Experimental investigation of wing flexibility on force generation of a hovering flap-ping wing micro air vehicle with double wing clap-and-fling effects. Int. J. Micro Air Vehicles. 2017;9:187–197. doi: 10.1177/1756829317695565. [DOI] [Google Scholar]
- 15.Bluman J.E., Kang C.-K., Shtessel Y. Control of a Flapping-Wing Micro Air Vehicle: Sliding-Mode Approach. J. Guid. Control. Dyn. 2018;41:1223–1226. doi: 10.2514/1.G003160. [DOI] [Google Scholar]
- 16.Lu Z., Debiasi M., Nguyen Q.V., Cha W.L. Bio-inspired low-noise wing design for a two-winged flapping wing micro air vehicle. AIAA J. 2018;56:4697–4705. doi: 10.2514/1.J056293. [DOI] [Google Scholar]
- 17.Del Estal Herrero A., Percin M., Karasek M., Van Oudheusden B. Flow Visualization around a Flapping-Wing Micro Air Vehicle in Free Flight Using Large-Scale PIV. Aerospace. 2018;5:99. doi: 10.3390/aerospace5040099. [DOI] [Google Scholar]
- 18.Yang W., Wang L., Song B. Dove: A biomimetic flapping-wing micro air vehicle. Int. J. Micro Air Veh. 2017;10:70–84. doi: 10.1177/1756829317734837. [DOI] [Google Scholar]
- 19.Nan Y., Peng B., Chen Y., Feng Z., McGlinchey D. Can Scalable Design of Wings for Flapping Wing Micro Air Vehicle Be Inspired by Natural Flyers? Int. J. Aerosp. Eng. 2018:1–24. doi: 10.1155/2018/9538328. [DOI] [Google Scholar]
- 20.Nguyen A.T., Han J.-H. Wing flexibility effects on the flight performance of an insect-like flapping-wing micro-air vehicle. Aerosp. Sci. Technol. 2018;79:468–481. doi: 10.1016/j.ast.2018.06.007. [DOI] [Google Scholar]
- 21.Jankauski M., Guo Z., Shen I. The effect of structural deformation on flapping wing energetics. J. Sound Vib. 2018;429:176–192. doi: 10.1016/j.jsv.2018.05.005. [DOI] [Google Scholar]
- 22.Badrya C., Govindarajan B., Baeder J.D., Harrington A., Kroninger C.M. Computational and Experimental Investigation of a Flapping-Wing Micro Air Vehicle in Hover. J. Aircr. 2019;56:1610–1625. doi: 10.2514/1.C035239. [DOI] [Google Scholar]
- 23.Cao C., Burgess S., Conn A.T. Toward a Dielectric Elastomer Resonator Driven Flapping Wing Micro Air Vehicle. Front. Robot. AI. 2019;5 doi: 10.3389/frobt.2018.00137. [DOI] [PMC free article] [PubMed] [Google Scholar]
- 24.Gallar B.M., Van Oudheusden B.W., Sciacchitano A., Karásek M. Large-scale volumetric flow visualization of the unsteady wake of a flapping-wing micro air vehicle. Exp. Fluids. 2020;61:16. doi: 10.1007/s00348-019-2854-7. [DOI] [Google Scholar]
- 25.Lane P., Throneberry G., Fernandez I., Hassanalian M., Vasconcellos R., Abdelkefi A. Towards Bio-Inspiration, Development, and Manufacturing of a Flapping-Wing Micro Air Vehicle. Drones. 2020;4:39. doi: 10.3390/drones4030039. [DOI] [Google Scholar]
- 26.Lee J.G., Ryu S.G., Kim H.J. Stable flight of a flapping-wing micro air vehicle under wind disturbance; Proceedings of the 2020 IEEE/RSJ International Conference on Intelligent Robots and Systems (IROS); Las Vegas, NV, USA. 25–29 October 2020. [Google Scholar]
- 27.Dong X., Li D., Xiang J., Wang Z. Design and experimental study of a new flapping wing rotor micro aerial vehicle. Chin. J. Aeronaut. 2020;33:3092–3099. doi: 10.1016/j.cja.2020.04.024. [DOI] [Google Scholar]
- 28.Yoon S.-H., Cho H., Lee J., Kim C., Shin S.-J. Effects of camber angle on aerodynamic performance of flapping-wing micro air vehicle. J. Fluids Struct. 2020;97:103101. doi: 10.1016/j.jfluidstructs.2020.103101. [DOI] [Google Scholar]
- 29.Nguyen K., Au L.T.K., Phan H.-V., Park S.H., Park H.C. Effects of wing kinematics, corrugation, and clap-and-fling on aerodynamic efficiency of a hovering insect-inspired flapping-wing micro air vehicle. Aerosp. Sci. Technol. 2021;118:106990. doi: 10.1016/j.ast.2021.106990. [DOI] [Google Scholar]
- 30.Wang S., Song B., Chen A., Fu Q., Cui J. Modeling and flapping vibration suppression of a novel tailless flapping wing micro air vehicle. Chin. J. Aeronaut. 2022;35:309–328. doi: 10.1016/j.cja.2021.08.030. [DOI] [Google Scholar]
- 31.Su Y.-C., Shah J., Lin L. Implementation and analysis of polymeric microstructure replication by micro injection molding. J. Micromech. Microeng. 2003;14:415–422. doi: 10.1088/0960-1317/14/3/015. [DOI] [Google Scholar]
- 32.Shen Y.K. Comparison of height replication properties of micro-injection moulding and micro-injection–compression moulding for production of microstructures on lightguiding plates. Plast. Rubber Compos. 2007;36:77–84. doi: 10.1179/174328907X171244. [DOI] [Google Scholar]
- 33.Hill S.D.J. LIGA News Third Issue. 1995. [Google Scholar]
- 34.Wan A.W.A.R., Lee T.S., Rahmat A.R. Injection moulding simulation analysis of natural fiber composite window frame. J. Mater. Process. Technol. 2008;197:22. [Google Scholar]
- 35.Jansen K.M.B., Van Dijk D.J., Husselman M.H. Effect of processing conditions on shrinkage in injection molding. Polym. Eng. Sci. 1998;38:838–846. doi: 10.1002/pen.10249. [DOI] [Google Scholar]
- 36.Gao Y., Turng L.-S., Wang X. Process optimization and effects of material properties on numerical prediction of warpage for injection molding. Adv. Polym. Technol. 2008;27:199–216. doi: 10.1002/adv.20138. [DOI] [Google Scholar]
- 37.Hakimian E., Sulong A.B. Analysis of warpage and shrinkage properties of injection-molded micro gears polymer composites using numerical simulations assisted by the Taguchi method. Mater. Des. 2012;42:62–71. doi: 10.1016/j.matdes.2012.04.058. [DOI] [Google Scholar]
- 38.Oktem H., Erzurumlu T., Uzman I. Application of Taguchi optimization technique in determining plastic injection molding process parameters for a thin-shell part. Mater. Des. 2007;28:1271–1278. doi: 10.1016/j.matdes.2005.12.013. [DOI] [Google Scholar]
- 39.Su T.-L., Chen H.-W., Lu C.-F. Systematic optimization for the evaluation of the microinjection molding parameters of light guide plate with TOPSIS-based Taguchi method. Adv. Polym. Technol. 2010;29:54–63. doi: 10.1002/adv.20181. [DOI] [Google Scholar]
- 40.Chiang Y.C., Cheng H.C., Huang C.F., Lee J.J., Lin Y., Shen Y.K. Warpage phenomenon of thin-wall injection molding. Int. J. Adv. Manuf. Technol. 2011;55:517–526. doi: 10.1007/s00170-010-3106-4. [DOI] [Google Scholar]
- 41.Taguchi G. Introduction to Quality Engineering. McGraw-Hill; New York, NY, USA: 1990. [Google Scholar]
- 42.Yang L.J., Hsu C.K., Hsiao F.Y., Feng C.K., Shen Y.K. A micro-aerial-vehicle (MAV) with figure-of-eight flapping induced by flexible wing frames; Proceedings of the 47th AIAA Aerospace Sciences Meeting including the New Horizons Forum and Aerospace Exposition; Orlando, FL, USA. 5–8 January 2009; p. 092407. [Google Scholar]
Associated Data
This section collects any data citations, data availability statements, or supplementary materials included in this article.
Data Availability Statement
The data presented in this study are available on request from the corresponding author.