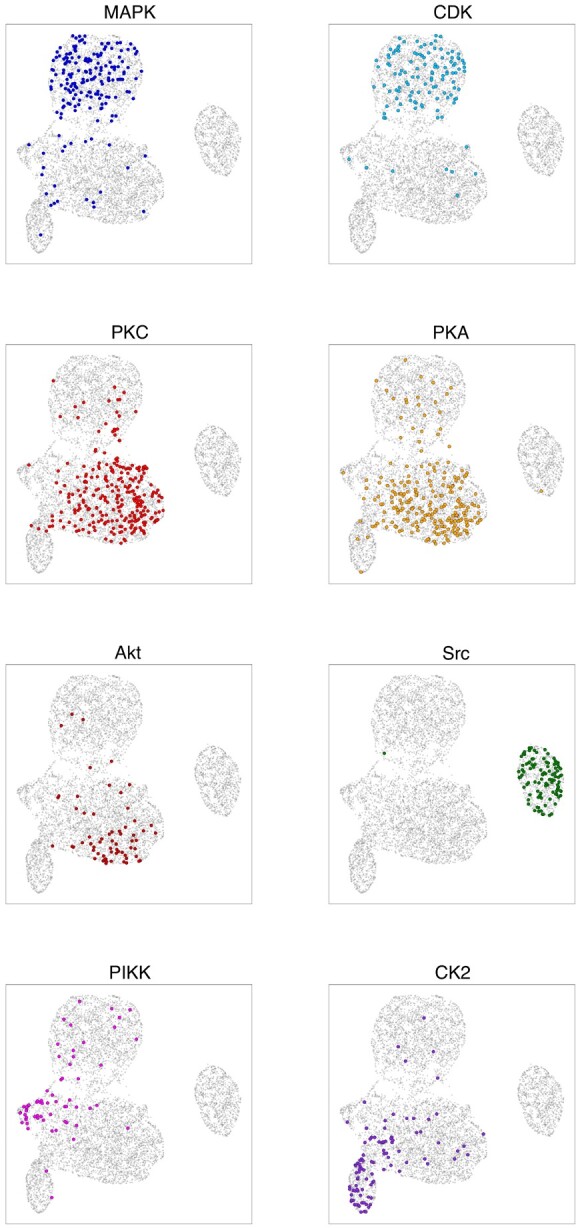
Fig. 4.

UMAP projection of the Siamese motif embedding, labeled per kinase family. Each point represents one of the 7302 motifs, and each of the eight panels displays kinase family-specific phosphorylation patterns. Each colored point corresponds to a motif in the test set phosphorylated by a member of the specified kinase family. The axes are the arbitrary x- and y-UMAP dimensions, which are consistent across panels, and are thus not indicated. Furthermore, highlighted points are slightly enlarged to enhance readability
