

Abstract
To study genetic factors associated with brain aging, we first need to quantify brain aging. Statistical models have been created for estimating the apparent age of the brain, or predicted brain age (PBA), using imaging data. Recent studies have refined these models to obtain a more accurate PBA, but research has yet to demonstrate the scientific value of doing so. Here, we show that a more accurate PBA leads to better characterization of genetic factors associated with brain aging. We trained a convolutional neural network (CNN) model on 16,998 UK Biobank subjects to derive PBA, then conducted a genome-wide association study on the PBA, in which we identified single nucleotide polymorphisms from four independent loci significantly associated with brain aging, three of which were novel. By comparing association results based on the CNN-derived PBA to those based on a linear regression-derived PBA, we concluded that a more accurate PBA enables the discovery of novel genetic associations. Our results may be valuable for identifying other lifestyle factors associated with brain aging.
Keywords: Predicted brain age, Relative brain age, Convolutional neural network, Genetics
1. Introduction
Brain structural changes that occur during the brain aging process vary between individuals. A long-standing question is how genetic and environmental factors contribute to this variation. To study factors associated with brain aging, we first need a method for quantifying brain aging. Statistical models have been developed to detect structural changes and assess the apparent age of the brain based on imaging data (Cole and Franke, 2017; Cole et al., 2017; Franke et al., 2010). The biomarker obtained from these models is referred to as the predicted brain age (PBA). By comparing PBA to chronological age, researchers can quantify whether a subject’s brain appears older or younger than expected, which reflects accelerated or decelerated aging of the brain, and can subsequently identify genetic factors, lifestyle factors, and diseases associated with brain aging (Franke et al., 2013; Jonsson et al., 2019; Ning et al., 2020b; Smith et al., 2019).
Recent advances in training CNNs, which are deep learning models that learn features in images with convolution operations without prior knowledge of what these features are, have allowed researchers to accomplish disease and phenotype classification and prediction with high accuracy (Esteva et al., 2017; Langner et al., 2019; Lin et al., 2018). Recently, Langner et al. trained a CNN for predicting age of the body based on whole-body MRI of about 20,000 subjects. The mean absolute error (MAE) between predicted ‘body age’ and true chronological age reached 2.5 years (Langner et al., 2019). Another recent study by Peng et al. reported that a CNN for predicting brain age based on MRI achieved an MAE of 2.14 years (Peng et al., 2021). Both studies focused on improving the accuracy of CNN models for age prediction; however, neither demonstrated why this is important. In other words, what is the scientific value of developing more accurate methods of measuring aging?
In our research, we explore whether a more accurate PBA helps to better characterize brain aging and leads to the identification of novel genetic factors associated with brain aging. Genetic factors associated with brain aging are important to identify because of their potential clinical applications, including detecting brain aging at an early stage and administering relevant interventions. Two recent studies investigated the association between single nucleotide polymorphisms (SNPs) and brain aging using UK Biobank data. Jonsson et al. used a CNN model for predicting brain age, where the predictor was the 3D MRI scan (Jonsson et al., 2019), while Ning et al. used a linear regression model for predicting brain age, where predictors were brain morphometric measurements derived from MRI scans (Ning et al., 2020b). Both studies reported MAE of about 3.5 years between PBA and the true chronological age and found an association between a chromosome 17 locus and brain aging. This locus includes the MAPT gene, where mutations have been associated with dementia and Parkinson’s disease (Goedert, 2015). Additional genetic factors associated with brain aging have yet to be identified.
In our study, we used a large sample of brain imaging data of 16,998 UK Biobank subjects to train a CNN to obtain PBA. Next, we calculated relative brain age (RBA), a metric that describes a subject’s PBA relative to peers (Ning et al., 2020b), based on CNN-derived PBA. We then conducted a genome-wide association study to identify SNPs significantly associated with RBA. We assessed whether the CNN-derived PBA more accurately captured brain aging than a linear regression-derived PBA, which we previously used (Ning et al., 2020b), by comparing the MAE of these two models. Further, because decline in cognitive function is associated with brain aging (Creasey and Rapoport, 1985; Luo and Craik, 2008), we investigated whether the CNN-derived PBA showed stronger associations with cognitive functions than did the linear regression-derived PBA. We also compared the SNPs associated with the CNN-derived RBA to those associated with a regression-derived RBA. Our goal was to leverage a large sample to investigate whether the CNN is more accurate than a linear regression model in characterizing brain aging, therefore enabling the discovery of a greater number of genetic variants associated with brain aging. If this is the case, we would suggest that CNN-derived RBA could also be used to more effectively investigate the association between brain aging and lifestyle and disease factors.
2. Material and methods
2.1. Summary of samples used
A sample of 16,998 subjects from the UK Biobank study with European ancestry who had both T1 MRI brain scans and genetic data were included in the study. All these subjects were free of brain and nervous system related illness, including cognitive impairment, neurological disorders, or stroke, etc. Details of subjects inclusion criteria are described elsewhere (Ning et al., 2020b). Subjects’ ages ranged from 45 to 81 years (mean = 63 years), with 53% identified as female. The T1 brain scans were registered to MNI 152 space using linear and then nonlinear registration. Brain-extracted T1 were then obtained and used for training the CNN model (Smith et al., 2020). Two important cognitive function scores, response time (N=15,678) and visual memory (N=15,737), were obtained for most subjects. The genetic data included 538,476 quality-controlled SNPs. Details of the brain imaging data, cognitive function data, and genetic data have been described previously (Ning et al., 2020a; Ning et al., 2020b; UKBiobank, 2015).
2.2. Obtaining predicted brain age and relative brain age based on a CNN model
2.2.1. Training CNN models for predicting brain age
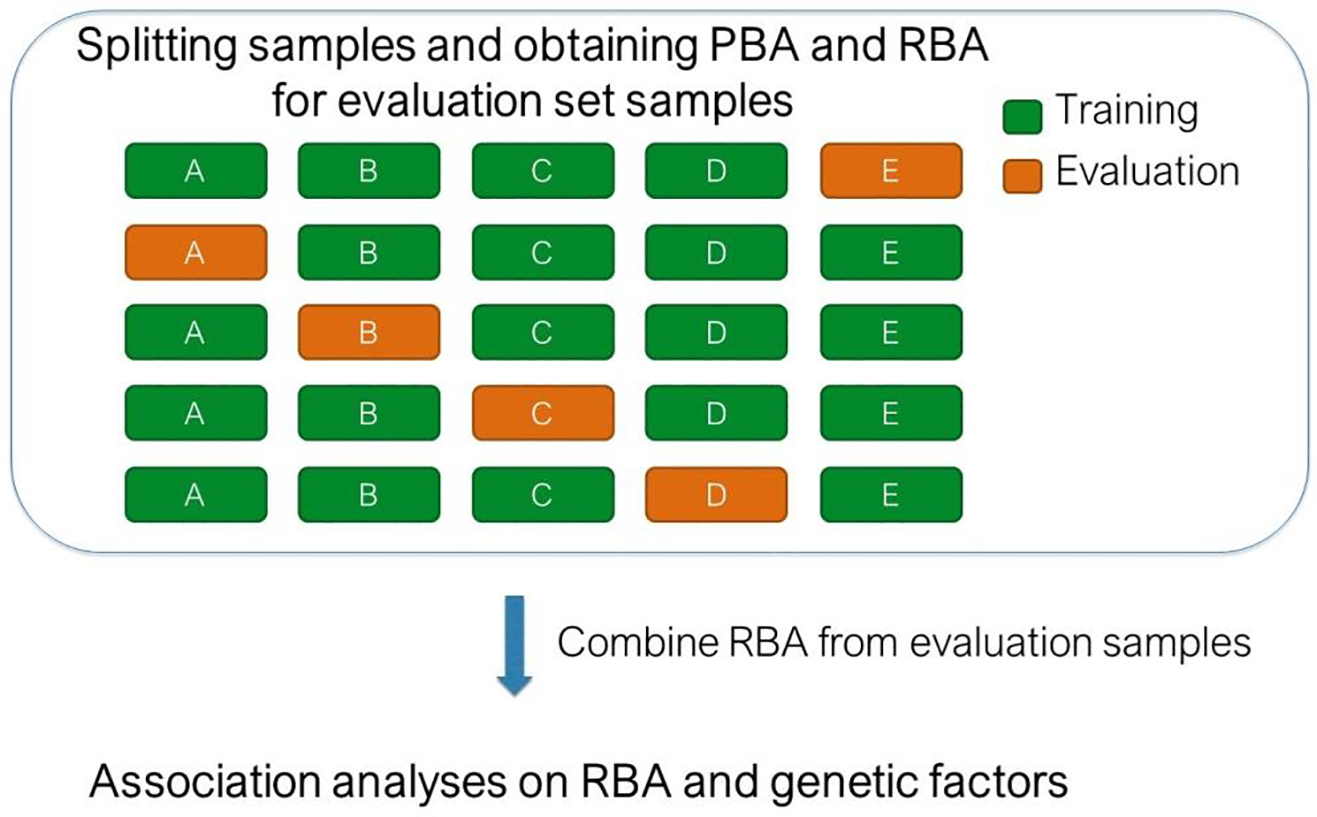
We used a five-fold cross-validation strategy for training a CNN model for predicting brain age and for conducting SNP-RBA association analyses. Specifically, we randomly split the subjects into five batches, each including 20% of the data, and each with the same age and gender distributions. We used 80% of the data (i.e., four batches) for training a CNN model for predicting brain age (PBA), within which 5% of the samples were used as an internal validation set for monitoring the model’s performance. We then applied the trained models to the remaining 20% of samples, which served as evaluation set, and obtained PBA of these samples. We crossed over the split samples and obtained PBA for each batch of subjects.
2.2.2. Details of the CNN model
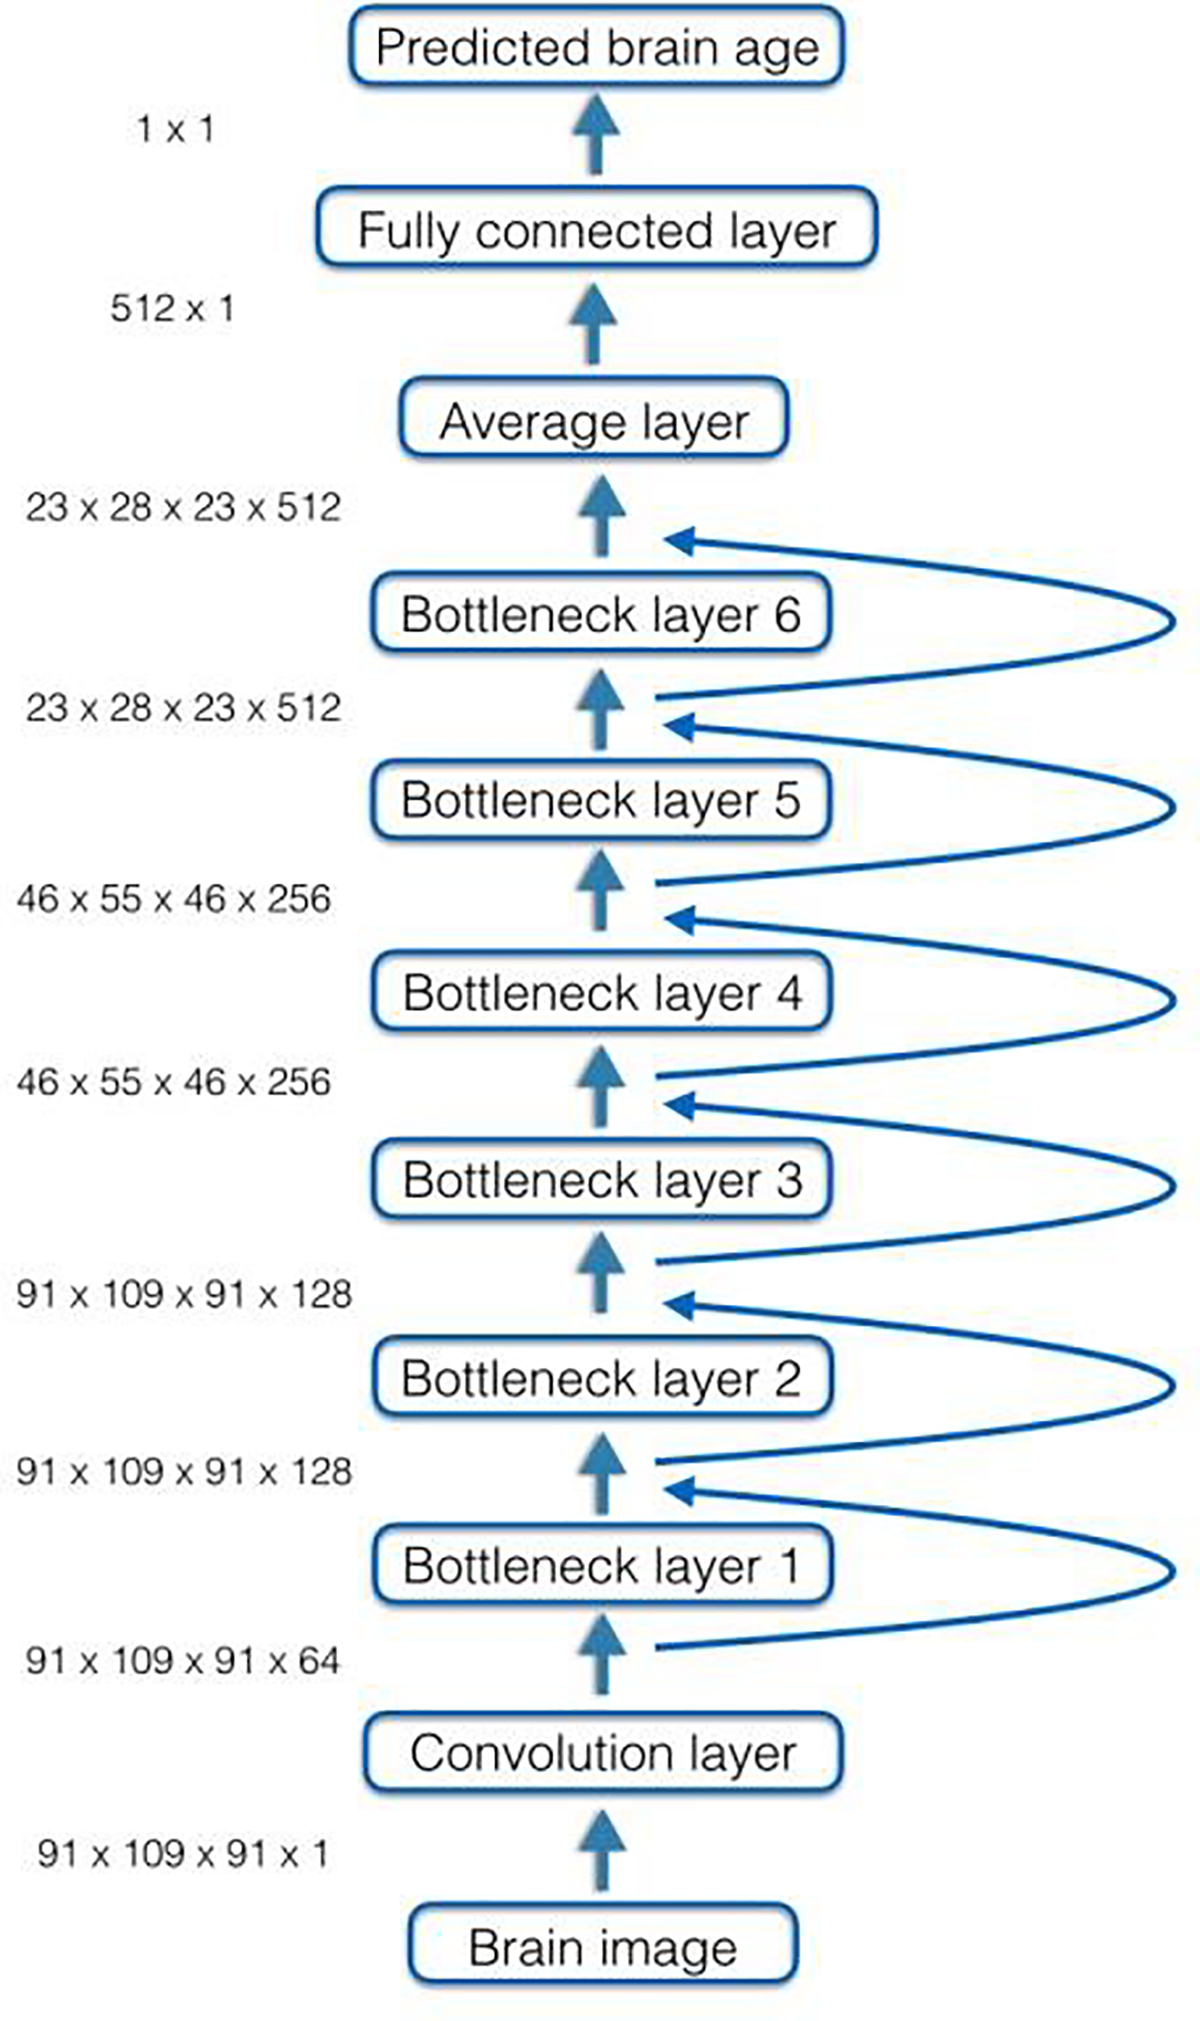
We used a ResNet CNN (He et al., 2015) implemented in NiftyNet for predicting brain age based on 3D MRI data (https://niftynet.io). We chose the ResNet structure because empirical evidence has shown that it is easy to optimize and performs well in imaging data analyses (He et al., 2015). We down-sampled the MRI data from a resolution of 182×218×182 to 91×109×91 before training the CNN, due to the GPU memory limitations. The ResNet model provided by NiftyNet comprised of a convolution layer, six bottleneck layers, a fully connected layer, and an output layer. Multiple short-cut connections were included between the bottleneck layers. The initial convolution layer contained 64 filters. There were six bottleneck layers: bottleneck layer 1 and bottleneck layer 2 had 128 filters; bottleneck layer 3 and bottleneck layer 4 had 256 filters; bottleneck layer 5 and bottleneck layer 6 had 512 filters. Random rotations between −5 and 5 degrees were included as a data augmentation strategy to prevent overfitting. The model was trained with learning rate at 0.0001 on two GPUs. The CNN architecture is illustrated in Fig. 1.
Fig. 1.
Architecture of the convolutional neural network model for predicting brain age based on MRI data. Curved arrows indicate skip connections between layers.
2.2.3. Obtaining relative brain age
The metric representing the difference between PBA and CA (PBA-CA) was negatively associated with chronological age when using CNN model (Supplementary Fig. 1). Therefore, we further derived RBA after obtaining PBA (as described by Ning et al. (Ning et al., 2020b)). We then combined RBA of all evaluation set subjects and assessed association between RBA and SNPs. Fig. 2 illustrates the procedure for obtaining PBA and RBA through a 5-fold cross-validation strategy and then carrying out RBA-SNP association analyses.
Fig. 2.
Procedure for obtaining PBA and RBA through a 5-fold cross-validation strategy and then carrying out RBA-SNP association analyses.
2.3. Obtaining predicted brain age and relative brain age based on a linear regression model
We trained linear regression models with LASSO regularization to obtain PBA using the same training and evaluation sets as used for the CNN models. In the linear regression models, the predictors were 403 brain morphometric measurements from Freesurfer (Fischl, 2012) (e.g., volume of cortical, subcortical, white matter, and ventricle regions, thickness and surface area of cortical regions, intracranial volume, etc.), and the response variable was CA. After obtaining PBA, we further derived RBA metric. Details of obtaining PBA and RBA using the regression model are described in a previous paper (Ning et al., 2020b).
2.4. SNP-RBA association analyses
We used a linear mixed model implemented in BOLT-LMM (Loh et al., 2015) to test the association between SNPs and RBA, adjusting for gender, the first three genetic principal components, and batch information during sampling. We further used FUMA (Watanabe et al., 2017) to obtain gene-level association with RBA.
3. Results
3.1. Predicted brain age from a CNN model
In the five evaluation sets, the median MAE between CNN-derived PBA and chronological age was 2.7 years (ranging from 2.5 years to 3.1 years). We observed that the difference between PBA and chronological age (i.e., PBA-CA) was negatively associated with chronological age. The pattern of the relationship between PBA and CA was not aligned along the 45-degree diagonal line. To be specific, a majority of subjects under 50 years of age tended to have positive PBACA, while a majority of subjects over 70 years of age tended to have negative PBA-CA (Supplementary Fig. 1). Therefore, after obtaining PBA, we adjusted for this association by calculating the RBA metric, which is independent of age, and assessed the association between RBA and genetic variants.
3.2. Genetic factors associated with brain aging
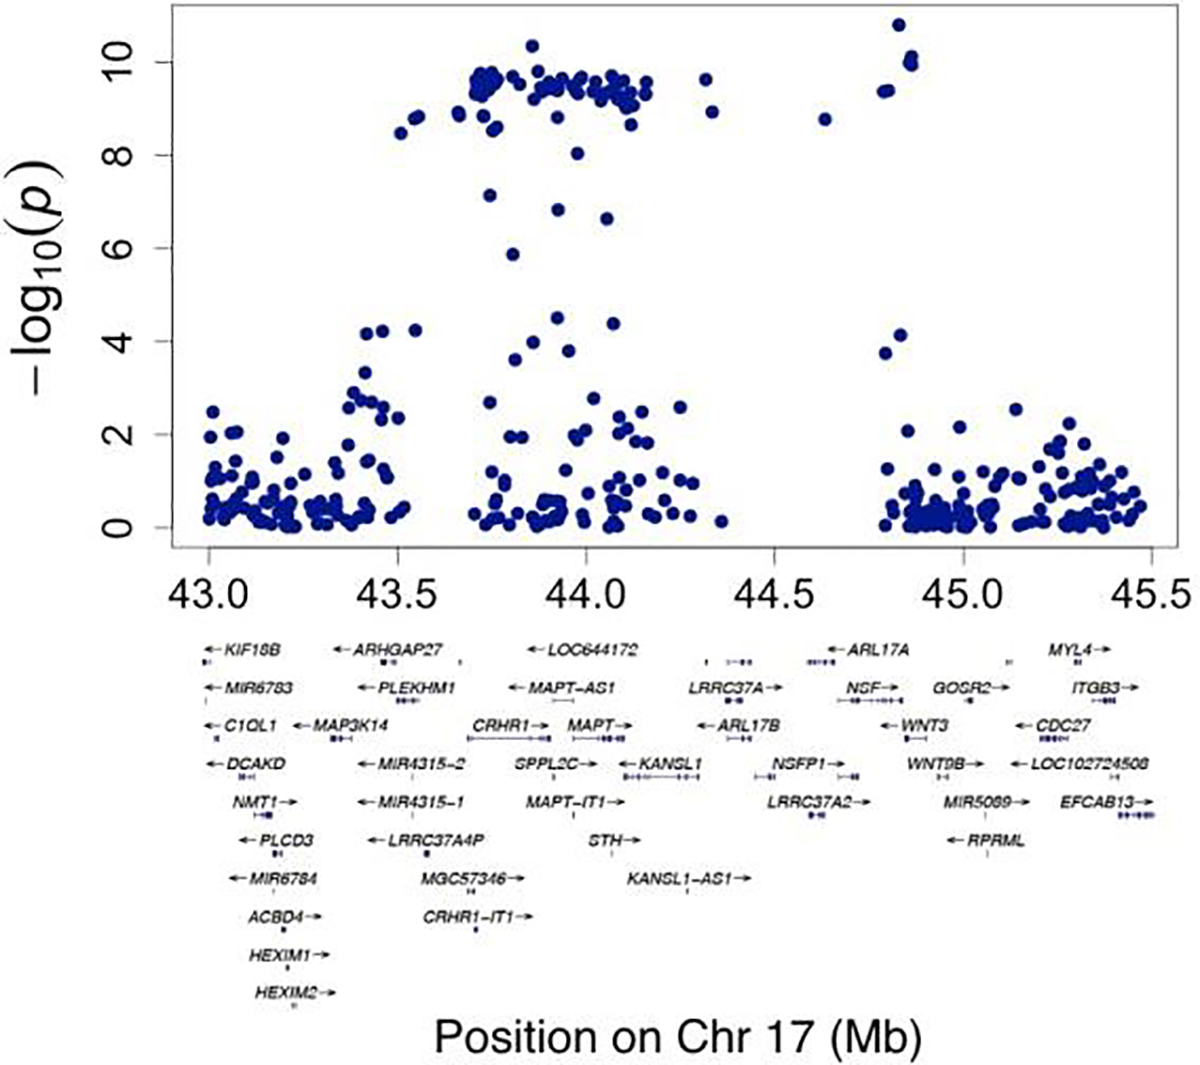
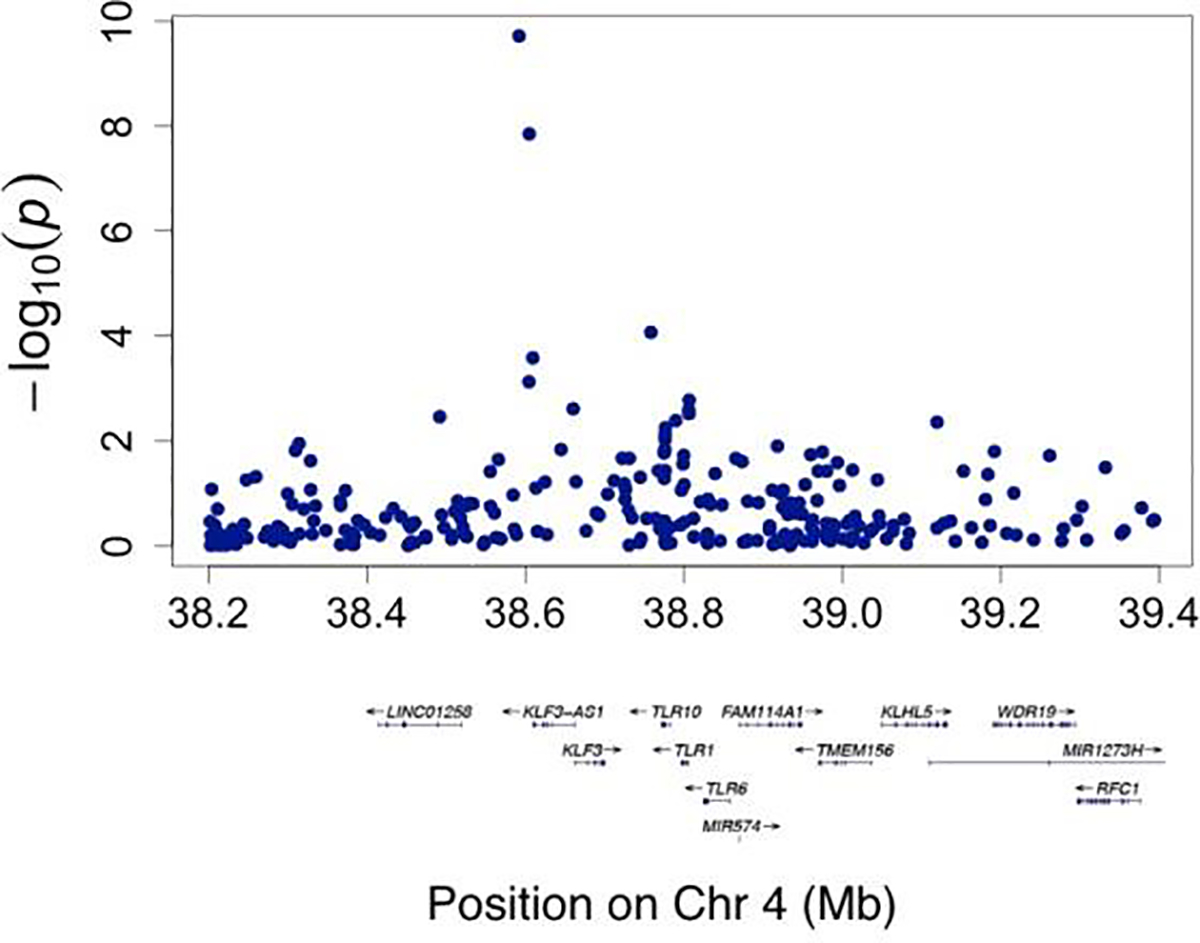
In total, 80 SNPs from four independent loci show significant associations with RBA derived from CNN (association p-value < 5E-8). Fig. 3 shows a Manhattan plot of the associations between SNPs and RBA across the genome. Supplementary Table 1 lists the SNP-level association p-values (DOI:10.5281/zenodo.3786826). Three SNPs from a locus on chromosome 4 showed significant association with RBA, with the leading SNP rs337638 having an association p-value of 3E-16. These SNPs are in a non-coding region with the nearest protein coding gene being KLF3 (Fig. 4). Multiple SNPs significantly associated with RBA are located in a chromosome 17 locus that has been previously linked to brain aging (Jonsson et al., 2019; Ning et al., 2020b). This locus includes genes such as NSF, MAPT, and WNT3 (Fig. 5). In addition, SNP rs2677110 located within the gene RUNX2 on chromosome 6 and SNP rs12775208 located within the gene NKX6–2 on chromosome 10 also showed significant association with RBA (Supplementary Figures 3 and 4). Supplementary Table 2 lists the association p-values between genes and RBA (DOI:10.5281/zenodo.3786854).
Fig. 3.
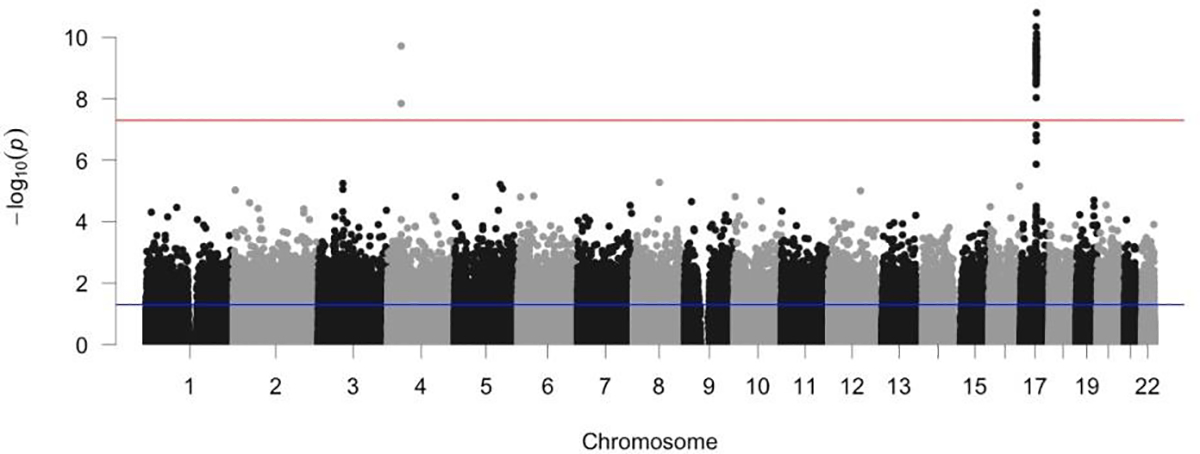
Manhattan plot of the association p-values between SNPs and relative brain age across the genome. The red dashed line indicates the genome-wide significance threshold on p-value (i.e., 5E-8).
Fig. 4.
Regional visualization of a locus on Chromosome 4 where SNPs showing genome-wide significant associations with relative brain age are located.
Fig. 5.
Regional visualization of a locus on Chromosome 17 where SNPs showing genome-wide significant associations with relative brain age are located.
3.3. Comparing CNN and linear regression models
The CNN model had a significantly smaller MAE between PBA and chronological age than the linear regression model, in which the median MAE was 3.7 years in the five evaluation sets (paired t-test p-value < 0.05). The associations between CNN-derived PBA and cognitive functions, including response time and visual memory score, were stronger than the associations between regression-derived PBA and cognitive functions. ANOVA analyses showed that the association p-values for CNN-derived PBA and mean response time and CNN-derived PBA and visual memory score were 2.4E-244 and 9.8E-57, respectively. In comparison, the association p-values for regression-derived PBA and mean response time and regression-derived PBA and visual memory score were 21.6E-222 and 1.2E-53, respectively. The SNP-RBA association p-values were stronger when using RBA derived from the CNN model than when using RBA from the linear regression model (Fig. 6). In the latter case, only the SNPs from a chromosome 17 locus were significantly associated with RBA (Supplementary Fig. 2).
Fig. 6.
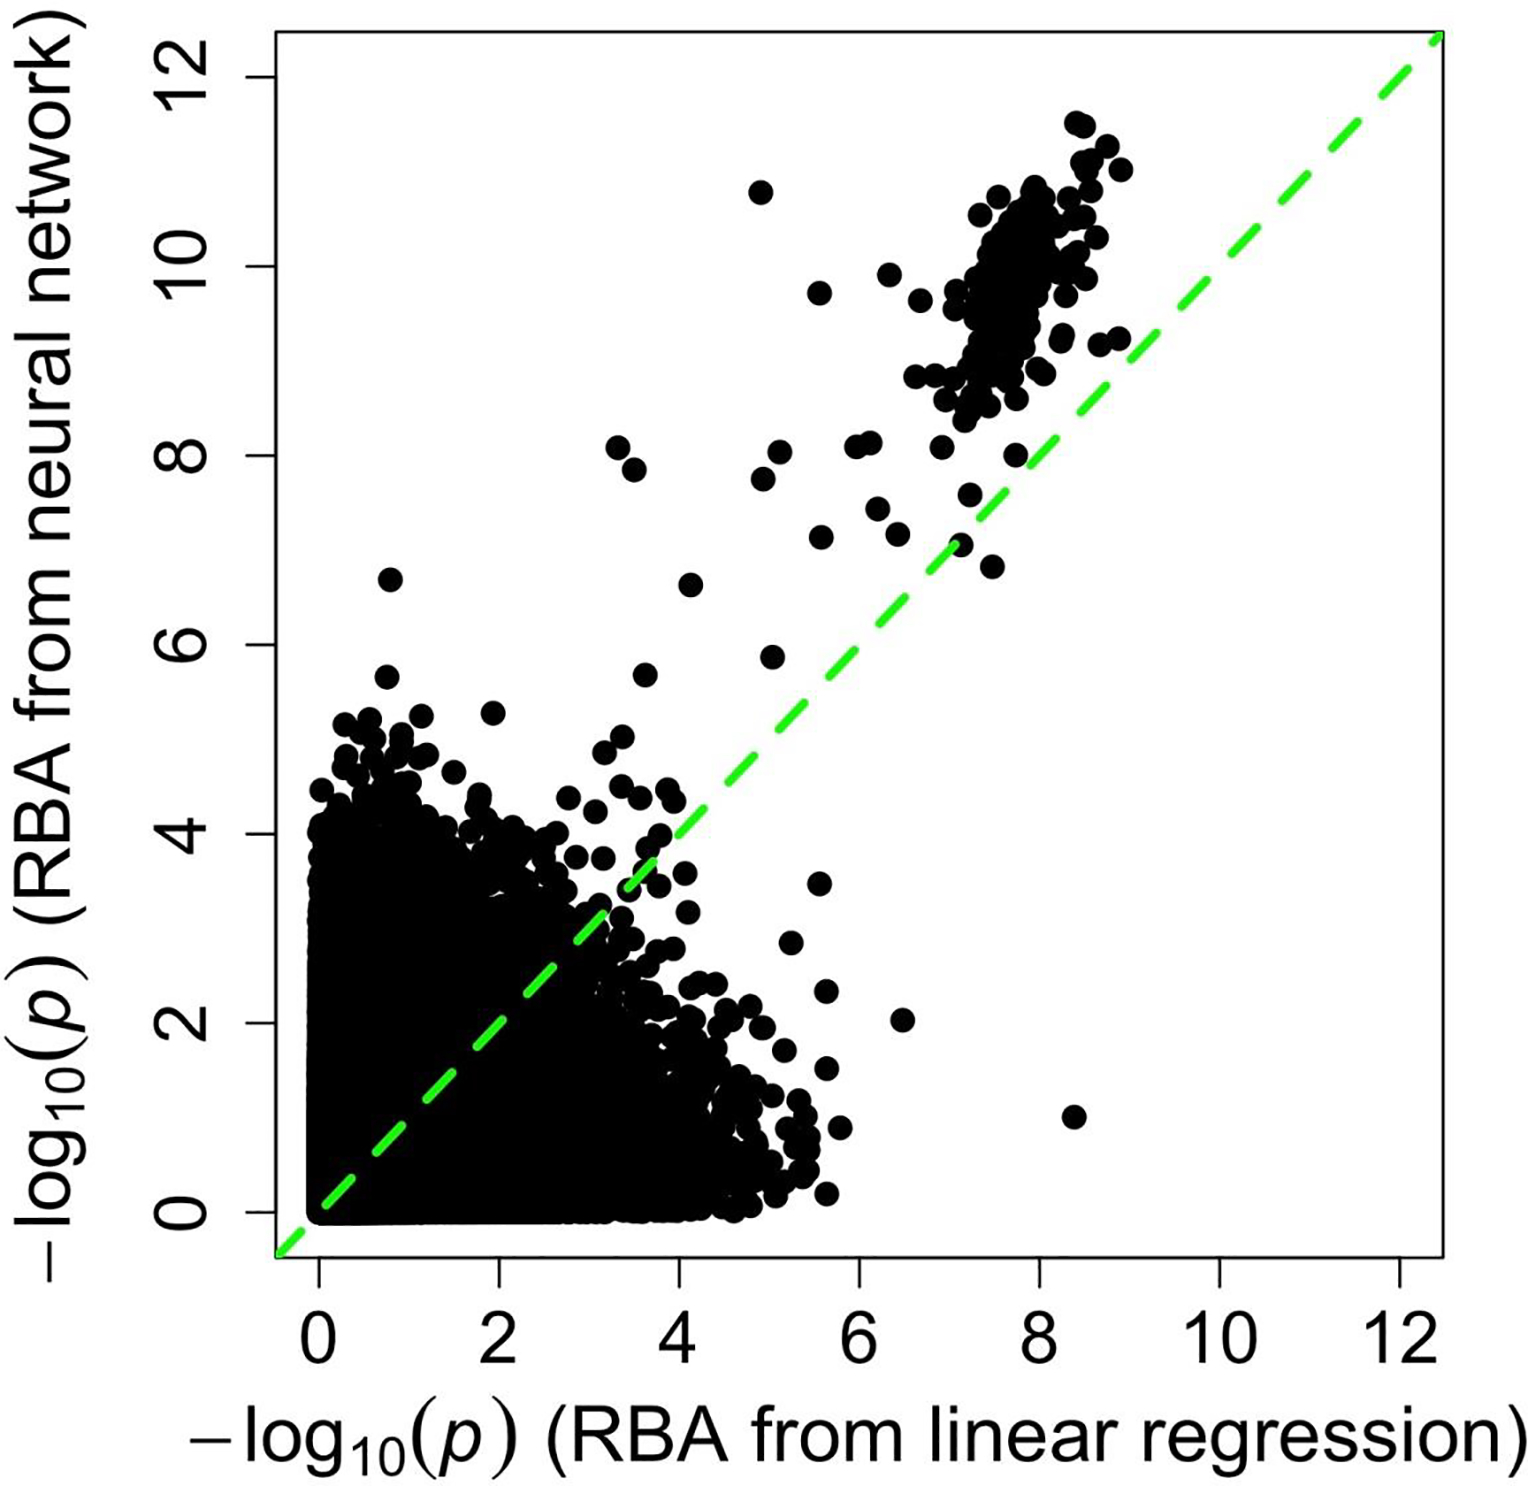
Comparison of SNP-RBA association signals identified using RBA from a linear regression model and using RBA from a convolutional neural network model.
4. Discussion
In this study, we trained a CNN for obtaining PBA and further studied associations between SNPs and brain aging. The CNN model was more accurate than a linear regression model in characterizing brain aging. The median MAE of CNN-derived PBA was lower than that of a linear-regression-derived PBA (i.e., 2.7 years versus 3.7 years). Further, CNN-derived PBA showed stronger associations with cognitive functions than did linear regression model-derived PBA.
The metric representing the difference between PBA and CA (PBA-CA) was negatively associated with chronological age when using the CNN model (Supplementary Fig. 1). This negative association was similar to the pattern found between PBA-CA and chronological age when PBA was developed using a linear regression model (Ning et al., 2020b; Smith et al., 2019). This negative association is likely a result of regression dilution and has been discussed previously by Smith et al (Smith et al., 2019). Deriving PBA using a CNN does not eliminate this issue, because the last layer of the CNN model was fundamentally a linear regression model. Therefore, to adjust for the undesirable association between (PBA-CA) and chronological age, we further derived RBA after obtaining PBA and assessed the association between RBA and SNPs.
We found SNPs from four loci to be significantly associated with RBA. The SNP most significantly associated with RBA (rs337638, p-value = 3E-16) was in a non-coding region on chromosome 4. The protein coding gene located closest to this SNP is KLF3. KLF3 mediates lifespan in C. elegans (Hsieh et al., 2017) and may be associated with educational attainment in human subjects (Lee et al., 2018). SNPs in a chromosome 17 locus also showed significant associations with RBA. In this locus, genes including MAPT, NSF, and WNT3 have significant gene-level associations with RBA and are of particular interest (Supplementary Table 2). Previous studies have shown that mutations in MAPT, which encodes tau protein, are associated with dementia and Parkinson’s disease (Goedert, 2015). The NSF gene encodes ATPase, which is involved in cellular membrane fusion events, and is associated with neuronal intranuclear inclusion disease and schizophrenia (Pountney et al., 2008). The WNT3 gene is associated with general cognitive function (Trampush et al., 2017). These genes are located in a region of low recombination rate, where SNP genotypes are highly associated (Goedert, 2015). Therefore, it is unclear which gene(s) in this locus are truly associated with brain aging. In addition, the SNP rs2677110 located in the RUNX2 gene on chromosome 6 and the SNP rs12775208 located in the NKX6–2 gene on chromosome 10 also showed significant association with RBA. RUNX2 gene encodes a transcription factor that regulates the expression of osteocalcin (Sierra et al., 2003). Interestingly, low osteocalcin levels are associated with age-related decline in cognitive function, which may contribute to the association between this RUNX2 variant and RBA (Obri et al., 2018; Puig et al., 2016). NKX6–2 encodes a transcription factor that regulates myelin sheath formation and maintenance in the central nervous system (Cai et al., 2010; Southwood et al., 2004). While there are plausible links between these variants and overall brain health, the biological functions of these RBA-associated SNPs require further investigation in order to clarify how they affect brain aging.
The SNP-RBA association signals were stronger (i.e., with more significant p-value) when using RBA derived from the CNN model than when using RBA derived from the linear regression model (Fig. 3, Fig. 6, and Supplementary Fig. 2). We noticed that the additional cost of time to train a CNN model was not trivial, and training the CNN took about two days to converge (with two NVIDIA GPUs). As a comparison, training a linear regression model with FreeSurfer measurements as predictors for brain age took just two minutes on one CPU. Nevertheless, the time required for training a CNN model can be reduced by using additional GPU cores (e.g., our model training was done in two days using two GPUs. The training time can be reduced to a couple of hours when using twenty GPUs). Also, as tensor processing units (TPUs) become widely accessible, the computation time can be further reduced. Computation time of a CNN model can also be reduced by using a more computationally efficient architecture. For example, Peng et al. successfully used a lightweight deep learning model to achieve highly accurate PBA (Peng et al., 2021).
Our study has some limitations. First, there are various ways to perform imaging preprocessing and to build neural networks. A thorough investigation of different combinations of imaging pre-processing methods and neural network structures may further increase the accuracy of brain age prediction. Second, we used baseline scans to predict brain age, which are best suited for our research purpose. We may also investigate potential applications of UK Biobank follow-up scans, including using them to confirm the accuracy of PBA derived based on baseline scans, and to characterize brain aging over an extended period.
Besides genetic factors, lifestyle habits and diseases are also associated with brain aging. For example, heavy smoking and alcohol consumption are associated with accelerated brain aging, both in specific brain regions and overall (Ning et al., 2020b). Physical exercise improves general health and may also slow brain aging and reduce Alzheimer’s disease risk (Kramer et al., 2006; Larson et al., 2006). Diseases such as diabetes and schizophrenia are associated with accelerated brain aging (Franke et al., 2013; Schnack et al., 2016). As large-scale data becomes accessible, including both brain imaging data and information about lifestyle factors, RBA based on CNN models can be used to better characterize the links between these factors and brain aging.
In summary, the CNN model more accurately characterized brain aging than a regression model, which led to the identification of novel associations between SNPs and brain aging. We suggest that a more accurate PBA is likely to enable better characterization of the association between brain aging and other lifestyle or disease factors.
Supplementary Material
Highlights.
We analyzed brain imaging and genetic data from more than 15,000 UK Biobank subjects.
We trained a convolutional neural network model to accurately predict brain age.
We identified novel genetic factors significantly associated with brain aging.
Acknowledgements
This work was supported by grants P41EB015922 and U54EB020406 of the National Institutes of Health. We thank Dr. Bo Chen for helpful discussions on data analyses procedure. We also acknowledge the contributions of members of the UK Biobank coordinating center.
Footnotes
Publisher's Disclaimer: This is a PDF file of an unedited manuscript that has been accepted for publication. As a service to our customers we are providing this early version of the manuscript. The manuscript will undergo copyediting, typesetting, and review of the resulting proof before it is published in its final form. Please note that during the production process errors may be discovered which could affect the content, and all legal disclaimers that apply to the journal pertain.
References
- Cai J, Zhu Q, Zheng K, Li H, Qi Y, Cao Q, Qiu M, 2010. Co-localization of Nkx6.2 and Nkx2.2 homeodomain proteins in differentiated myelinating oligodendrocytes. Glia 58(4), 458–468. [DOI] [PMC free article] [PubMed] [Google Scholar]
- Cole JH, Franke K, 2017. Predicting Age Using Neuroimaging: Innovative Brain Ageing Biomarkers. Trends Neurosci 40(12), 681–690. [DOI] [PubMed] [Google Scholar]
- Cole JH, Poudel RPK, Tsagkrasoulis D, Caan MWA, Steves C, Spector TD, Montana G, 2017. Predicting brain age with deep learning from raw imaging data results in a reliable and heritable biomarker. Neuroimage 163, 115–124. [DOI] [PubMed] [Google Scholar]
- Creasey H, Rapoport SI, 1985. The aging human brain. Ann Neurol 17(1), 2–10. [DOI] [PubMed] [Google Scholar]
- Esteva A, Kuprel B, Novoa RA, Ko J, Swetter SM, Blau HM, Thrun S, 2017. Dermatologist-level classification of skin cancer with deep neural networks. Nature 542(7639), 115–118. [DOI] [PMC free article] [PubMed] [Google Scholar]
- Fischl B, 2012. FreeSurfer. Neuroimage 62(2), 774–781. [DOI] [PMC free article] [PubMed] [Google Scholar]
- Franke K, Gaser C, Manor B, Novak V, 2013. Advanced BrainAGE in older adults with type 2 diabetes mellitus. Front Aging Neurosci 5, 90. [DOI] [PMC free article] [PubMed] [Google Scholar]
- Franke K, Ziegler G, Kloppel S, Gaser C, Alzheimer’s Disease Neuroimaging I, 2010. Estimating the age of healthy subjects from T1-weighted MRI scans using kernel methods: exploring the influence of various parameters. Neuroimage 50(3), 883–892. [DOI] [PubMed] [Google Scholar]
- Goedert M, 2015. NEURODEGENERATION. Alzheimer’s and Parkinson’s diseases: The prion concept in relation to assembled Abeta, tau, and alpha-synuclein. Science 349(6248), 1255555. [DOI] [PubMed] [Google Scholar]
- He K, Zhang X, Ren S, Sun J, 2015. Deep Residual Learning for Image Recognition. arXiv:1512.03385. [Google Scholar]
- Hsieh PN, Zhou G, Yuan Y, Zhang R, Prosdocimo DA, Sangwung P, Borton AH, Boriushkin E, Hamik A, Fujioka H, Fealy CE, Kirwan JP, Peters M, Lu Y, Liao X, Ramirez-Bergeron D, Feng Z, Jain MK, 2017. A conserved KLF-autophagy pathway modulates nematode lifespan and mammalian age-associated vascular dysfunction. Nat Commun 8(1), 914. [DOI] [PMC free article] [PubMed] [Google Scholar]
- Jonsson BA, Bjornsdottir G, Thorgeirsson TE, Ellingsen LM, Walters GB, Gudbjartsson DF, Stefansson H, Stefansson K, Ulfarsson MO, 2019. Brain age prediction using deep learning uncovers associated sequence variants. Nat Commun 10(1), 5409. [DOI] [PMC free article] [PubMed] [Google Scholar]
- Kramer AF, Erickson KI, Colcombe SJ, 2006. Exercise, cognition, and the aging brain. J Appl Physiol (1985) 101(4), 1237–1242. [DOI] [PubMed] [Google Scholar]
- Langner T, Wikstrom J, Bjerner T, Ahlstrom H, Kullberg J, 2019. Identifying morphological indicators of aging with neural networks on large-scale whole-body MRI. IEEE Trans Med Imaging. [DOI] [PubMed] [Google Scholar]
- Larson EB, Wang L, Bowen JD, McCormick WC, Teri L, Crane P, Kukull W, 2006. Exercise is associated with reduced risk for incident dementia among persons 65 years of age and older. Ann Intern Med 144(2), 73–81. [DOI] [PubMed] [Google Scholar]
- Lee JJ, Wedow R, Okbay A, Kong E, Maghzian O, Zacher M, Nguyen-Viet TA, Bowers P, Sidorenko J, Karlsson Linner R, Fontana MA, Kundu T, Lee C, Li H, Li R, Royer R, Timshel PN, Walters RK, Willoughby EA, Yengo L, andMe Research T, Cogent, Social Science Genetic Association C, Alver M, Bao Y, Clark DW, Day FR, Furlotte NA, Joshi PK, Kemper KE, Kleinman A, Langenberg C, Magi R, Trampush JW, Verma SS, Wu Y, Lam M, Zhao JH, Zheng Z, Boardman JD, Campbell H, Freese J, Harris KM, Hayward C, Herd P, Kumari M, Lencz T, Luan J, Malhotra AK, Metspalu A, Milani L, Ong KK, Perry JRB, Porteous DJ, Ritchie MD, Smart MC, Smith BH, Tung JY, Wareham NJ, Wilson JF, Beauchamp JP, Conley DC, Esko T, Lehrer SF, Magnusson PKE, Oskarsson S, Pers TH, Robinson MR, Thom K, Watson C, Chabris CF, Meyer MN, Laibson DI, Yang J, Johannesson M, Koellinger PD, Turley P, Visscher PM, Benjamin DJ, Cesarini D, 2018. Gene discovery and polygenic prediction from a genome-wide association study of educational attainment in 1.1 million individuals. Nat Genet 50(8), 1112–1121. [DOI] [PMC free article] [PubMed] [Google Scholar]
- Lin W, Tong T, Gao Q, Guo D, Du X, Yang Y, Guo G, Xiao M, Du M, Qu X, Alzheimer’s Disease Neuroimaging I, 2018. Convolutional Neural Networks-Based MRI Image Analysis for the Alzheimer’s Disease Prediction From Mild Cognitive Impairment. Front Neurosci 12, 777. [DOI] [PMC free article] [PubMed] [Google Scholar]
- Loh PR, Tucker G, Bulik-Sullivan BK, Vilhjalmsson BJ, Finucane HK, Salem RM, Chasman DI, Ridker PM, Neale BM, Berger B, Patterson N, Price AL, 2015. Efficient Bayesian mixed-model analysis increases association power in large cohorts. Nat Genet 47(3), 284–290. [DOI] [PMC free article] [PubMed] [Google Scholar]
- Luo L, Craik FI, 2008. Aging and memory: a cognitive approach. Can J Psychiatry 53(6), 346–353. [DOI] [PubMed] [Google Scholar]
- Ning K, Zhao L, Franklin M, Matloff W, Batta I, Arzouni N, Sun F, Toga AW, 2020a. Parity is associated with cognitive function and brain age in both females and males. Sci Rep 10(1), 6100. [DOI] [PMC free article] [PubMed] [Google Scholar]
- Ning K, Zhao L, Matloff W, Sun F, Toga AW, 2020b. Association of relative brain age with tobacco smoking, alcohol consumption, and genetic variants. Sci Rep 10(1), 10. [DOI] [PMC free article] [PubMed] [Google Scholar]
- Obri A, Khrimian L, Karsenty G, Oury F, 2018. Osteocalcin in the brain: from embryonic development to age-related decline in cognition. Nat Rev Endocrinol 14(3), 174–182. [DOI] [PMC free article] [PubMed] [Google Scholar]
- Peng H, Gong W, Beckmann CF, Vedaldi A, Smith SM, 2021. Accurate brain age prediction with lightweight deep neural networks. Med Image Anal 68, 101871. [DOI] [PMC free article] [PubMed] [Google Scholar]
- Pountney DL, Raftery MJ, Chegini F, Blumbergs PC, Gai WP, 2008. NSF, Unc-18–1, dynamin-1 and HSP90 are inclusion body components in neuronal intranuclear inclusion disease identified by anti-SUMO-1-immunocapture. Acta Neuropathol 116(6), 603–614. [DOI] [PubMed] [Google Scholar]
- Puig J, Blasco G, Daunis-i-Estadella J, Moreno M, Molina X, Alberich-Bayarri A, Xifra G, Pedraza S, Ricart W, Fernandez-Aranda F, Fernandez-Real JM, 2016. Lower serum osteocalcin concentrations are associated with brain microstructural changes and worse cognitive performance. Clin Endocrinol (Oxf) 84(5), 756–763. [DOI] [PubMed] [Google Scholar]
- Schnack HG, van Haren NE, Nieuwenhuis M, Hulshoff Pol HE, Cahn W, Kahn RS, 2016. Accelerated Brain Aging in Schizophrenia: A Longitudinal Pattern Recognition Study. Am J Psychiatry 173(6), 607–616. [DOI] [PubMed] [Google Scholar]
- Sierra J, Villagra A, Paredes R, Cruzat F, Gutierrez S, Javed A, Arriagada G, Olate J, Imschenetzky M, Van Wijnen AJ, Lian JB, Stein GS, Stein JL, Montecino M, 2003. Regulation of the bone-specific osteocalcin gene by p300 requires Runx2/Cbfa1 and the vitamin D3 receptor but not p300 intrinsic histone acetyltransferase activity. Mol Cell Biol 23(9), 3339–3351. [DOI] [PMC free article] [PubMed] [Google Scholar]
- Smith SM, Alfaro-Almagro F, Miller KL, 2020. UK Biobank Brain Imaging Documentation. [DOI] [PMC free article] [PubMed] [Google Scholar]
- Smith SM, Vidaurre D, Alfaro-Almagro F, Nichols TE, Miller KL, 2019. Estimation of brain age delta from brain imaging. Neuroimage 200, 528–539. [DOI] [PMC free article] [PubMed] [Google Scholar]
- Southwood C, He C, Garbern J, Kamholz J, Arroyo E, Gow A, 2004. CNS myelin paranodes require Nkx6–2 homeoprotein transcriptional activity for normal structure. J Neurosci 24(50), 11215–11225. [DOI] [PMC free article] [PubMed] [Google Scholar]
- Trampush JW, Yang ML, Yu J, Knowles E, Davies G, Liewald DC, Starr JM, Djurovic S, Melle I, Sundet K, Christoforou A, Reinvang I, DeRosse P, Lundervold AJ, Steen VM, Espeseth T, Raikkonen K, Widen E, Palotie A, Eriksson JG, Giegling I, Konte B, Roussos P, Giakoumaki S, Burdick KE, Payton A, Ollier W, Horan M, Chiba-Falek O, Attix DK, Need AC, Cirulli ET, Voineskos AN, Stefanis NC, Avramopoulos D, Hatzimanolis A, Arking DE, Smyrnis N, Bilder RM, Freimer NA, Cannon TD, London E, Poldrack RA, Sabb FW, Congdon E, Conley ED, Scult MA, Dickinson D, Straub RE, Donohoe G, Morris D, Corvin A, Gill M, Hariri AR, Weinberger DR, Pendleton N, Bitsios P, Rujescu D, Lahti J, Le Hellard S, Keller MC, Andreassen OA, Deary IJ, Glahn DC, Malhotra AK, Lencz T, 2017. GWAS meta-analysis reveals novel loci and genetic correlates for general cognitive function: a report from the COGENT consortium. Mol Psychiatry 22(3), 336–345. [DOI] [PMC free article] [PubMed] [Google Scholar]
- UKBiobank, 2015. Genotyping and quality control of UK Biobank, a large-scale, extensively phenotyped prospective resource. [Google Scholar]
- Watanabe K, Taskesen E, van Bochoven A, Posthuma D, 2017. Functional mapping and annotation of genetic associations with FUMA. Nat Commun 8(1), 1826. [DOI] [PMC free article] [PubMed] [Google Scholar]
Associated Data
This section collects any data citations, data availability statements, or supplementary materials included in this article.