

Abstract
Background and Objectives
To investigate the longitudinal dynamic of lymphocyte subsets during treatment with ocrelizumab (OCR) in patients with multiple sclerosis (PwMS).
Methods
A multicenter retrospective study was conducted in 161 PwMS starting treatment with OCR grouped in naive (naive, n = 40), switching from fingolimod (FTY, n = 52), and switching from other immunomodulating drugs (other, n = 69). Mean lymphocyte subset (total, CD3+, CD4+, CD8+, CD20+, and natural killer) counts were analyzed at baseline, 6 months, and 12 months. Rate of lymphocytopenia for each subset was calculated at all time points in all groups.
Results
Mean total, CD3+, and CD4+ counts were significantly different among groups (p < 0.001) at all time points, whereas CD8+ and CD20+ counts only at baseline (p = 0.0157; p < 0.001), consistently lower in FTY. After adjustment for baseline values, interaction time*group was not statistically significant (p > 0.05 for each subset). The odds of lymphopenia were significantly higher among FTY patients compared with naive for total, CD3+, CD4+, and CD20+ cells at baseline, for total and CD4+ cells at the sixth month, and for total cells at the 12th month.
Discussion
OCR per se exerts a modest depleting effect on T cells that seems rather due to a carryover phenomenon of previous therapies, particularly FTY. These data may help in the overall evaluation of the risk/benefit profile of treatment sequencing.
Ocrelizumab (OCR) is a humanized monoclonal antibody with anti-CD20+ action, approved for clinical use in patients with relapsing remitting multiple sclerosis (RRMS) and primary progressive multiple sclerosis (PPMS).1 OCR exerts its main effect by depleting peripheral CD20+ B cells; nonetheless, in OCR phase III studies, depletion of T cells has been also observed,2 representing a potential additional risk factor for infections. Clinical and demographic factors predicting the development of T lymphocytopenia are under investigation. Notably, according to the approved prescribing indications, patients starting OCR may be naive to treatment or switching from other drugs due to suboptimal response.1 Many drugs used for the treatment of multiple sclerosis (MS) act by modulating, reducing, or sequestering T cells. Nonetheless, depletion of T lymphocytes may also occur as an unwarranted off target side effect of immunomodulating drugs, as previously described for dimethyl fumarate (DMF) and, more rarely, for other immunomodulators. Drug-induced lymphopenia may last for a long time after treatment suspension, such as in the case of fingolimod (FTY) or DMF,3,4 and it may overlap with the effects of the subsequent disease-modifying treatment potentially reducing its safety. Albeit poorly explored, this is a critical issue in the overall estimation of the risk/benefit profile of treatment sequencing. In this study, we aimed to investigate the dynamic of T-cell subsets during treatment with OCR in patients with MS and the role of the previous exposure to oral and injectable disease-modifying treatments (DMTs) as potential modifiers of this dynamic.
Methods
Study Design
We designed a retrospective multicenter observational study collecting data of patients with MS starting treatment with OCR from 2019 to 2020 and followed up in 5 Italian MS centers (Tor Vergata University Hospital, Rome; University of Campania “L.Vanvitelli”, Naples; Fondazione Policlinico Universitario Agostino Gemelli IRCCS, Rome; IRCCS Istituto Neurologico Mediterraneo “Neuromed”, Pozzilli (IS); and University of Genoa, Ospedale Policlinico San Martino IRCCS, Genoa).
Clinical and demographic information was gathered by each participating center by screening medical records and was stored in an electronic database after anonymization.
Eligibility of patients for the final analysis was based on the following criteria:
Patients starting OCR treatment and undergoing at least a second 600 mg infusion (the first two 300 mg infusions were considered as 1);
Patients starting OCR treatment and having a lymphocyte subset count 12 months (±45 days) after the baseline lymphocyte subset count.
Exclusion criteria were also applied:
Patients treated with azathioprine, natalizumab, cladribine, alemtuzumab, other chemotherapeutic agents, and other anti-CD20 drugs immediately before OCR;
Patients with other medical conditions or exposure to other drugs (not including DMTs) associated with lymphocytosis or lymphocytopenia.
Eligible patients were further divided into 3 groups according to treatment received before OCR: naive (no therapy), FTY (patients treated with FTY for a minimum of 3 months before starting OCR), and other (patients treated with DMF, glatiramer acetate [GA], interferon beta [IFN], or teriflunomide [TERI] for a minimum of 3 months before starting OCR).
Standard Protocol Approvals, Registrations, and Patient Consents
The ethics committee of the Tor Vergata University Hospital approved the study protocol for retrospective analysis of medical record–derived MS data (no. of approval 115/2021). Because of the retrospective study design of data obtained for clinical practice, written consent of each participant was not required as determined by the local ethics board.
Demographic, Clinical, and Laboratory Assessments
The following demographic and clinical information was recorded: date of birth, sex, disease duration from MS initial symptom, MS type (relapsing remitting, secondary progressive, and primary progressive),5 number and type of DMTs used before OCR, and date of OCR infusions.
Data about lymphocyte subset count (total lymphocytes, CD3+, CD4+, CD8+, CD20+, and natural killer [NK]) were collected at baseline, 6 months, and 12 months after starting OCR. Lymphocytes counts were assessed at each participating center by flow cytometer assay, as per clinical practice.
Lymphocytopenia was defined as lymphocyte counts lower than the normal (LLN) laboratory range established for each participating center's flow cytometer, considering total CD3+, CD4+, CD8+, CD20+, and NK cell subsets separately.
Data Availability
Anonymized data will be shared with qualified investigators by request.
Statistical Methods
Demographic and clinical characteristics of patients and baseline cell counts are presented as mean (SD), median (min-max), or N (%), as appropriate; differences among groups were studied using the Kruskal-Wallis test or analysis of variance test for continuous variables and the χ2 test or Fisher exact test for categorical variables.
Proportions of patients with lymphocytopenia were presented as N (%), and χ2 test or Fisher exact test was used, at each single time point, to study differences among groups. In addition, we reported, at each time point, the Kruskal-Wallis test for differences for continuous cell counts. Multivariable age-adjusted logistic regression models were used to investigate the impact of the previous treatment and of the duration of the previous treatment as well as of the washout period among those who were previously treated with FTY on the probability of developing lymphocytopenia. In addition, as sensitivity analysis, we studied the impact of previous treatments while adjusting also for sex and type of MS.
Analysis of variance test for repeated measures was used to study the effect of time on cell counts and to study the interaction between time and group, investigating the change from baseline to adjust for initial measurements.
Results
Demographic and Clinical Characteristics
A total of 161 patients with MS (85 women and 76 men, 60% RMS) met the inclusion criteria and were thus enrolled in the study. Mean age was 39 (±11) years. Median follow-up was 363 days (range 316–404 days), and for almost all the patients (88%), blood samples were available at all the 3 time points. OCR was used as first line therapy for 40 patients (25% of total population). Among patients who switched to OCR from other therapies, 52 were previously treated with FTY and 69 with other treatments (DMF, N = 31/69; GA, N = 15/69; IFN, N = 13/69; TERI, N = 10/69). The median washout period from all the previous treatments was slightly over 2 months (Table 1). The median exposure duration was 3.8 (0.7–8.2) years for FTY and 2.09 (0.41–13) years for others (Table 1), and it was not significantly different comparing FTY with other treatments.
Table 1.
Baseline Demographic and Clinical Characteristics of the Patients

The 3 groups did not differ for age (p = 0.191); the frequency of patients with RRMS was significantly lower in the naive group (p = 0.016), the percentage of females was higher in the FTY group (p = 0.039), and disease duration greatly differed among groups (p < 0.001) (Table 1).
Lymphocyte Values at Baseline and Over 12 Months Overall and Among Groups
At baseline, total lymphocytes were on average 1864.37 (±872.95) cells/mm3, but we observed a significant decrease during the first 6 months, which was maintained at 12 months (0–6 months: p < 0.0001; 0–12 months: p = 0.0020, Figure 1A). Such decrease in total lymphocytes was predominantly accounted for by depletion of CD20+ cells, which dropped from more than 190 cells/mm3 at baseline to less than 20 cells/mm3 at the both 6th and 12th months (p < 0.0001). Indeed, CD3+ cells were found significantly decreased at the sixth month, but returned to baseline values at the 12th month (0–6 months: p = 0.0179; 0–12 months: p = 0.9085; 6–12 months: p = 0.0536, Figure 1B), whereas CD4+ and CD8+ cells were unchanged at the sixth and the twelfth months compared with baseline (p > 0.05) (Figure 1, C and D). Unexpectedly, NK cell count significantly decreased from baseline to the 12th month (p = 0.0083).
Figure 1. Mean Baseline Lymphocyte Count in the Whole Cohort.

Mean count of total (A), CD3+ (B), CD4+ (C), CD8+ (D), lymphocyte subsets in the whole cohort at baseline (0), 6 months, and 12 months after OCR beginning. OCR = ocrelizumab.
Comparing the 3 groups, instead, total, CD3+, and CD4+ lymphocyte cell counts were significantly different among groups (p < 0.001) at all the time points (baseline, 6 months, and 12 months); in particular they were consistently lower in the FTY group (Table 2 and Figure 2, A–C).
Table 2.
Mean Lymphocyte Count for Each Group and Time Point
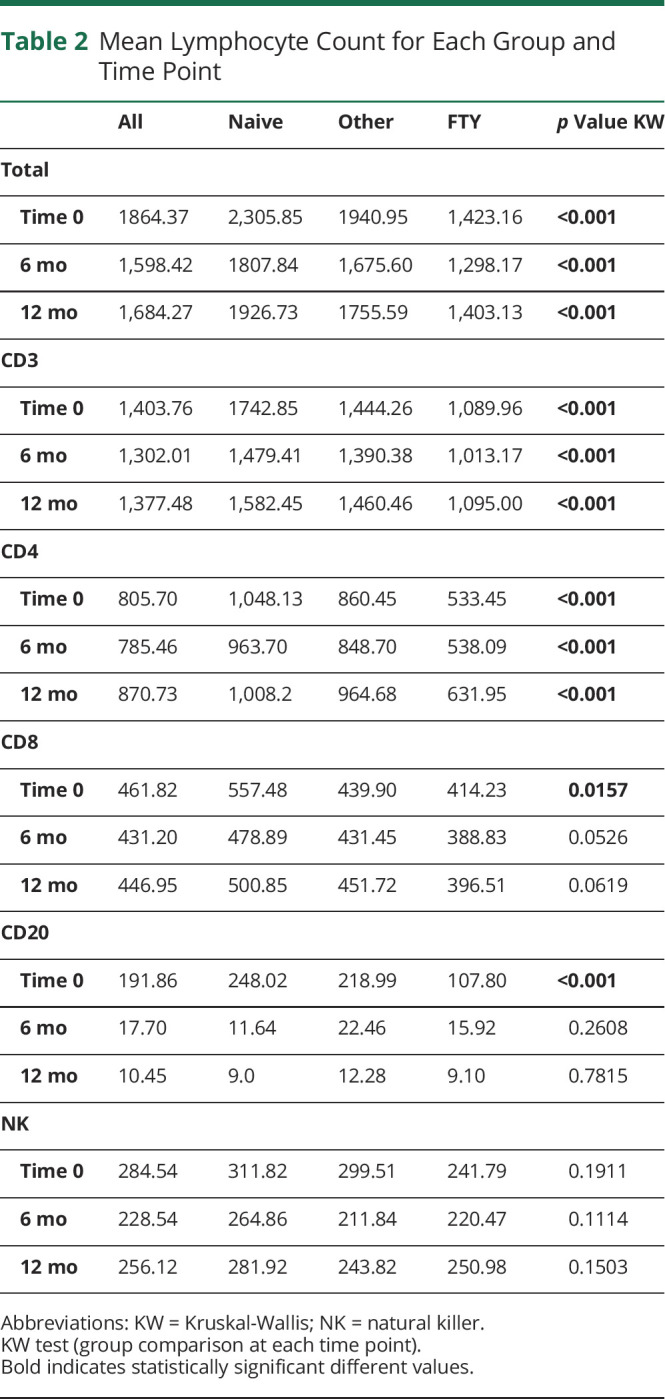
Figure 2. Mean Lymphocyte Subset Count During Follow-up in the 3 Groups.

Mean count of total (A), CD3+ (B), CD4+ (C), CD8+ (D), lymphocyte subset divided by group (blue naive, red FTY, and green other) at the each time point; after adjustment for baseline values, p for time*group interaction is not significant for all the subsets. The number of patients for which the lymphocyte count was available at each time point is indicated below each panel. OCR = ocrelizumab.
Conversely, CD8+ and CD20+ cell counts were significantly different among groups only at baseline (p = 0.0157; p < 0.001), with means and medians following this decreasing order: naive, other, and FTY (Table 2 and Figure 2D, Figure 3B). NK cell counts did not show any statistically significant difference among groups at all the time points (Table 2).
Figure 3. Mean CD20+ Count at Baseline and During Follow-up in the 3 Groups.

Mean count of CD20+ (A) lymphocyte subset in the whole cohort at baseline (0), 6 months, and 12 months after OCR beginning and divided by group (blue naive, red FTY, and green other) at each time point (B). The number of patients for which the lymphocyte count was available at each time point is indicated below panel B. OCR = ocrelizumab.
In the other group, separating patients previously treated with DMF (N = 31/69) from those treated with other immunomodulators, the difference in the mean baseline total lymphocyte count remained significant among groups (p < 0.001); namely, DMF-treated patients showed lower values compared with naive and other immunomodulators and higher compared with FTY (baseline total mean: FTY = 1,423.16, DMF = 1,670.46, other immunomodulators = 2,161.61, and naive = 2,305.85). Similar results were found also for CD3+, CD4+, and CD8+ subsets at all the time points.
After adjustment for baseline values, we did not find any statistically significant interaction between time and previous treatment group (Figure 2). Consistently with the principal analysis, also when we considered DMF-treated patients as an independent group, we did not find any statistically significant interaction between time and previous treatment group (p = 0.2801).
Lymphocytopenia Proportion at Baseline and Over 12 Months Overall and Among Groups
Percentages of patients with lymphocytopenia are shown in Table 3, overall and by groups.
Table 3.
Rate of Lymphopenia, Absolute Numbers, and Percentages; p values for χ2 Test (or Fisher Exact) (Group Comparison at Single Time Point)
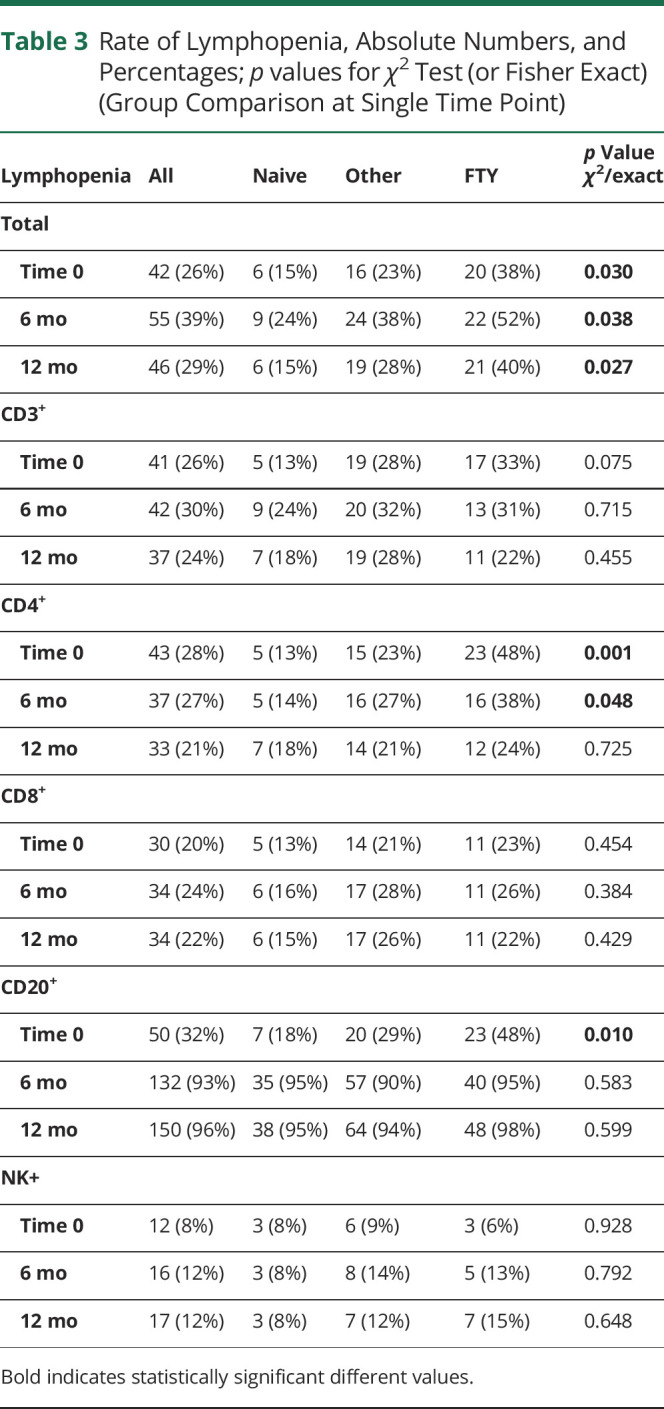
Lymphocytopenia was found in 39% of the population, 46% of cases occurred at the sixth month, 26% at the 12th month. In line with the expected OCR mechanism of action, in the whole population the most noticeable change in the rate of lymphocytopenia was observed for CD20+. Particularly, the rate of lymphocytopenia increased from 32% at baseline to 96% at 12 months; conversely, it remained almost constant for the other lymphocytes subsets.
Among groups, instead, the rate of lymphocytopenia significantly differed for total, CD4+, and CD20+ cells at baseline, for total cells and CD4+ at the sixth month, and for total cells at the 12th month.
Namely, when we found statistically significant differences among groups, the highest proportion of lymphocytopenia was always observed in the FTY group, whereas the lowest among the naive patients. Considering DMF-treated patients separately from other immunomodulators, these results remained consistent, with highest rate of lymphocytopenia observed for DMF and FTY.
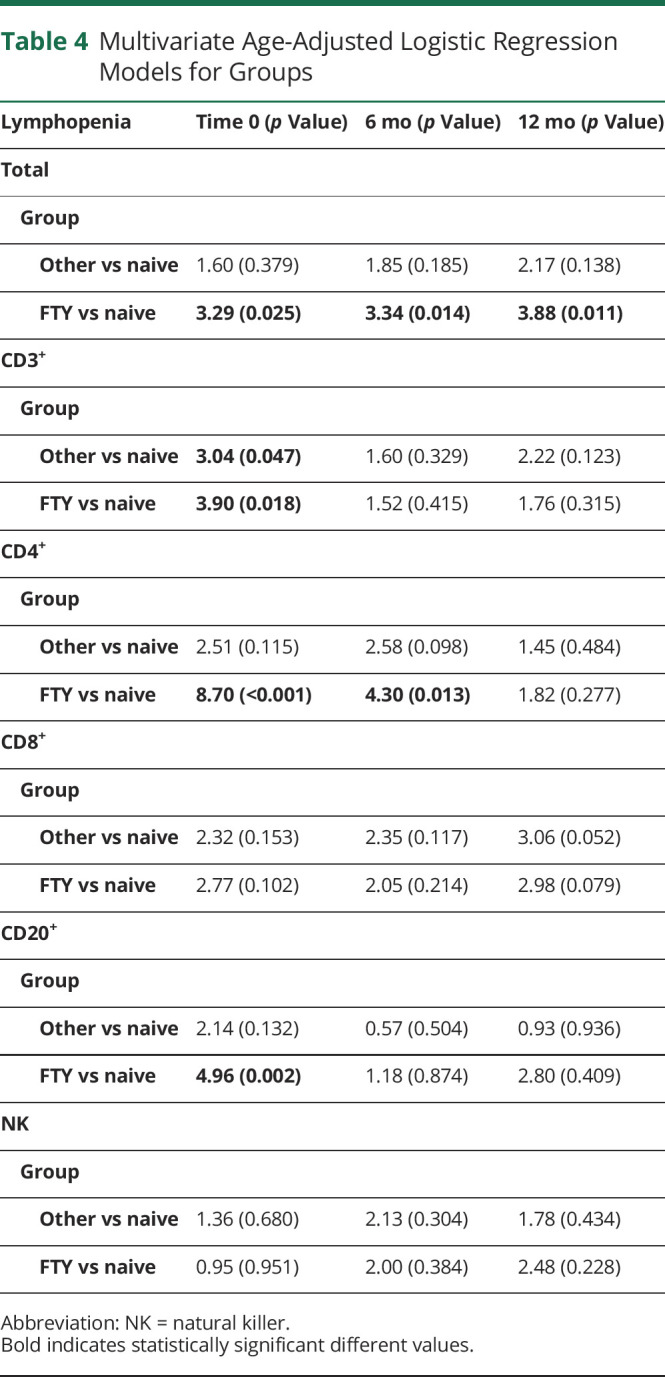
Consistently, logistic regression models showed that the odd of lymphocytopenia was significantly higher among FTY patients compared with the naive ones for total, CD3+, CD4+, and CD20+ cells at baseline, for total and CD4+ cells at the sixth month, and for total cells at the 12th month (Table 4). Results remained consistent when we also adjusted for sex and type of MS.
Table 4.
Multivariate Age-Adjusted Logistic Regression Models for Groups
When we studied the role of FTY exposure duration and washout period among individuals previously treated with FTY, we did not find any significant increase or decrease in the risk of lymphocytopenia (data not shown).
Discussion
This study contributes to existing explorations on T-cell longitudinal dynamic in patients treated with OCR in the postmarketing setting.
Our results show that in patients with MS exposed to OCR for 12 months, mean T-cell values, including CD3+, CD4+, and CD8+ cells, are not reduced overall. Nevertheless, when prior treatment status is taken into account, patients switching from another disease-modifying treatment, particularly FTY, show significantly lower CD3+ and CD4+ mean values at all the time points evaluated.
The reduction of CD4+ cells below the LLN, alias CD4+ lymphocytopenia, was achieved by a larger proportion of patients pretreated with FTY compared with other treatments or naive.
Notably, the significantly higher rate of CD4+ lymphocytopenia was detectable at 6 months but not at 12 months after OCR initiation, indicating that CD4+ cells undergo slow recovery over time.
Of interest, after adjustment for baseline values, no significant changes in mean T-cell values were observed during OCR treatment at all time points and across groups, suggesting that OCR has a limited role in the reduction of T cells; conversely, CD20+ B cells were almost completely depleted at 6 and 12 months, confirming the high OCR selectivity of action. Similar results were found in a cohort of patients with PPMS followed up for 6 months.6 In this cohort, OCR induced a drastic depletion of CD19+ B-cell counts, whereas it did not affect T-cell numbers, with the exception of CD20+ T cells.
Indeed, several other recent studies have shown that OCR and the other anti-CD20 monoclonal antibody rituximab may also deplete CD3+CD20+ T-cell subset7,8 and have indicated the action on T cells as possibly related with the efficacy of these drugs.6,7
However, the CD3+CD20+ T-cell subset accounts for only about 3–5% of all lymphocytes in human blood8 and 1.6% of all circulating CD3+ T lymphocytes9; thus, the reduction of CD3+ T cells observed in our sample is likely not due to the effect of OCR on this cells subset. In support of this hypothesis, it should be considered that a significant reduction in mean T-cell values was already detectable at baseline before OCR initiation, in particular in patients treated with FTY and DMF.
Moreover, although CD20+ is expressed in both CD4+ and CD8+ lymphocytes, the ratio of CD4+/CD8+ is shifted toward a higher proportion of CD20+ T cells coexpressing the CD8+ antigen. In contrast with that, our study shows that CD8+ T cells are not significantly depleted during the year of observation at any time point except for baseline both in the whole population and across groups.
So, looking at the T-cell dynamic from baseline to 12 months, we believe that if B-cell depletion is almost exclusively due to OCR, T-cell depletion should be mainly considered a carryover effect of previous therapies, particularly of FTY, although a minimal impact of OCR on CD3+CD20+ T cells subset cannot be excluded.
After adjusting for age, in fact, pretreatment with FTY was the only factor associated with an increased risk of total, CD3+, CD4+, and CD20+ cell lymphopenia at baseline, total and CD4+ lymphopenia at 6 months, and total lymphopenia at 12 months. In our sample, the median washout period from FTY was 62 days, which is commonly considered a sufficient interval to restore normal lymphocyte count after treatment interruption.10 Nevertheless, slower immune reconstitution after treatment cessation has been previously reported.3,11,12 In the study by Nagy et al.,3 of 58 patients interrupting FTY, 22% were still lymphopenic 1 year after discontinuation and 54% had not reached 80% of the baseline lymphocyte value. Indeed, because of the lack of large studies, the immunophenotypic profile of patients who have suspended FTY is still unexplored and needs further clarification. However, it is known that among lymphocyte subsets, FTY induces a greater reduction of peripheral CD4+ than CD8+ counts11,13; therefore, after treatment withdrawal, a slower return to normal values of CD4+ with respect to CD8+ may be hypothesized, which would be in line with our data. Reasons for such prolonged effects are unclear and may be related to reduced release of lymphocytes from lymph nodes, diminished production of new T cells,14 or to a synergistic effect with anti-CD20 therapy.3 Notably, we did not find any association between the length of FTY treatment and the risk of developing prolonged lymphopenia after treatment stop.
Similarly, it is uncertain whether this phenomenon is specific for FTY or may be attributed to MS-related premature immunosenescence.15,16 Nevertheless, considering patients treated with DMF separately from other immunomodulators, we observed similar findings at all time points. These results confirm that a prolonged T cell–depletion can be observed also in patients treated with DMF.4 Therefore, such potential effect of DMF should be taken into account in treatment sequencing.
Of interest, in our study, we have found that 15% of 40 naive patients were lymphopenic at baseline, before commencing OCR, suggesting that additional mechanisms other than iatrogenic may subtend premature immune aging taking place in MS.
Our study has many limitations, mainly consisting in its retrospective observational design. Blood samples were not available for all the patients at all the time points, and samples were not analyzed by a central laboratory. Moreover, because of the limited person-years of observation, it was not possible to explore the correlation of lymphopenia with malignancies or infectious complications, but major opportunistic infections or neoplasms were not reported (data not shown).
In conclusion, our study has shown that T-cell reduction may be observed during treatment with OCR, particularly in patients switching from FTY more than other treatments, despite supposedly adequate washout intervals.
Individuals starting OCR pre-exposed to other medications should be counseled about the potential risk of prolonged T-cell depletion due to the preconditioning immunologic effect of previous treatments, determining a double lymphocyte subset suppression (B and T cells).
Whether this condition is associated with a higher risk of opportunistic infections and malignancies is unknown and needs to be addressed in a larger population with longer follow-up.
A better understanding of the lymphocyte's dynamic occurring as an effect of specific treatment sequencing is critical for optimizing both OCR efficacy17 and safety.
Glossary
- DMF
dimethyl fumarate
- DMT
disease-modifying treatments
- FTY
fingolimod
- GA
glatiramer acetate
- IFN
interferon beta
- MS
multiple sclerosis
- NK
natural killer
- OCR
ocrelizumab
- RRMS
relapsing remitting multiple sclerosis
- TERI
teriflunomide
Appendix. Authors
Contributor Information
Alfonso Grimaldi, Email: alfonso.grimaldi@uniroma2.it.
Francesca Bovis, Email: francesca.bovis@gmail.com.
Marta Ponzano, Email: ponzano.marta@gmail.com.
Roberta Fantozzi, Email: rob.fantozzi@gmail.com.
Fabio Buttari, Email: fabio.buttari@gmail.com.
Elisabetta Signoriello, Email: elisabetta.signoriello@gmail.com.
Giacomo Lus, Email: giacomo.lus@unicampania.it.
Matteo Lucchini, Email: lucchinimatteo87@gmail.com.
Massimiliano Mirabella, Email: massimiliano.mirabella@policlinicogemelli.it.
Maria Cellerino, Email: mariacellerino@hotmail.com.
Matilde Inglese, Email: m.inglese@unige.it.
Gaia Cola, Email: colagaia@gmail.com.
Carolina Gabri Nicoletti, Email: carolgabri@gmail.com.
Giorgia Mataluni, Email: giorgia.mataluni@gmail.com.
Diego Centonze, Email: centonze@uniroma2.it.
Girolama Alessandra Marfia, Email: marfia@uniroma2.it.
Study Funding
No targeted funding reported.
Disclosure
D. Landi received travel funding from Biogen, Merck Serono, Sanofi-Genzyme, and Teva and speaking or consultation fees from Sanofi-Genzyme, Merck Serono, Teva, Biogen, and Roche. A. Grimaldi reports no disclosures relevant to the manuscript. F. Bovis received teaching honoraria from Novartis and has received personal compensation for consulting services from EISAI. M. Ponzano and R. Fantozzi report no disclosures relevant to the manuscript. F. Buttari acted as an advisory board member of Teva and Roche and received honoraria for speaking or consultation fees from Merck Serono, Teva, Biogen Idec, Sanofi, and Novartis and nonfinancial support from Merck Serono, Teva, Biogen Idec, and Sanofi. E. Signoriello received speaker honoraria and/or consultancy from Biogen, Teva, Genzyme, Merck, Novartis, Almirall, and Roche. G. Lus received speaker honoraria and/or consultancy from Biogen, Teva, Genzyme, Merck, Novartis, Almirall, and Roche. M. Lucchini received honoraria for consulting services and/or speaking, and/or travel support from Biogen, Merck Serono, Novartis, Roche, Sanofi-Genzyme, Almirall, and Bayer. M. Mirabella has scientific advisory board membership of Bayer Schering, Biogen, Sanofi-Genzyme, Merck, Novartis, Teva, Mylan, and Almirall, consulting and/or speaking fees, research support, or travel grants from Almirall, Bayer Schering, Biogen, CSL Behring, Sanofi-Genzyme, Merck, Novartis, Teva, Roche, and Ultragenyx; he is the principal investigator in clinical trials for Biogen, Merck, Novartis, Roche, Sanofi-Genzyme, Teva, Ultragenyx, and CSL Behring. M. Cellerino reports no disclosures relevant to the manuscript. M. Inglese received grants from the NIH, NMSS, and FISM and received fees for consultation from Roche, Genzyme, Merck, Biogen, and Novartis. G. Cola reports no disclosures relevant to the manuscript. C.G. Nicoletti received travel funding from Almirall, Biogen, Novartis, Sanofi-Genzyme, and Merck Serono. G. Mataluni reports no disclosures relevant to the manuscript. D. Centonze is an advisory board member of Almirall, Bayer Schering, Biogen, GW Pharmaceutical, Merck Serono, Novartis, Roche, Sanofi-Genzyme, and Teva and received honoraria for speaking or consultation fee from Almirall, Bayer Schering, Biogen, GW Pharmaceuticals, Merck Serono, Novartis, Roche, Sanofi-Genzyme, and Teva; he is also the principal investigator in clinical trials for Bayer Schering, Biogen, Merck Serono, Novartis, Roche, and Sanofi-Genzyme. G.A. Marfia received speaking or consultation fees from Almirall, Bayer Schering, Biogen, Genzyme, Merck Serono, Novartis, Teva, and Sanofi-Genzyme. Go to Neurology.org/NN for full disclosures.
References
- 1.European Medicines Agency. Accessed June 14, 2021. ema.europa.eu/en/documents/product-information/OCRvus-epar-product-information_en.pdf.
- 2.Vermersch P. T-cell population changes and serious infection rates in the controlled periods of the pivotal phase III trials of ocrelizumab in multiple sclerosis. ECTRIMS Online Library. 10/26/17; 200323; P668.
- 3.Nagy S, Kuhle J, Derfuss T. Lymphocyte recovery after fingolimod discontinuation in patients with MS. Neurol Neuroimmunol Neuroinflamm. 2020;7(6):e874. [DOI] [PMC free article] [PubMed] [Google Scholar]
- 4.Lucchini M, Prosperini L, Buscarinu MC, et al. Predictors of lymphocyte count recovery after dimethyl fumarate-induced lymphopenia in people with multiple sclerosis. J Neurol. 2021;286(6):2238-2245. [DOI] [PMC free article] [PubMed] [Google Scholar]
- 5.Thompson AJ, Banwell BL, Barkhof F, et al. Diagnosis of multiple sclerosis: 2017 revisions of the McDonald criteria. Lancet Neurol. 2018;17(2):162-173. [DOI] [PubMed] [Google Scholar]
- 6.Fernández-Velasco JI, Kuhle J, Monreal E, et al. Effect of ocrelizumab in blood leukocytes of patients with primary progressive MS. Neurol Neuroimmunol Neuroinflamm. 2021;8(2):e940. [DOI] [PMC free article] [PubMed] [Google Scholar]
- 7.Gingele S, Jacobus TL, Konen FF, et al. Ocrelizumab depletes CD20+ T cells in multiple sclerosis patients. Cells. 2018:8(1):12. [DOI] [PMC free article] [PubMed] [Google Scholar]
- 8.Schuh E, Berer K, Mulazzani M, et al. Features of human CD3+ CD20+ T cells. J Immunol. 2016;197(4):1111-1117. [DOI] [PubMed] [Google Scholar]
- 9.Wilk E, Witte T, Marquardt N, et al. Depletion of functionally active CD20+ T cells by rituximab treatment. Arthritis Rheum. 2009;60(12):3563-3571. [DOI] [PubMed] [Google Scholar]
- 10.Accessed June 14, 2021. novartis.us/sites/www.novartis.us/files/gilenya.pdf.
- 11.Ghadiri M, Fitz-Gerald L, Rezk A, et al. Reconstitution of the peripheral immune repertoire following withdrawal of fingolimod. Mult Scler. 2017;23(9):1225-1232. [DOI] [PubMed] [Google Scholar]
- 12.Takahashi K. Effect of dosage reduction on peripheral blood lymphocyte count in patients with multiple sclerosis receiving long-term fingolimod therapy. J Clin Neurosci. 2019;63:91-94. [DOI] [PubMed] [Google Scholar]
- 13.Mehling M, Brinkmann V, Antel J, et al. FTY720 therapy exerts differential effects on T cell subsets in multiple sclerosis. Neurology. 2008;71(16):1261-1267. [DOI] [PubMed] [Google Scholar]
- 14.Chiarini M, Sottini A, Bertoli D, et al. Newly produced T and B lymphocytes and T-cell receptor repertoire diversity are reduced in peripheral blood of fingolimod-treated multiple sclerosis patients. Mult Scler. 2015;21(6):726-734. [DOI] [PubMed] [Google Scholar]
- 15.Thewissen M, Linsen L, Somers V, Geusens P, Raus J, Stinissen P. Premature immunosenescence in rheumatoid arthritis and multiple sclerosis patients. Ann NY Acad Sci. 2005;1051:255-262. [DOI] [PubMed] [Google Scholar]
- 16.Grebenciucova E, Berger JR. Immunosenescence: the role of aging in the predisposition to neuro-infectious complications arising from the treatment of multiple sclerosis. Curr Neurol Neurosci Rep. 2017;17(8):61. [DOI] [PubMed] [Google Scholar]
- 17.Signoriello E, Lus G, Bonavita S, et al. Switch from sequestering to anti-CD20 depleting treatment: disease activity outcomes during wash-out and in the first 6 months of ocrelizumab therapy. Mult Scler. 2021;28(1):93-101. [DOI] [PubMed] [Google Scholar]
Associated Data
This section collects any data citations, data availability statements, or supplementary materials included in this article.
Data Availability Statement
Anonymized data will be shared with qualified investigators by request.