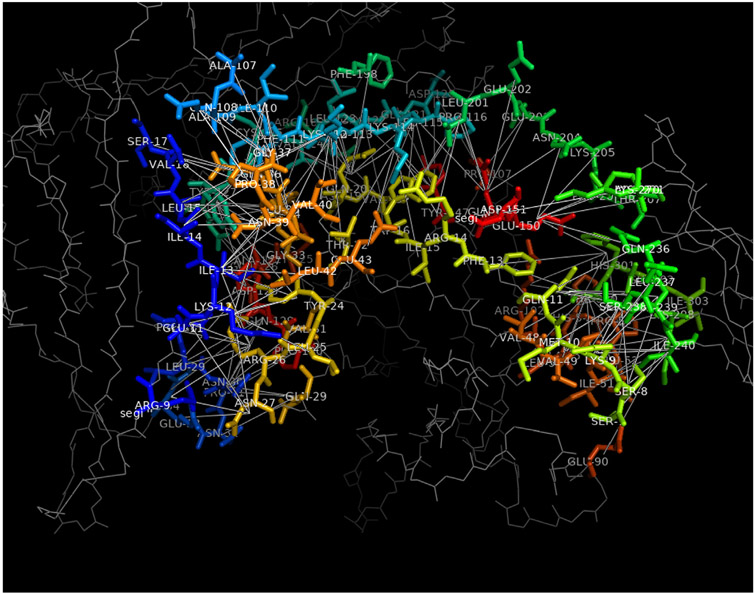
Fig. 3.
Visualization of the connection graph of PDB ID: 1IRA using iScore.h5x with the PyMol molecular viewer. All interface residues are colored differently following a rainbow color palette to facilitate their identification. The residues that are not part of the interface are represented as thin gray lines. The connection between interface residues are shown as white lines.

