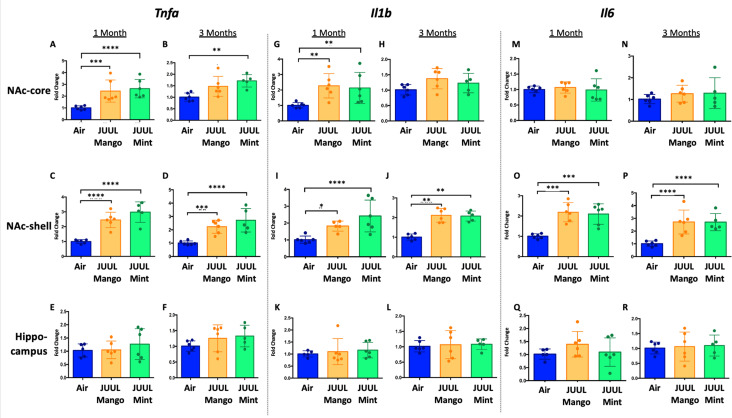
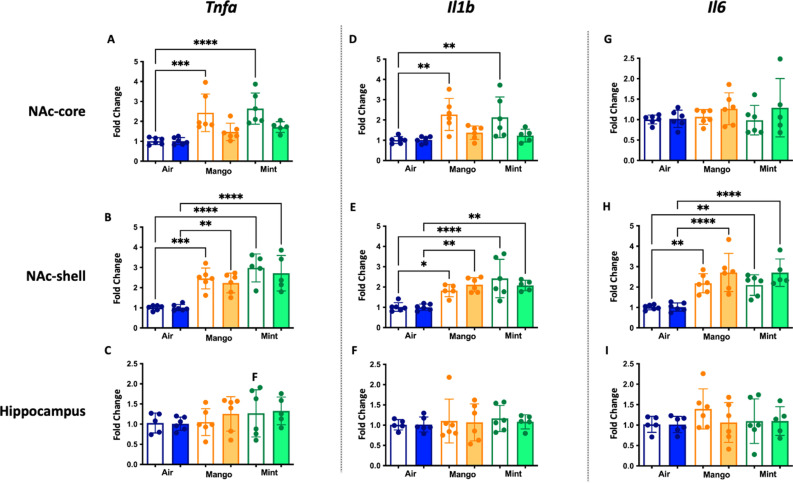
Figure 1. Three months of JUUL aerosol inhalation leads to an increase of pro-inflammatory cytokines in different regions of the brain.
Brains were harvested at the end point and the regions for NAc-core, NAc-shell and Hippocampus were harvested and frozen. RNA was extracted and qPCR was performed to quantify the expression of Tnfa, Il1b, Il6. Tnfa expression is shown from NAc-core at (A) 1 month and (B) 3 months, from NAc-shell at (C) 1 month and (D) 3 months, and from Hippocampus at (E) 1 month and (F) 3 months. Il1b expression is shown from NAc-core at (G) 1 month and (H) 3 months, from NAc-shell at (I) 1 month and (J) 3 months, and from Hippocampus at (K) 1 month and (L) 3 months. Il6 expression is shown from NAc-core at (M) 1 month and (N) 3 months, from NAc-shell at (O) 1 month and (P) 3 months, and from Hippocampus at (Q) 1 month and (R) 3 months. Data were analyzed with two-way ANOVA with Dunnett’s multiple comparisons for each brain region and timepoint. Data are presented as individual data points ± SEM with n = 5–6 mice per group. *p < 0.05, **p < 0.01, *** p < 0.001 and **** p < 0.0001.


