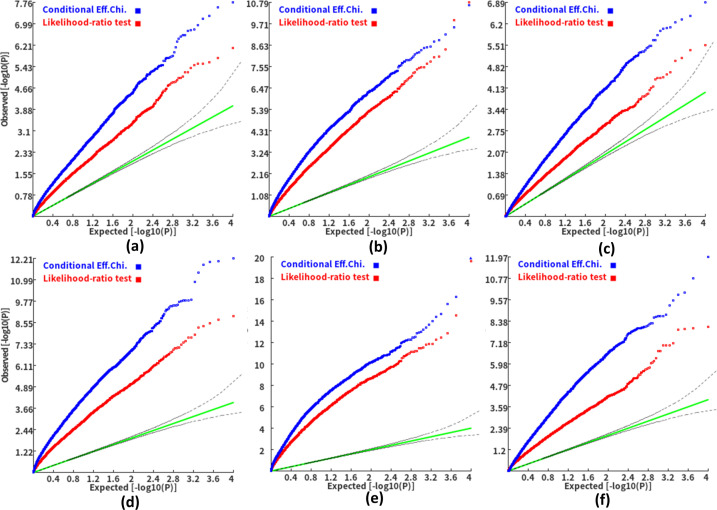
Figure 5. Q-Q plots of the conditional gene-based association test and likelihood-ratio test at different representative gene-variant pairs.
The variant number of the two gene-variant pairs involved in (a)-(f) are the same as that in Figure 4 legend. The difference is: in (a)-(c), the QTL in either gene (former and latter) explained 0.25% of heritability. In (d)-(f), the QTL in either gene explained 0.5% of heritability. One thousand phenotype datasets were simulated for each scenario.

