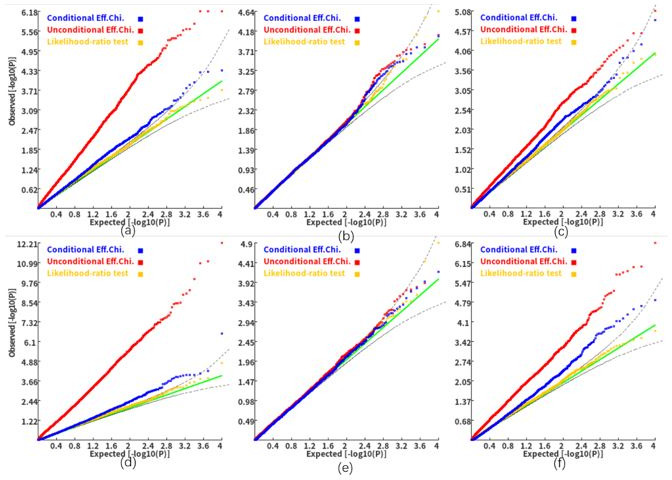
Author response image 2. Q-Q plots of the conditional, unconditional gene-based association test and likelihood-ratio test under the null hypothesis (c=1.8).

(a) and (d), two gene-variant pairs with the similar variant number (SIPA1L2 with 29 variants and LOC729336 with 30 variants). (b) and (e): two gene-variant pairs with different variant numbers, and the first is larger than the second (CACHD1 with 41 variants and RAVER2 with eight variants). (c) and (f): two gene-variant pairs with different variant numbers, and the second is larger than the first (LOC647132 with five variants and FAM5C with 48 variants). (a), (b) and (c): the former gene has no QTL, and QTL explained 0.5% of heritability in the latter gene. (d), (e) and (f): the former gene has no QTL, and QTL explained 1% of heritability in the latter gene. Ten thousand phenotype datasets were simulated for each scenario. Unconditional Eff. Chi. (the red) represents unconditional association analysis at the former gene by the improved ECS. Conditional Eff. Chi (the blue) represents conditional association analysis at the former gene conditioning on the latter gene by the improved ECS. The likelihood ratio test (the yellow) was conducted based on the nested linear regression models.
