

Abstract
Neuroimaging biomarkers for neurologic diseases are important tools, both for understanding pathology associated with cognitive and clinical symptoms and for differential diagnosis. This chapter explores neuroimaging measures, including structural and functional measures from magnetic resonance imaging (MRI) and molecular measures primarily from positron emission tomography (PET), in healthy aging adults and in a number of neurologic diseases. The spectrum covers neuroimaging measures from normal aging to a variety of dementias: late-onset Alzheimer’s disease [AD; including mild cognitive impairment (MCI)], familial and nonfamilial early-onset AD, atypical AD syndromes, posterior cortical atrophy (PCA), logopenic aphasia (lvPPA), cerebral amyloid angiopathy (CAA), vascular dementia (VaD), sporadic and familial behavioral-variant frontotemporal dementia (bvFTD), semantic dementia (SD), progressive nonfluent aphasia (PNFA), frontotemporal dementia with motor neuron disease (FTD-MND), frontotemporal dementia with amyotrophic lateral sclerosis (FTD-ALS), corticobasal degeneration (CBD), progressive supranuclear palsy (PSP), dementia with Lewy bodies (DLB), Parkinson’s disease (PD) with and without dementia, and multiple systems atrophy (MSA). We also include a discussion of the appropriate use criteria (AUC) for amyloid imaging and conclude with a discussion of differential diagnosis of neurologic dementia disorders in the context of neuroimaging.
INTRODUCTION
Neurodegenerative diseases affect millions across the world and result in considerable economic and societal cost to patients and families. The most common age-related neurodegenerative disease is Alzheimer’s disease (AD). Approximately 5.4 million older adults are afflicted with AD in the United States alone (Alzheimer’s Association, 2016). Other common types of neurodegenerative diseases include atypical and familial AD and AD-related disorders, frontotemporal dementia (FTD), vascular dementia (VaD), and Dementia with Lewy Bodies (DLB) or Parkinson’s disease dementia (PDD). There are also less common dementias, such as in Multiple Sclerosis (MS), Huntington’s disease (HD), HIV-associated neurocognitive disorder (HAND), and prion diseases (see Risacher and Saykin, 2013 for overview).
Neurodegenerative diseases affect the brain through various shared as well as unique mechanisms and result in changes in brain structure, function, and molecular composition. In living humans, cerebrospinal fluid (CSF) assays and neuroimaging are key laboratory investigations used to assess these changes in the brain. Both are sensitive to brain pathology, with imaging being the most commonly used medical test for diagnosis of neurodegenerative conditions in conjunction with careful clinical examination and neurocognitive assessment. Neuroimaging approaches can be divided broadly into three types: (1) structural imaging, which visualizes brain anatomy and pathology and measures volume and other tissue characteristics; (2) functional neuroimaging, which measures brain activity, blood flow, and glucose metabolism; and (3) molecular imaging, which yields information on biologic processes including protein aggregation, neuroinflammation, and related processes. In the clinical realm, computed tomography (CT) is widely available and often employed initially to obtain a quick survey of structural brain changes, with special attention to eliminating acute pathology such as trauma, mass lesions, hemorrhage, and ischemia. Although gross atrophic changes can be visualized by CT, the most informative structural neuroimaging in age-associated neurodegenerative diseases is magnetic resonance imaging (MRI). MR images are created by application of radiofrequency pulses in a strong magnetic field to produce excitation and energy release from hydrogen atoms within water molecules that are detected and reconstructed as images by the scanner.
There are many MRI-based imaging sequences or modalities used in brain imaging. Two are emphasized in this chapter: structural MRI (sMRI), which yields measures of brain volume and tissue characteristics, and diffusion tensor imaging (DTI), a specialized technique that has unique applicability to the study of white matter (WM) fiber tracts. DTI yields two major types of markers of brain WM integrity, namely, fractional anisotropy (FA) and diffusivity measures, the most frequently encountered of which are mean diffusivity (MD) and apparent diffusion coefficient (ADC). Reduced FA and increased MD/ADC are considered to be markers of neuronal fiber loss and reduced WM integrity. Diffusivity measures within gray matter (GM) also reflect its integrity. Functional neuroimaging to measure brain activity can be obtained with either MRI, through estimation of blood oxygenation levels (blood oxygenation level dependent imaging or BOLD imaging), or through positron emission tomography (PET) imaging. BOLD imaging can be obtained during a stimulation paradigm while in the MRI scanner, such as during sensory-motor or cognitive tasks (task-related fMRI), or during a task-free condition typically referred to as resting-state fMRI (rsfMRI). Analysis techniques for rsfMRI provide information about functional networks of connected brain regions, referred to as functional connectivity networks. These can be task-related or resting state networks (RSN).
PET imaging involves the administration of a small quantity of a “tracer” compound tagged with a radioactive isotope. The emission of radioactivity during decay from various brain regions in which the tracer is retained differentially is quantified by detectors and reconstructed into images by the PET scanner. [18F]-fluorodeoxyglucose (FDG) PET uses a glucose analog tracer that is taken up by neurons that are actively utilizing glucose. FDG gets trapped in the cell and reflects brain regions that are most metabolically active. A newer generation of PET tracers bind to abnormal proteins, neurotransmitter receptors, or enzymes, and are also commonly used in the study of neurodegenerative conditions. The most commonly used tracers bind to pathologic proteins that are present in neurodegenerative conditions (proteinopathies). These include the amyloid-beta plaques that are a hallmark of AD and the neurofibrillary tau tangles (NFT), also present in AD as well as in a number of other neurodegenerative conditions (the latter termed tauopathies). The most commonly used tracers for measuring amyloid-beta plaques are [11C]-PiB, which is only used in research in part due to the short half-life, [18F]-Florbetapir (Amyvid®), [18F]-Florbetaben (NeuraCeq®), and [18F]-Flutemetamol (Vizamyl®). All have been confirmed to bind to amyloid plaques in vitro (Ikonomovic et al., 2008; Clark et al., 2012; Fodero-Tavoletti et al., 2012; Curtis et al., 2015). The F18-based amyloid tracers are now FDA-approved, and an updated appropriate use criteria (AUC) have been published for amyloid PET imaging (Johnson et al., 2013a,b). More widespread use of amyloid PET has been limited by problems with reimbursement for these scans, which as of this writing is not approved by Medicare or other third party insurance companies. CMS is presently evaluating data from a large comparative effectiveness trial, to reassess coverage based on evidence. The Imaging Dementia—Evidence for Amyloid Scanning (IDEAS) Study data will help determine if information about a subject’s amyloid status produces clinical value even in the absence of effective treatment.
Recent major advances have also led to experimental tracers that bind to NFT with high affinity, with [18F]Flortaucipir (also known as T807 and AV-1451) having had the most widespread use to date (Chien et al., 2013). Other early tau tracers include [11C]PBB3, [18F] THK-5117, and [18F]THK-5351, the last showing notable off target MAO-B binding (Lemoine et al., 2017). In addition, Merck and Piramal both have promising new tau tracers beginning to undergo clinical validation studies.
Overall, these neuroimaging tools provide an in vivo window on the brain permitting assessment of brain structure, function, and the presence of abnormal proteins, previously detectable only by postmortem examination. These have ultimately led to a better understanding of the diseases themselves, as well as improved diagnostic accuracy and the potential for more targeted therapeutic trials.
This chapter discusses neuroimaging findings in early preclinical and prodromal disease stages as well as in manifest neurodegenerative disease. First, we discuss neuroimaging changes seen in preclinical AD defined by genetics, amyloid status, or other risk factors, followed by findings in prodromal AD (MCI) and clinical AD. Second, nonfamilial early onset AD, familial AD, and other amyloid-beta associated disorders including posterior cortical atrophy (PCA), logopenic aphasia, and cerebral amyloid angiopathy (CAA) are discussed. Third, we discuss neuroimaging findings in vascular cognitive impairment (VCI) and vascular dementia (VaD). We then discuss neuroimaging changes seen in FTD, including in behavioral variant FTD, semantic dementia (SD), progressive nonfluent aphasia (PNFA), and motor-associated FTDs, such as corticobasal degeneration (CBD), progressive supranuclear palsy (PSP), FTD with motor neuron disease (FTD-MND, also termed FTD with amyotrophic lateral sclerosis; FTD-ALS). Finally, DLB, Parkinson’s disease with (PDD) and without dementia (PD), and multiple systems atrophy (MSA) are covered. We conclude by discussing the role of neuroimaging in differential diagnosis.
PRECLINICAL, PRODROMAL, AND CLINICAL AD
Alzheimer’s disease, the most common age-related neurodegenerative disorder, is characterized by two neuropathologic hallmarks: amyloid beta plaques and NFT. Amyloid plaques, composed of extracellular aggregations of amyloid-beta (Aβ) peptides, are found throughout the brain in AD. NFT result from the hyper-phosphorylation of the microtubule-associated protein tau, which forms insoluble filamentous structures that combine to create paired helical filaments, a key component of NFTs. Neither the temporal relationship nor the direct link between amyloid plaques and NFT has been completely explained. Current theoretical models suggest that in canonical AD, Aβ plaque formation precedes NFT, with amyloid accumulation occurring during a long preclinical period spanning years to decades before onset of clinical symptoms (Jack et al., 2013). Ultimately, the biochemical and proteinopathic changes in AD converge, leading to widespread synapse and neuronal loss. In AD, the earliest regions of the brain that show neuronal loss are in the medial temporal lobe (MTL), including the entorhinal cortex, hippocampus, amygdala, and parahippocampal cortex, as well as cholinergic innervation from the nucleus basalis of Meynert (Braak et al., 1993). By the time a patient has reached a diagnosis of clinical AD, neurodegeneration is usually found throughout the neocortical and subcortical regions, with significant atrophy of temporal, parietal, and frontal cortices but relative sparing of primary occipital and sensory-motor regions (Braak et al., 1993).
AD diagnostic criteria for clinical and research use have been updated from the initial criteria developed in 1984 (McKhann et al., 2011), and they are likely to undergo further revision based on further biomarker evidence. The earliest clinical symptoms of AD are episodic memory impairments; deficits in language, semantic memory, visuospatial skills, and executive functioning may also be present. Currently, a diagnosis of AD dementia is made based on the presence of cognitive decline that significantly impairs daily activities. Attempts to diagnose AD earlier led to the development of the clinical syndrome of MCI (Petersen et al., 1999), or in the terminology of the International Working Group (IWG), prodromal AD. An updated criteria for diagnosis of MCI in clinical and research settings has also been published (Albert et al., 2011). Patients with MCI typically show deficits in episodic memory that fall more than 1–1.5 standard deviations below demographically adjusted and culturally appropriate normative levels. The most common presentation of MCI features memory impairment (amnestic MCI), but other cognitive deficits such as in executive function or language are commonly seen (Albert et al., 2011). Amnestic MCI is widely considered to be a prodromal form of AD, as nearly 10%–15% of amnestic MCI patients convert to AD each year, relative to only 1%–2% of the general older adult population (Petersen et al., 1999).
Anticipating that a future disease modifying treatment will require timely early diagnosis, researchers have been attempting to detect AD-related pathophysiologic changes and predict progression even earlier than MCI (e.g., “pre-MCI” or “preclinical AD”). Sperling et al. defined a conceptual framework for identification of preclinical AD defining three preclinical stages using biomarkers (Sperling et al., 2011). Stage 1 includes asymptomatic individuals who have evidence of amyloid deposition on either PET imaging or CSF measures. Stage 2 refers to asymptomatic individuals with evidence of both amyloid and neurodegeneration or neuronal dysfunction, defined as atrophy or brain dysfunction on MRI, hypometabolism on FDG PET, or increased tau on PET and/or CSF. Stage 3 includes those with positive amyloid and neurodegenerative biomarkers and, in addition, the emergence of subtle cognitive decline. Thus, preclinical AD patients can be defined using biomarkers to identify cognitively normal individuals with significant amyloid burden. Preclinical AD patients can also be identified by genetic risk, such as those with a family history of AD or who are carriers of one or two apolipoprotein E (APOE) epsilon 4 (ϵ4) alleles, the most significant genetic risk variant associated with late-onset AD (LOAD). Familial AD patients, who carry a deterministic mutation in the presenilin 1 (PSEN1), presenilin 2 (PSEN2), or amyloid precursor protein (APP) genes, are rare but provide a unique population to study the preclinical stages of disease, as the course and timing of the progression to dementia are relatively predetermined within families. Finally, euthymic older adults who nonetheless have concerns about their memory and cognition in the absence of cognitive decline, referred to as subjective cognitive decline (SCD), are considered a preclinical AD population (Jessen et al., 2014). This population, also referred to as a cognitive complaint (CC) (Saykin et al., 2006) or significant memory concern (SMC) (Risacher et al., 2015) group, is of considerable interest in recent times for neuroimaging investigations that indicate enriched dementia risk as a function of perceived decline.
Preclinical AD
Neuroimaging measures have been used to predict progression from a cognitively normal (CN) state to MCI. sMRI demonstrates increases in ventricular volume and reductions in global brain volume and medial temporal lobe (MTL) volume, including of the entorhinal cortex. These changes occur up to 10 years before cognitive decline, which provide predictive information (Dickerson et al., 2012; Tondelli et al., 2012). High resolution scans, coupled with specialized software, permit delineation and volume measurement of subregions of the hippocampus, and have shown reduced CA1 and subiculum volume associated with progression to MCI (Apostolova et al., 2010b; Cong et al., 2018). Changes in the parietal lobe, including measures of atrophy and white matter hyperintensities (WMHI), a measure of cerebrovascular small vessel disease, have also been noted as potential biomarkers for the progression from normal cognition to MCI (Brickman et al., 2012; Kantarci et al., 2013). Finally, atrophy in the prefrontal cortex and rate of atrophy of the basal forebrain have been identified as potential predictors of progression from CN to MCI (Burgmans et al., 2009; Grothe et al., 2013).
Other neuroimaging measures have also shown prognostic value in patients who later convert from CN to MCI. Disrupted functional activity in the precuneus and posterior cingulate during encoding, measured using task-based fMRI, has been noted in individuals who subsequently progress to MCI (Rami et al., 2012). Hypometabolism in medial temporal and parietal regions measured with [18F]FDG PET is also associated with future decline from CN to MCI (Rizk-Jackson et al., 2013; Ewers et al., 2014). Amyloid accumulation assessed by PET or CSF often precedes cognitive decline and is believed to drive subsequent decline in [18F]FDG PET measures in the medial temporal lobe, orbitofrontal cortex, and cingulate, synergistically with p-tau measured in the CSF (Pascoal et al., 2017). In addition, cognitively older adults scanned with [18F]Flortaucipir, measuring NFT load, showed an association between temporal lobe tracer binding and faster decline in cognition (including episodic memory), increased atrophy, and increased amyloid deposition (Johnson et al., 2016; Scholl et al., 2016). Further, the presence of amyloid and tau was associated with aberrant activity during memory encoding (Marks et al., 2017). Finally, amyloid and tau showed an interactive effect on resting-state functional connectivity such that those with high amyloid and low tau binding showed increased connectivity in the salience and default mode network (DMN), while those with both high amyloid and high tau showed reduced connectivity in these networks (Schultz et al., 2017).
Similar findings are associated with earlier stage preclinical AD groups. Thus, we now discuss preclinical AD patients defined by a positive amyloid scan, genetic background of risk due to the presence of an APOE ϵ4 allele or a positive family history, the presence of an autosomal dominant genetic mutation in PS1, PS2, or APP, or the presence of SCD.
Preclinical AD—Aβ positive cognitively normal older adults
Approximately 25%–30% of cognitively normal older adults are amyloid positive on PET scans (Aizenstein et al., 2008; Villemagne et al., 2008) (Fig. 12.1). These individuals are more likely to progress to cognitive impairment (Villemagne et al., 2008; Chetelat et al., 2013). However, the rate of progression is affected by other factors, such as genetic background (i.e., presence of an APOE ϵ4 allele) (Lim et al., 2015), cognitive reserve (Rentz et al., 2010), age (Jack et al., 2015), and lifestyle factors such as exercise or diet (Liang et al., 2010; Wirth et al., 2014). These individuals may have subtle impairments in cognition, especially in episodic memory and executive function (Harrington et al., 2013; Sperling et al., 2013). On sMRI measures, amyloid positive CN study participants show smaller hippocampal volume, including in hippocampal subfields such as the hippocampal tail, presubiculum, and subiculum (Apostolova et al., 2010a; Hsu et al., 2015). Further, these participants have an accelerated rate of cortical atrophy (Chetelat et al., 2012). DTI measures of white matter integrity have shown increased diffusion in multiple white matter tracts (Molinuevo et al., 2014). Functional MRI measures have shown differences in activation during tasks (Rami et al., 2012) and at rest, with reduced functional connectivity in the DMN and changes in connectivity in cortical hubs (Sperling et al., 2009). Increased metabolism in the lateral prefrontal cortex, superior temporal gyrus, and thalamus has also been reported in amyloid positive CN participants (Johnson et al., 2014). Finally, in cognitively normal older adults, amyloid positivity is associated with increased tau PET tracer binding in the medial and lateral temporal cortex, as well as the medial and lateral parietal lobe (Fig. 12.1C) (Brier et al., 2016; Scholl et al., 2016).
Fig. 12.1.
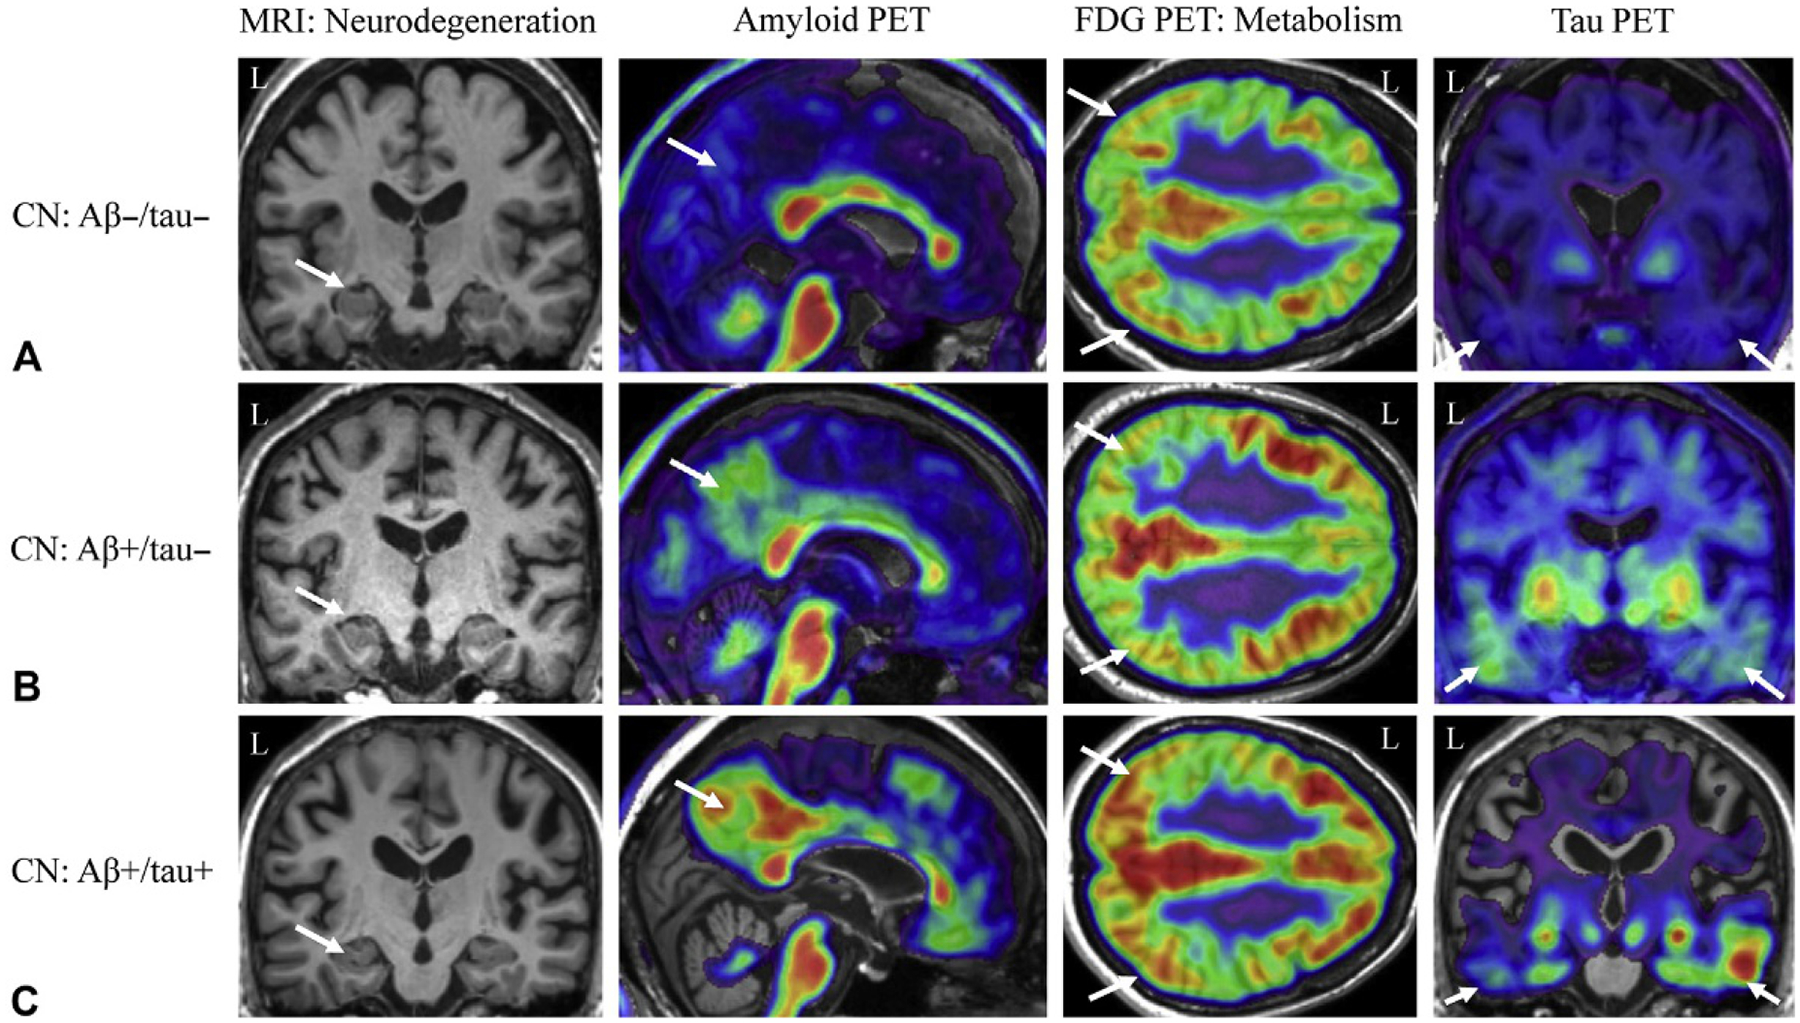
Neuroimaging biomarkers in cognitively normal older adults. Cognitively normal older adults can present with varying amounts of amyloid and tau positivity. For example, the cognitively normal older adult in (A) shows minimal amyloid (second column, white arrow) or tau positivity (fourth column, white arrows), medial temporal lobe (MTL) atrophy (first column, white arrow) or lateral parietal glucose hypometabolism (third column, white arrows). However, another cognitively normal adult in (B) shows amyloid positivity (second column, white arrow) but no MTL neurodegeneration (first column, white arrow) or hypometabolism (third column, white arrows), with low levels of tau positivity (fourth column, white arrows). Finally, the older adult in (C) shows both amyloid (second column, white arrow) and tau (fourth column, white arrows) positivity, in the absence of marked MTL neurodegeneration (first column, white arrow) or hypometabolism (third column, white arrows). Aβ−, amyloid-beta negative; Aβ+, amyloid-beta positive; CN, cognitively normal older adult; FDG, fluorodeoxyglucose; L, left; MRI, magnetic resonance imaging; PET, positron emission tomography; tau−, tau negative; tau+, tau positive; Note: all example images taken from the Alzheimer’s Disease Neuroimaging Initiative (ADNI) dataset.
Preclinical AD—Genetic risk
Populations at genetic risk for late-onset AD, including those with a positive family history and carriers of one or more APOE ϵ4 alleles, also show differences compared to controls on neuroimaging measures preceding any clinical symptoms. Further, both those with a positive family history, particularly maternal history, and APOE ϵ4 carriers show increased amyloid deposition in asymptomatic stages, thereby placing them at risk for the changes described in the previous section (Reiman et al., 2009; Mosconi et al., 2010; Risacher et al., 2015). CN participants with a family history of dementia show increased brain atrophy in the MTL, including in hippocampal subfields such as the subiculum, and frontal and parietal lobes (Honea et al., 2011; Mosconi et al., 2014). CN APOE ϵ4 carriers showed a similar pattern with greater MTL atrophy, including in hippocampal subfields such as the subiculum, CA3, and dentate gyrus, and a faster atrophy rate than noncarriers (Mueller and Weiner, 2009; Donix et al., 2010b). In fact, those with both a positive family history and an APOE ϵ4 allele showed the greatest atrophy in the subiculum (Donix et al., 2010a), as well as reduced [18F] FDG PET uptake in temporoparietal association areas (Langbaum et al., 2010). On DTI, those with a positive family history of dementia show reduced FA in areas known to be affected in AD (Bendlin et al., 2010), including the cingulum, corpus callosum, and uncinate fasciculus. APOE ϵ4 carriers show similar reductions in WM integrity measured using both FA (reduced) and MD (increased) (Heise et al., 2011; Wang et al., 2015b). WM and gray matter reductions are even seen in infant carriers of the APOE ϵ4 allele relative to noncarriers (Dean 3rd et al., 2014). fMRI studies in APOE ϵ4 carriers have showed altered activation during tasks, including altered hippocampal activation during episodic encoding and recall and altered activation during working memory tasks (Johnson et al., 2006; Wishart et al., 2006). Changes in resting-state connectivity of the DMN are also observed in APOE ϵ4 carriers (Sheline et al., 2010; Trachtenberg et al., 2012), even in younger individuals (Filippini et al., 2009; Dennis et al., 2010) and those who are amyloid negative (Sheline et al., 2010). CN individuals with a positive family history, especially of both parents, showed reduced cerebral metabolism on [18F] FDG PET in frontal, parietal, and temporal regions relative to those without a family history (Mosconi et al., 2007; Mosconi et al., 2014). CN APOE ϵ4 carriers show similar changes in glucose metabolism on [18F]FDG PET, including reduced metabolism in the cingulate, temporal and parietal lobes, prefrontal cortex, and MTL (Knopman et al., 2014).
Preclinical AD—Familial AD populations
Nearly 5% of AD cases are caused by dominantly inherited genetic mutations in PSEN1, PSEN2, or APP. An interesting characteristic of these autosomal dominant AD forms is that in each generation carriers have approximately the same age of onset. This permits calculation of an estimated age (year) of onset (EYO) for known mutation carriers, years before symptoms emerge. Neuroimaging studies in these asymptomatic mutation carriers (aMC), benchmarked relative to their EYO, has provided the scientific community a much better understanding of the development of AD and helped to shape the current framework for understanding the time course of pathology and the role of biomarkers in the detection of AD. In a seminal study from the Dominantly Inherited Alzheimer Network (DIAN), Bateman and colleagues demonstrated that the first detectable changes in aMC was reduced CSF amyloid, which occurred approximately 25 years before EYO (Bateman et al., 2012). Similarly, PET amyloid, increased CSF tau, and MRI measures of hippocampal atrophy could detect pathology approximately 15 years before EYO. Hypometabolism on [18F]FDG PET and declining episodic memory performance could be detected approximately 10 years before EYO, followed by changes in global cognition that occurred approximately 5 years before the EYO. A similar pattern and ordering of the biomarkers was observed in an additional study, although with a more delayed time relative to EYO (Yau et al., 2015). An additional analysis also showed a trend for reduced GM in the thalamus and lateral temporal lobe as participants approached their EYO (Cash et al., 2013). Other studies have shown accelerating atrophy rates in the MTL, temporoparietal regions, posterior cingulate, and precuneus as aMC approach their EYO (Fox et al., 1996; Ridha et al., 2006). In addition, an increased amount of WMH was observed in aMC (Lee et al., 2016). A DTI study of aMC showed reduced FA in the whole brain, as well as specific changes in the fornix, perforant path, and orbitofrontal WM (Ringman et al., 2007). Task-based fMRI studies have suggested that aMC may have increased activation during episodic memory and working memory tasks, which may change as aMC approach the EYO (Quiroz et al., 2010; Sala-Llonch et al., 2013). However, one study did find decreased activation during a novelty encoding task in aMC relative to noncarriers (Ringman et al., 2011). A study of rsfMRI showed decreased DMN connectivity in the precuneus and posterior cingulate cortex relative to noncarriers, which further declined as they approached their EYO (Chhatwal et al., 2013). Another study showed additional DMN changes in aMC, with increased anterior DMN activity and decreased posterior DMN (Sala-Llonch et al., 2013). aMC also show reduced metabolism in the whole brain, including the temporal lobe, parietal lobe, MTL, and posterior cingulate using [18F]FDG PET measures (Kennedy et al., 1995; Mosconi et al., 2006). Finally, amyloid PET studies have shown increased tracer uptake in aMCI that was associated with future cognitive decline (Bateman et al., 2012; Wang et al., 2015a).
Preclinical AD—SCD participants
Another population with increased risk of progression to cognitive decline and dementia are older adults with SCD (Jessen et al., 2014). sMRI measures showed reduced hippocampal volumes, including in the CA1 subregion of the hippocampus, and cortical atrophy (van der Flier et al., 2004; Saykin et al., 2006; Scheef et al., 2012), as well as increased atrophy rates (Stewart et al., 2011). DTI studies have shown differences in WM integrity in SCD, including increased MD and decreased FA in MTL and posterior cingulate/retrosplenial regions (Selnes et al., 2012; Wang et al., 2012b). These WM changes are predictive of future cognitive decline (Selnes et al., 2013). On fMRI, altered activation during a variety of cognitive tasks was seen in older adults with SCD, including reduced hippocampal activation but increased activity in the prefrontal cortex during encoding tasks (Rodda et al., 2009; Erk et al., 2011) and increased activation in the MTL, thalamus, caudate, and posterior cingulate during a divided attention task (Rodda et al., 2011). Resting-state studies have also shown reduced DMN connectivity in the hippocampal in SCD (Wang et al., 2013). [18F]FDG PET studies have shown hypometabolism in the MTL in older adults with SCD (Mosconi et al., 2008; Scheef et al., 2012), especially in those who also carry an APOE ϵ4 allele. Finally, APOE ϵ4 older adults with SCD show increased amyloid deposition on PET (Risacher et al., 2015), which is associated with the extent of SCD, gray matter atrophy, and lower performance on episodic memory tasks (Chetelat et al., 2010; Perrotin et al., 2012).
Neuroimaging in MCI
Patients with MCI are considered at high risk for development of AD, with 10%–15% conversion to dementia per year (Fig. 12.2A and B). Therefore, MCI is generally considered a prodromal stage of AD although it is recognized that there is some heterogeneity of outcome. sMRI shows significant brain atrophy in MCI, particularly in regions of the MTL and lateral temporal lobe; in the majority of the hippocampal subfields such as CA1, subiculum, CA2/3, CA4/dentate gyrus, fimbria, and presubiculum; in other subcortical regions, such as the thalamus, basal forebrain, and basal ganglia; and throughout the cortex (Grothe et al., 2012; Yushkevich et al., 2015). Further, measures of hippocampal and cortical atrophy were able to distinguish MCI patients from CN (Trivedi et al., 2006) and predicted conversion from MCI to AD (Khan et al., 2015). In fact, studies have shown significant differences in the MTL and cortex between those destined to convert from MCI to AD and those who will remain cognitively stable (Risacher et al., 2009; Devanand et al., 2012). Patients with MCI also showed faster rates of hippocampal (approximately −3% per year vs approximately −1% in CN) and cortical atrophy relative to CN; again, those destined to convert from MCI to AD show faster atrophy rates than those who remained stable (Barnes et al., 2009; Risacher et al., 2010).
Fig. 12.2.
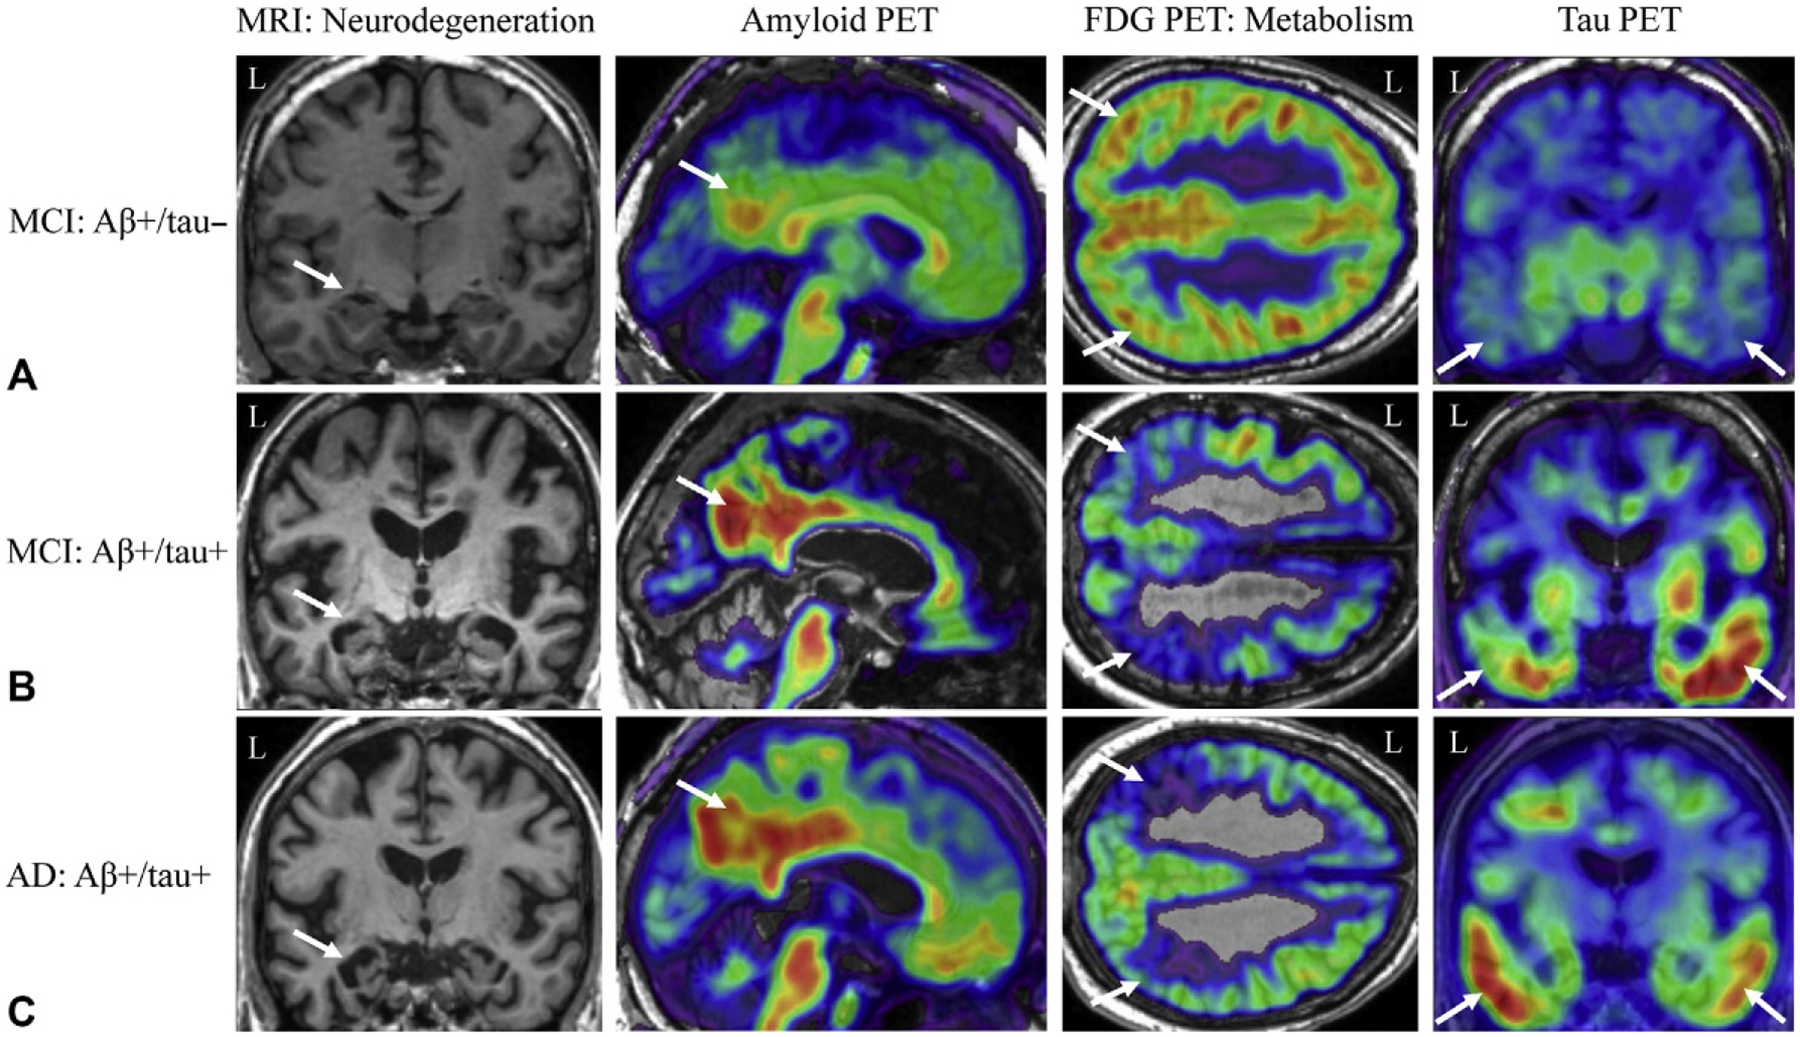
Neuroimaging biomarkers in patients with mild cognitive impairment (MCI) or Alzheimer’s disease (AD). Patients with mild cognitive impairment (MCI) can present with varying amounts of amyloid and tau positivity. In (A), the MCI patient shows slight medial temporal lobe (MTL) neurodegeneration (first column, white arrow) and lateral parietal glucose hypometabolism (third column, white arrows), amyloid positivity (second column, white arrow) but minimal tau binding (fourth column, white arrows). The MCI patient in (B), however, shows a higher amount of amyloid (second column, white arrow) and tau (fourth column, white arrows) deposition, with marked MTL neurodegeneration (first column, white arrow) and parietal glucose hypometabolism (third column, white arrows). The AD patient in (C) shows a commonly observed pattern of biomarker positivity, including amyloid positivity (second column, which arrow), tau positivity (fourth column, white arrows), and marked MTL neurodegeneration (first column, white arrow) and lateral parietal glucose hypometabolism (third column, white arrows). Aβ−, amyloid-beta negative; Aβ+, amyloid-beta positive; CN, cognitively normal older adult; FDG, fluorodeoxyglucose; L, left; MRI, magnetic resonance imaging; PET, positron emission tomography; tau−, tau negative; tau+, tau positive; Note: all example images taken from the Alzheimer’s Disease Neuroimaging Initiative (ADNI) dataset.
DTI studies show widespread changes in the WM of the cingulum, fornix, corpus callosum, and superior and inferior longitudinal fasciculi in patients with MCI, particularly those who are tau-PET positive (Pievani et al., 2010; Lim et al., 2014). These measures of changes in WM integrity can both differentiate MCI from CN cross-sectionally and predict progression from MCI to AD (Douaud et al., 2013; Nowrangi et al., 2013). Task-based fMRI studies in MCI have shown mixed results, and have suggested that less impaired MCI patients show hyperactivation in the MTL during encoding, while more impaired MCI patients show hypoactivation (Dickerson et al., 2005; Celone et al., 2006). In fact, studies have shown that those with the most increased activity are the most likely to progress later (Rombouts et al., 2005; O’Brien et al., 2010). MCI patients also have impaired DMN deactivation upon task initiation, with increasing lack of deactivation as severity of the MCI increases (Rombouts et al., 2005; Celone et al., 2006). Resting-state fMRI studies have also shown decreased connectivity of the DMN, which tracks with disease progression and can predict conversion from MCI to AD (Celone et al., 2006; Brier et al., 2012).
Hypometabolism in the posterior temporal, cingulate, and parietal lobes has also been reported in patients with MCI on [18F]FDG PET, which can predict progression to AD (Langbaum et al., 2009; Landau et al., 2010). As might be expected, 50%–70% of patients with MCI show amyloid deposition on PET, which is more common in patients with amnestic rather than nonamnestic presentations (Forsberg et al., 2008; Risacher et al., 2013). Amyloid positivity on PET has also been shown to be associated with cognition in MCI, an effect that is mediated by hippocampal volume and cognitive reserve (Mormino et al., 2009; Rentz et al., 2010). On tau PET imaging, MCI patients show increased binding relative to CN, particularly in the inferior temporal lobe, posterior cingulate, and fusiform, entorhinal, and parahippocampal gyri (Chien et al., 2013; Johnson et al., 2016), but with MCI patients showing a range of Braak stages from I to VI (Schwarz et al., 2016). Notably, MCI patients who were amyloid positive showed the greatest amount of tau, while those who were amyloid negative rarely had a Braak stage >0 (Schwarz et al., 2016). Future studies will determine whether tau PET will be predictive of subsequent cognitive decline.
Neuroimaging biomarkers in AD
Patients with AD show similar but typically much more severe changes on MRI and PET imaging than individuals in earlier stages of disease (Fig. 12.2C). sMRI measures show the presence of significant brain atrophy in AD patients, following an anatomical distribution similar to the pattern reported by Braak and Braak (Braak et al., 1993). Specifically, AD patients show widespread atrophy, including in the MTL (hippocampus, entorhinal cortex) and lateral temporal lobe (LTL), medial and lateral parietal lobe, and the frontal lobes, with relative sparing of the occipital lobes and sensory-motor cortex until later in the disease course (Frisoni et al., 2009). Changes in subfields of the hippocampus are also evident in patients with AD, including significant atrophy in the subiculum, presubiculum, CA1, CA2/3, and CA4/dentate gyrus (Mueller and Weiner, 2009; Wisse et al., 2014). Atrophy in other subcortical regions is also seen in AD, including in the amygdala, anteroventromedial thalamus, basal ganglia (caudate, putamen, pallidum, and nucleus accumbens), and the basal forebrain (Barnes et al., 2006; Grothe et al., 2014). Measures of hippocampal atrophy and shape features distinguish AD cases from controls (Gerardin et al., 2009). Longitudinal studies have shown higher cortical atrophy rates in patients with AD, with an approximate annual hippocampal decline of −4.5% (Barnes et al., 2009; Risacher et al., 2010).
DTI studies have shown that AD patients have reduced FA and increased diffusion relative to CNs in many WM structures—predominantly in posterior regions, including the corpus callosum, cingulum, uncinate fasciculus, superior longitudinal fasciculus, fornix, and inferior longitudinal fasciculus (Pievani et al., 2010). Results from fMRI studies in AD have shown decreased or even absent activation relative to CN in the MTL, posterior cingulate, parietal lobe, and frontal lobe during episodic memory encoding and recall tasks (Sperling et al., 2003; Li et al., 2015). AD patients have shown impaired repetition suppression or the inability to repress activation upon demonstration of a repeated probe (Johnson et al., 2004). However, in some studies AD patients do show increased activation relative to controls that may be compensatory in nature, e.g., as noted during semantic memory tasks in an early fMRI study (Saykin et al., 1999). Resting-state fMRI studies have shown decreased connectivity of the DMN in AD that is associated with severity (Greicius et al., 2004; Celone et al., 2006).
[18F]FDG PET shows significant reductions in cerebral glucose metabolism in AD relative to controls, particularly in the temporoparietal cortex, posterior cingulate, parietal lobe, temporal lobe, and MTL, including the hippocampus (Langbaum et al., 2009; He et al., 2015). Hypometabolism in the frontal lobes is seen in later stages of AD and relates to dementia severity (Herholz et al., 1999). Importantly, information regarding regional hypometabolism has been shown to improve diagnostic accuracy in clinical settings (Salmon et al., 1994; Silverman et al., 2002). In longitudinal studies AD patients show a greater rate of annual decline in metabolism than CN in the temporal, parietal and frontal lobes, as well as the posterior cingulate and precuneus in AD (Alexander et al., 2002). AD patients show significant amyloid accumulation on PET imaging studies, with up to 90% of AD patients showing significant amyloid (Klunk et al., 2004; Villemagne et al., 2011a; He et al., 2015). This amyloid signal on PET is associated with cognitive performance, future decline, and the extent of amyloid plaques at autopsy (Ikonomovic et al., 2008; Doraiswamy et al., 2014). Longitudinal assessments of amyloid in AD patients have shown minimal increases in amyloid tracer signal in patients who showed significant amyloid burden at baseline, consistent with the concept that amyloid accumulation is typically an early finding in AD (Jack et al., 2009; Villemagne et al., 2011b). Finally, tau PET studies have shown significant NFT accumulation that highly mirrors the Braak and Braak staging (Braak et al., 1993). Significant tau PET tracer uptake is seen in the temporal, parietal, and frontal lobes, while the primary sensory/motor cortices are relatively spared (Chien et al., 2013;Johnson et al., 2016; Schwarz et al., 2016). Tau uptake in the inferior temporal lobe was associated with increased amyloid deposition, as well as greater cognitive impairment and disease severity (Johnson et al., 2016; Schwarz et al., 2016). Braak staging with tau PET images suggested that most AD participants who are amyloid positive are in stage VI, while the majority of amyloid negative AD patients were at Braak stage III or lower (Johnson et al., 2016; Schwarz et al., 2016). Tau PET also correlates with CSF levels of amyloid and tau across CN, MCI, and AD participants (Brier et al., 2016). Longitudinal tau PET observations are as yet uncommon, but one study shows an increase in tracer signal over 1–1.5 years of approximately 5% in the inferior temporal and fusiform gyri in mild AD and an increase of 5%–8.6% in tracer retention in the fusiform, parahippocampal, and inferior temporal gyri in moderate AD patients (Ishiki et al., 2015), while an alternative study showed no change in tau over 17 months (Chiotis et al., 2018).
Appropriate use criteria for molecular neuroimaging for cognitive decline in clinical settings
Neuroimaging tools can be used in clinical settings to improve diagnosis and patient care following a standard set of guidelines for their use. Recent documentation from the Neuroimaging Work Group of the Alzheimer’s Association (https://www.alz.org/national/documents/imaging_consensus_report.pdf), the European Federation of the Neurologic Societies task force (Filippi et al., 2012), and Appropriate Use Criteria (AUC) for amyloid imaging by the Amyloid Imaging Task Force, Society for Nuclear Medicine and Molecular Imaging, and the Alzheimer’s Association (Johnson et al., 2013a, b) have been published. The American Academy of Neurology (AAN) guidelines for diagnosis of dementia are undergoing revision at the time this chapter is being written but the current recommendation to use MRI to evaluate structural damage that may be causing cognitive symptoms or dementia, even in MCI stages, is unlikely to change. MRI can help differentiate among causes for cognitive symptoms and decline. Current MR technology is highly sensitive to cerebrovascular pathology, typically visualized on T2-weighted and FLAIR sequences, with hyperintensities reflecting white matter disease, with or without areas of infarction and microhemorrhage. This is distinguishable from a more typical primary AD pattern of prominent severe MTL atrophy and cortical thinning. Coronal MR imaging perpendicular to the hippocampus allows for assessment using a medial temporal atrophy (MTA) scale (Scheltens et al., 1992, 1997). A high MTA score helps to support a diagnosis of AD rather than a vascular or alternative neurodegenerative disease. [18F]FDG PET can be used in clinical settings for dementia care, but should only be used when the presentation or symptomatology of the case is atypical. In particular, [18F]FDG PET can be used to distinguish AD and FTD based on a profile of temporoparietal vs frontal hypometabolism, respectively. In cases with unclear presentation (FTD vs AD), [18F]FDG PET may be covered under Medicare following specific guidelines (see https://www.cms.gov/Regulations-and-Guidance/Guidance/Manuals/downloads/ncd103c1_Part4.pdf, Section 220.6.13). Amyloid PET imaging is not currently covered under Medicare. However, use of amyloid imaging may be considered under certain circumstances. An AUC document published in 2013 details the circumstances under which amyloid PET may be used in a diagnostic evaluation of AD or MCI, with patients meeting the following criteria: (1) cognitive complaints with objective impairment; (2) AD as a possible but uncertain diagnosis; (3) knowledge of the presence vs absence of amyloid expected to increase diagnostic certainty and improve disease management. Patients meeting these criteria would include those with dementia of an unclear nature due to an atypical course (e.g., sudden onset or episodic presentation) or the presence of comorbid conditions that could be causal for the symptomatology, as well as patients with an atypically young presentation (i.e., before age 65). In addition, patients with persistent MCI may be appropriate for amyloid imaging if the patient would benefit from the results of the study.
A few caveats must be considered when evaluating the use of amyloid PET and the interpretation of results. Amyloid positivity does not constitute a diagnosis of AD and many cognitively normal individuals will have significant amyloid deposition on an amyloid scan. Further, comorbid neurodegenerative pathologies are not excluded with a positive amyloid scan as these have low specificity, and positive scans have been reported in other dementias such as DLB and CAA. In sum, it has been proposed that amyloid imaging should be used in a clinical setting only if it will have a positive impact on patient care through: (1) changing the medication management, such as addition or discontinuation of acetylcholinesterase inhibitors or memantine; (2) changing the ordering of tests by reducing the number of additional tests following a positive scan, OR suggesting additional testing in the case of a negative amyloid scan; (3) improving patient care through the “value of knowing” by increasing physician confidence in the diagnosis and allowing for better planning for patients and caregivers for future medial, social, or financial challenges. An update to these AUC described the importance of extensive detailed documentation and provided a checklist for suggested items to document (Johnson et al., 2013b). The AUC proposal also detailed situations that are inappropriate for amyloid imaging use, including: (1) in patients with a core clinical criteria of probable AD with a typical age of onset (≥65 years); (2) to determine disease severity; (3) in cognitively normal individuals based solely on family history of AD or APOE ϵ4 genotype; (4) in patients with SCD and no objective impairment; (5) in any non-symptomatic individual; (5) in suspected familial cases in lieu of genotyping; (6) for nonmedical use (legal, competency hearings, insurance coverage, or employment screening). In sum, the use of neuroimaging in clinical settings may improve diagnostic certainty and patient care but careful consideration must be employed given the potential for false positives. Finally, as detailed earlier, at this writing Medicare reimbursement is still pending a trial of amyloid PET imaging for clinical evidence development and does not reimburse the costs of the scan.
AUC for neuroimaging in clinical trials for AD
Imaging biomarkers are often considered for use in clinical trials for multiple reasons (https://www.alz.org/national/documents/imaging_consensus_report.pdf). Imaging measures may be used in defining the target population for treatment through screening for a particular pathology (e.g., amyloid positivity) or for enrichment of a sample that will likely rapidly decline (e.g., MCI/AD with significant hippocampal atrophy). Further, neuroimaging tools may be used to exclude those with pathology other than AD (e.g., amyloid negative with significant vascular pathology). Another use for neuroimaging would be as measures to determine target engagement, monitoring treatment efficacy, and potentially as a treatment outcome measure. MRI measures would be useful to characterize a diagnosed dementia and to rule out other causes. At a minimum, FLAIR or T2-weighted images should be used to assess vascular burden and a 3D T1-weighted scan should be used to assess global and local atrophy. For the latter, standardized metrics of global loss and/or MTL atrophy could be utilized (Scheltens et al., 1992, 1997). MRI scans can also be used as outcome measures for treatments that are targeted to slow down progression of neurodegeneration (volume). A consensus report from the Neuroimaging Work Group of the Alzheimer’s Association generated recommendations for the use of neuroimaging in clinical trials (https://www.alz.org/national/documents/imaging_consensus_report.pdf). MRI is recommended in all clinical trials seeking to establish AD as the pathologic substrate for therapy. MRI should be used to exclude nondegenerative causes of dementia, to exclude those where cerebrovascular disease is the likely cause of the dementia, or to exclude degenerative diseases other than AD. MRI should be considered as an outcome measure if the therapy is considered nonspecific and approval is being sought for nonspecific indications such as “dementia.” As an outcome, rates of atrophy from target regions of interest (ROIs) can be used to measure progression of disease, including MTL atrophy with either automated or manually defined ROIs (Jack et al., 1992; Laakso et al., 1995), global atrophy using registration-based methods (Fox et al., 2000; Chan et al., 2001), and/or measures of ventricular enlargement (Fox et al., 2000). Finally, MRI measures are likely to provide information about disease-modifying effects of a treatment, therefore potentially meeting FDA standards for an “effect on a surrogate endpoint.” Thus, the consensus report encourages MRI measures as an ancillary endpoint measure in Phase III trials for AD treatment agents. [18F]FDG PET could also be used as an ancillary outcome (surrogate endpoint) in clinical trials of potential AD therapeutics. Quantitative assessment via statistical parametric maps or ROI analysis can help to determine the effect of a putative treatment. Overall, neuroimaging measures are encouraged in all clinical trials and future studies should consider incorporating neuroimaging at all steps of the trial, from screening and enrollment to target monitoring to determine efficacy on an endpoint.
Nonfamilial early onset AD
The majority of AD patients have onset of dementia after age 65 (late-onset AD; LOAD). However, some patients present with symptoms before the age of 65 that are not caused by a known gene mutation (see section Familial AD for discussion of patients with a gene mutation). Nonfamilial early onset AD patients frequently have atypical symptoms at onset, including primary impairments in language, visuospatial processing, or executive function (Smits et al., 2012), and decline more rapidly than in LOAD (Cho et al., 2013a). Often these patients show more severe cortical atrophy and relatively less MTL atrophy on sMRI measures, and thus have been termed “hippocampal sparing” AD in contrast to the “limbic predominant” AD that represents the primary presentation for LOAD and is reflective of the prominent recent memory loss in these cases (Frisoni et al., 2007; Murray et al., 2011; Whitwell et al., 2012). These early onset patients may also show more severe atrophy and faster degeneration in other subcortical structures than LOAD, including the amyloid, thalamus, caudate, and putamen (Pievani et al., 2013; Cho et al., 2013b). However, other studies show a more LOAD-like pattern of atrophy in early-onset AD, with medial and lateral temporal lobe and medial parietal lobe atrophy, but to a greater extent than LOAD (Ossenkoppele et al., 2015a). Nonamnestic AD presentations, including dysexecutive AD, also show cortical thinning in temporoparietal regions, superior parietal lobe, and superior frontal lobe (Dickerson et al., 2011; Ossenkoppele et al., 2015b). In resting-state fMRI studies, dysexecutive AD patients show reduced DMN connectivity (similar to LOAD), as well as decreased connectivity in a dorsolateral prefrontal network and an executive control network and increased connectivity in an anterior temporal network (Gour et al., 2014; Lehmann et al., 2015). Although no significant difference in overall amyloid deposition was observed between typical amnestic presentations and executive presentations of AD (Laforce et al., 2014) or between early-onset AD and LOAD, some regional changes were observed with increased amyloid in the basal ganglia, thalamus, temporal lobe, and cuneus in early-onset AD relative to LOAD (Cho et al., 2013c). In a recent tau PET study, early-onset AD had greater tau deposition than LOAD in cortical areas such as the prefrontal cortex, temporal lobe, premotor cortex, and inferior parietal lobe (Scholl et al., 2017) and tended to show a more cortical rather than medial temporal pattern of tau deposition (Whitwell et al., 2018). Further, a number of studies have suggested that in typical and atypical AD, the pattern of tau deposition mirrors regions with atrophy and glucose hypometabolism and was related to the cognitive symptomatology (e.g., left anterior temporal lobe linked to language impairment, right lingual gyrus linked to visuospatial impairment, frontal/parietal pattern linked to dysexecutive syndrome, memory linked to anterior hippocampus and fusiform) (Ossenkoppele et al., 2016; Phillips et al., 2018). Future studies will continue to explore the biologic basis for the differences between the typical amnestic LOAD patients relative to the nonamnestic and early onset AD patients.
Familial AD
Symptomatic carriers of mutations causing familial/autosomal dominant AD (sFAD) show abnormalities on both MRI and PET. Structural MRI studies have shown GM atrophy in the MTL, thalamus, putamen, temporal lobe, precuneus, inferior parietal, and cingulate, as well as WM atrophy in the cingulum and fornix, relative to noncarriers, with greater frontotemporal atrophy in FAD relative to sporadic AD (Apostolova et al., 2011; Cash et al., 2013). sFAD patients also have faster rates of MTL atrophy than sporadic AD cases (Fox et al., 1996; Ridha et al., 2006). sFAD also show significantly greater WMH than noncarriers throughout the brain but most prominently in the parietal and occipital lobes (Lee et al., 2016). Task-based fMRI studies of sFAD patients show reduced activation in relevant regions during a visual task and an episodic memory task (Sala-Llonch et al., 2013; Risacher et al., 2014). A resting-state study showed decreased DMN connectivity in the precuneus, posterior cingulate, and parietal lobe in sFAD (Chhatwal et al., 2013). Further, reduced complexity and synchronicity of rsfMRI functional connectivity, particularly in the right precuneus, lateral parietal lobe, paracentral gyrus, and left precentral gyrus were seen in sFAD (Liu et al., 2013). [18F] FDG PET studies of patients with FAD showed decreased glucose metabolism relative to both aMC and noncarriers (Kennedy et al., 1995). Amyloid PET studies show significant tracer binding in the anterior and posterior cingulate, precuneus, and parietotemporal and frontal gray matter, as well as the basal ganglia, which was not different by mutation type (Klunk et al., 2007; Villemagne et al., 2009). The basal ganglia signal was noted to be stronger than the cortical binding in some studies but not in others, which may be tracer dependent (Klunk et al., 2007; Villemagne et al., 2009). Amyloid in sFAD was also associated with impaired cognitive performance and future decline in global cognition and working memory (Wang et al., 2015a). An initial case-study of a symptomatic PS1 mutation carrier with concurrent [18F]FDG, amyloid, and tau PET scans showed significant amyloid uptake and tau deposition in the posterior cingulate, precuneus, parietal and occipital cortices, which was greater than in sporadic AD and was associated with global hypometabolism (Smith et al., 2016b). Finally, a recent study in DIAN patients who were mildly impaired showed a pattern of tau deposition similar to mildly impaired LOAD patients, but with more tau ligand retention in the frontal and parietal lobes (Benzinger et al., 2016).
Atypical Alzheimer’s disease
Other atypical presentations of AD, including PCA, logopenic aphasia, and CAA, have also been characterized with imaging. These diseases show amyloid plaque deposition and NFT supporting these disorders as AD dementias despite their atypical clinical presentation.
Posterior cortical atrophy
PCA causes significant visual dysfunction in the absence of ocular disease, as well as constructional apraxia, visual field deficits, and environmental disorientation (Andrade et al., 2012; McGinnis, 2012). Structural MRI scans show atrophy in the occipital lobe, visual association areas, posterior parietal and temporal lobes, and medial parietal lobe (Koedam et al., 2011; Ossenkoppele et al., 2015c) (Fig. 12.3A). A visual rating scale can also be used to quantify the extent of posterior atrophy (Koedam et al., 2011; Moller et al., 2014). Although less significant than that seen in AD, the MTL also shows atrophy in PCA, including hippocampal atrophy particularly in the tail of the hippocampus (Manning et al., 2015; Wang et al., 2015c). Patients with PCA also show fewer cerebral microhemorrhages than in typical AD (Whitwell et al., 2015b). DTI studies show reduced WM integrity in the ventral visual processing stream, including the inferior longitudinal fasciculus and inferior fronto-occipital fasciculus, as well as in the posterior thalamic radiations, superior longitudinal fasciculus, posterior cingulum, splenium of the corpus callosum, and fornix (Madhavan et al., 2015). Task-based fMRI studies show notable changes during visual tasks, including reduced activity in the right posterior inferior temporal cortex during 3D shape processing (Gillebert et al., 2015), impaired activity in dorsal visual regions during motion and Gestalt perception, and reduced representation of the peripheral visual field (Shames et al., 2015). rsfMRI techniques show reduced functional connectivity in the ventral visual network but high connectivity in inferior portions of the dorsal visual network in PCA patients, the latter of which was associated with greater occipital atrophy (Migliaccio et al., 2016). Reduced connectivity in the DMN was observed in one study (Lehmann et al., 2013) but not in a second report (Migliaccio et al., 2016).
Fig. 12.3.
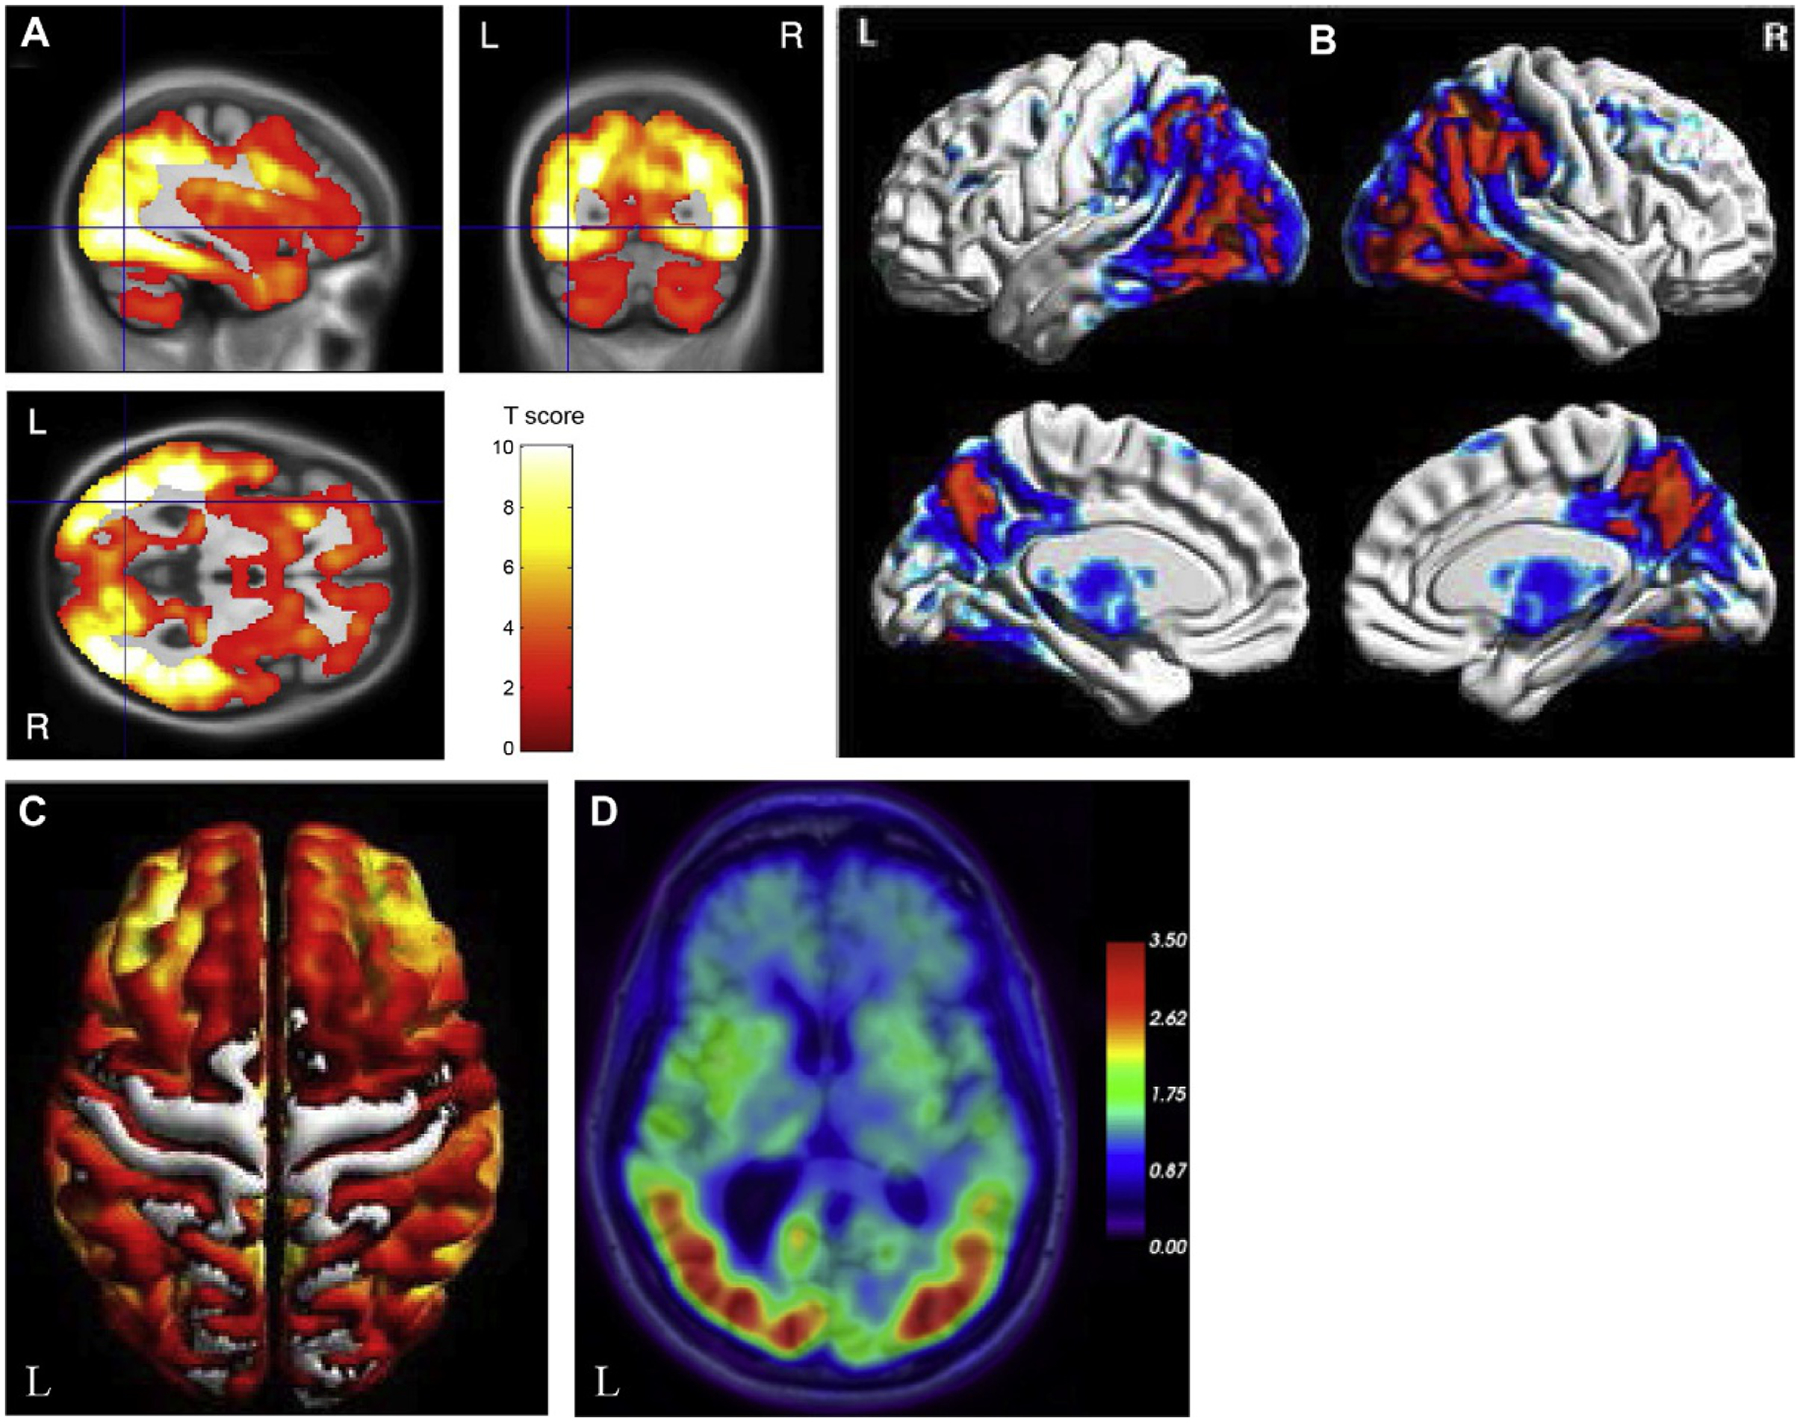
Neuroimaging in posterior cortical atrophy (PCA). (A) Patients with posterior cortical atrophy (PCA) show reduced gray matter in the posterior regions of the brain, including the occipital and parietal lobes relative to cognitively normal older adults. (B) PCA patients also show reduced glucose metabolism in lateral and medial posterior regions relative to cognitively normal older adults. (C) PCA patients show a similar widespread cortical distribution of amyloid deposition on PET as seen in Alzheimer’s disease patients. (D) PCA patients show significant tau deposition in posterior cortical regions, including in the occipital and parietal lobes relative to cognitively normal older adults. L, left; R, right. Panel (A): adapted with permission from Lehmann, M., Crutch, S.J., Ridgway, G.R., et al., 2011. Cortical thickness and voxel-based morphometry in posterior cortical atrophy and typical Alzheimer’s disease. Neurobiol Aging 32, 1466–1476; Panel (B): adapted from Singh, T.D., Josephs, K.A., Machulda, M.M., et al., 2015. Clinical, FDG and amyloid PET imaging in posterior cortical atrophy. J Neurol 262, 1483–1492 with permission through the Creative Commons Attribution 4.0 International License (http://creativecommons.org/licenses/by/4.0/); Panel (C): adapted from Singh, T.D., Josephs, K.A., Machulda, M.M., et al., 2015. Clinical, FDG and amyloid PET imaging in posterior cortical atrophy. J Neurol 262, 1483–1492 with permission through the Creative Commons Attribution 4.0 International License (http://creativecommons.org/licenses/by/4.0/); Panel (D): adapted with permission from Xia, C. and Dickerson, B.C., 2017. Multimodal PET imaging of amyloid and tau pathology in Alzheimer disease and non-Alzheimer disease dementias. PET Clin 12, 351–359.
Studies with [18F]FDG PET have demonstrated greater hypometabolism in temporo-parieto-occipital and occipital lobe regions than seen in typical AD (Ossenkoppele et al., 2015c, 2016) (Fig. 12.3B). Hypometabolism in lateral and medial parietal lobe and frontal eye fields is also seen in PCA (Nestor et al., 2003a). PCA patients show significant amyloid deposition on PET that is similar in distribution and severity to AD with the exception of greater occipital lobe uptake (Ossenkoppele et al., 2015c, 2016) (Fig. 12.3C). Initial tau PET observations reported increased tau in the posterior regions of the brain, including in the primary visual cortex, medial and lateral parietal lobe, occipital lobe, and the posterior temporal lobe (i.e., temporo-parieto-occipital regions) in patients with PCA, which overlap with regions showing glucose hypometabolism (Ossenkoppele et al., 2015c, 2016; Dronse et al., 2017; Xia and Dickerson, 2017) (Fig. 12.3D).
Logopenic aphasia
Logopenic aphasia is a type of primary progressive aphasia (PPA) associated with amyloid rather than FTD-like pathology. Logopenic aphasia features include impaired word retrieval and sentence repetition, in the absence of motor speech or grammatical abnormalities (Rohrer, 2012). Patients with logopenic aphasia primarily show atrophy of the temporoparietal region of the language-dominant hemisphere (usually the left hemisphere), with less but still observable atrophy in the contralateral hemisphere and medial parietal lobe (Rabinovici et al., 2008; Madhavan et al., 2013; Ossenkoppele et al., 2016) (Fig. 12.4B). Atrophy is also seen in the left posterior superior temporal lobe, inferior parietal lobe, posterior cingulate, precuneus, and MTL in logopenic aphasia patients. In more severe patients, atrophy is also observed in left anterior temporal lobe regions, along the Sylvian fissure, and into the frontal lobe, as well as in regions of the right temporal and parietal lobes (Madhavan et al., 2013). Amyloid positive logopenic aphasia patients show greater atrophy in the right temporoparietal and frontal lobes than amyloid negative patients, while amyloid negative patients show more anteromedial temporal and medial prefrontal atrophy (Whitwell et al., 2015a). Longitudinal studies have shown progressive atrophy in the lateral and posterior temporal lobe and medial parietal lobe that is associated with decline in cognition (Brambati et al., 2015). Diagnostic criteria for logopenic aphasia include atrophy of the temporoparietal junction (angular gyrus, posterior temporal lobe, supramarginal gyrus) (Gorno-Tempini et al., 2011). Specific mutations causing logopenic aphasia, including the chromosome 9 open reading frame 72 (C9ORF72) and progranulin (GRN) genes, also show atrophy in the left cortex and anteromedial temporal lobe, respectively (Josephs et al., 2014; Saint-Aubert et al., 2014).
Fig. 12.4.
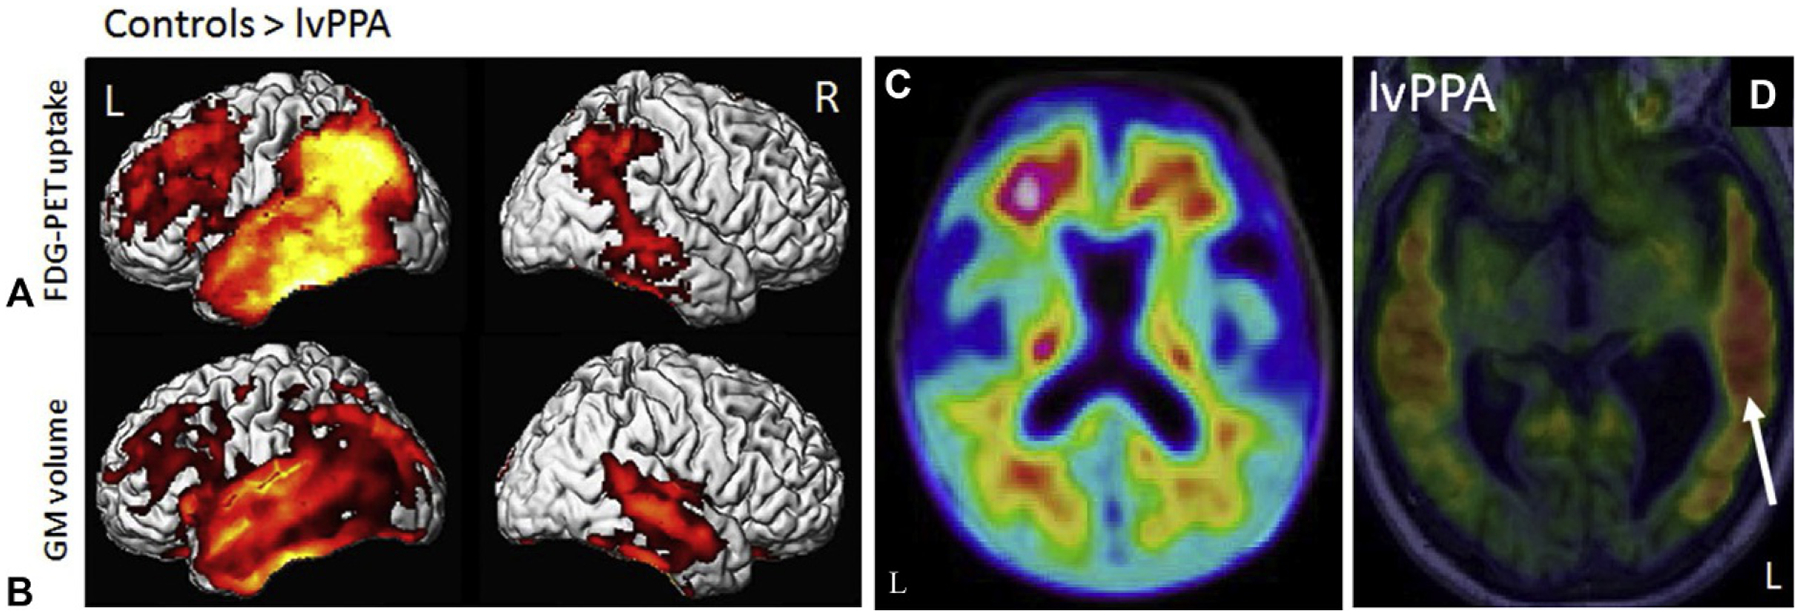
Neuroimaging in logopenic aphasia patients. Logopenic variant primary progressive aphasia (lvPPA) patients show reduced glucose metabolism (A) and gray matter atrophy (B) relative to cognitively normal older adults (controls) in the lateral temporal, temporoparietal, and frontal lobes (left > right). (C) Patients with lvPPA also show amyloid positivity on PET. (D) Tau deposition is also observed in lvPPA patients, with greater tau seen in the lateral temporal lobes (left > right, white arrow). FDG=fluorodeoxyglucose; GM=gray matter; L=left; PET=positron emission tomography; R=right. Panel (B): Adapted from Madhavan, A., Whitwell, J.L., Weigand, S.D., et al., 2013. FDG PET and MRI in logopenic primary progressive aphasia versus dementia of the Alzheimer’s type. PLoS One 8, e62471 with permission through the Creative Commons Attribution 4.0 International License (http://creativecommons.org/licenses/by/4.0/); Panel (C): adapted from Kuo, H.C., Hsiao, I.T., Hsieh, C.J., et al., 2017. Dual-phase (18)F-florbetapir positron emission tomography in patients with primary progressive aphasia, Alzheimer’s disease, and healthy controls: a preliminary study. J Formos Med Assoc 116, 964–972 with permission through the Creative Commons Attribution 4.0 International License (https://creativecommons.org/licenses/by-nc-nd/4.0/); Panel (D): adapted with permission from Whitwell, J.L., Josephs, K.A., Tosakulwong, N., et al., 2016. AV-1451 Tau-PET binding in typical and atypical syndromic variants of Alzheimer’s disease. Alzheimers Dement 12, P145.
Studies with DTI in logopenic aphasia show reduced WM integrity in widespread regions, including in the anterior and posterior cingulum, corona radiate, corpus callosum, inferior and superior longitudinal fasciculi, inferior fronto-occipital fasciculus, anterior temporal WM, orbitofrontal and dorsolateral WM, inferior parietal WM, left external capsule, and left uncinate fasciculus (Agosta et al., 2012b; Madhavan et al., 2015). Task-based fMRI in logopenic aphasia patients showed reduced dorsolateral prefrontal cortex activity during naming, which improved after behavioral language training (Beeson et al., 2011). Resting-state fMRI also shows alterations in connectivity of the language network, in particular in left temporal, inferior parietal, and prefrontal regions (Whitwell et al., 2015a).
PET studies with [18F]FDG show hypometabolism in left temporoparietal regions in sporadic and familial logopenic aphasia (Rabinovici et al., 2008; Saint-Aubert et al., 2014) (Fig. 12.4A). Compared to AD patients, patients with logopenic aphasia show more lateral temporal hypometabolism but higher metabolism in the medial temporal lobe and posterior cingulate (Josephs et al., 2014). Amyloid negative logopenic aphasia patients show asymmetrical hypometabolism in left temporoparietal, anterior temporal, and frontal regions (Whitwell et al., 2015a). Studies with amyloid tracers have shown increased amyloid deposition in both sporadic and C9ORF72 patients with logopenic aphasia (Rabinovici et al., 2008; Saint-Aubert et al., 2014) (Fig. 12.4C). However, not all individuals with logopenic aphasia are amyloid positive (Josephs et al., 2014), and higher amyloid in these patients is associated with greater cognitive impairment (Whitwell et al., 2013). Limited tau PET observations have shown asymmetric tau deposition, left greater than right in the majority of patients, in temporoparietal, occipital, and anterior temporal lobe regions, with more severely affected patients showing more uptake in anterior temporal regions than less affected individuals (Fig. 12.4D) (Ossenkoppele et al., 2016; Dronse et al., 2017).
Cerebral amyloid angiopathy
CAA often presents with a symptomatic, spontaneous local hemorrhage that causes either a focal neurologic deficit, headache, or impairment in consciousness (Gahr et al., 2013) and is associated with amyloid pathology largely in the walls of small cerebral arteries and capillaries (Viswanathan and Greenberg, 2011). CAA patients show significant vascular abnormalities on MRI. Specifically, microhemorrhages and cortical superficial siderosis (cSS) are often detected using T2*-weighted MRI techniques (Viswanathan and Greenberg, 2011). Acute or subacute cortical and subcortical infarcts can also be seen using DWI, and often multiple large cortical spots are seen (Kimberly et al., 2009; Brundel et al., 2012; Charidimou et al., 2016). Patients with CAA show significantly more WMH, particularly in posterior regions, than either controls or AD/MCI patients (Holland et al., 2008). Further, CAA patients show longitudinal increases in WMH (Chen et al., 2006). Enlarged perivascular spaces in the centrum semiovale are also seen in CAA patients (Charidimou et al., 2013). On fMRI studies, patients with CAA show impaired vascular reactivity to visual stimuli or other tasks (Dumas et al., 2012; Peca et al., 2013). Interestingly, AD patients with microhemorrhages (suggesting some CAA pathology) have more cerebral atrophy and reduced metabolism in the temporal lobe (Samuraki et al., 2015). PET shows increased amyloid in CAA, particularly in the occipital lobe, but is unable to resolve intravascular from parenchymal amyloid. Of clinical significance, a negative amyloid scan rules out a diagnosis of CAA (Baron et al., 2014). Microhemorrhages are associated with the locations of amyloid deposition on PET with new lesions occurring primarily at sites of high amyloid retention (Dierksen et al., 2010; Gurol et al., 2012). Finally, an initial tau PET study suggested that regions with microbleeds and cSS show increased tau deposition in patients with CAA (Kim et al., 2017).
Neuroimaging changes in late-onset and atypical AD syndromes provide an important window into the ongoing proteinopathy, neuronal dysfunction, and neurodegeneration occurring in these conditions. The overlapping but distinct patterns of atrophy and hypometabolism, as well as the information provided by amyloid and tau PET, are useful for enhanced etiologic differential diagnosis between these disorders. Future studies with additional tracers for other proteinopathies, and longitudinal follow-up of preclinical patients will inform our understanding of disease onset and provide a better understanding of the typical and atypical AD related disorders. Further, significant knowledge and potentially the establishment of an effective treatment may come from use of neuroimaging in drug trials, including such studies as the Anti-Amyloid Treatment in Asymptomatic Alzheimer’s Disease (A4) Trial in asymptomatic older adults with amyloid deposition, the DIAN Trials Unit in asymptomatic FAD mutation carriers, and the Alzheimer’s Prevention Unit APOE4 and Autosomal Dominant Alzheimer’s Disease (ADAD) trials in APOE ϵ4 homozygotes and FAD mutation carriers, respectively. The large and recently completed Imaging Dementia-Evidence for Amyloid Scanning (IDEAS) trial is likely to clarify the efficacy of amyloid PET for improving patient care and outcomes in clinical diagnostic settings. Neuroimaging is playing an important role in many different facets of the development process for future disease modifying treatments for neurodegenerative disorders. For example, it is now common to use amyloid PET scan screening to admit subjects to an anti-amyloid medication trial.
VASCULAR COGNITIVE IMPAIRMENT AND DEMENTIA
VCI and vascular dementia encompass a variety of disorders caused by pathology in the cerebrovascular system, including multiinfarct dementia, strategic infarctions dementia, hemorrhagic dementia, mixed dementia, subcortical ischemic vascular dementia (SIVD), and genetic forms of VCI such as cerebral autosomal dominant arteriopathy with subcortical infarcts and leukoencephalopathy (CADASIL) (Chui, 2007; Park et al., 2013). Among the many subtypes of VCI, the most common is SIVD, which commonly occurs secondary to vascular risk factors like hypertension, diabetes, hyperlipidemia, sleep apnea, and obesity. Cognitive changes in large-vessel strokes are dependent on stroke location and can vary widely. Clinical presentation of SIVD or Binswanger’s disease (BD), which is a severe, progressive form of SIVD, includes cognitive changes most often in executive function. However, other cognitive domains can also be affected, including motor changes with gait disturbances, apathy, depression, incontinence, and, in later stages, pseudobulbar findings.
The most distinct finding on structural MRI studies of patients with SIVD are WMHs throughout the brain, as best imaged with T2-weighted or Fluid Attenuated Inversion Recovery (FLAIR) imaging. Small subcortical infarcts, lacunes, and prominent perivascular spaces are frequent and prominent (Doubal et al., 2010; Rosenberg, 2016). Cerebral microhemorrhages are associated with amyloid, such as those seen in CAA (as discussed earlier) and are generally cortical or subcortical, while those associated with hypertension and cardiovascular risk factors are more centrally localized (Yamada et al., 2012). The observed WMH are more common than those seen in normal aging or AD (Fein et al., 2000; Mungas et al., 2001; Du et al., 2002; Jagust et al., 2008; Eckerstrom et al., 2011; Scher et al., 2011) and are associated with impairment in executive function, executive control, functional decline, and psychomotor speed (Mungas et al., 2001; Verdelho et al., 2010). Brain atrophy is also observed globally in GM and WM, including in the hippocampus, and is correlated with the WMH burden (Mungas et al., 2001; Eckerstrom et al., 2011).
Even in “normal appearing WM,” DTI studies have demonstrated significant degeneration of WM in patients with SIVD, which is associated with dementia severity, cognition, motor symptoms, and cerebral atrophy (Kim et al., 2011). Decreased WM integrity is found in projection fibers (areas of the internal capsule, corona radiata, posterior thalamic radiations), association fibers (sagittal stratum, external capsule, cingulum, fornix, stria terminals, superior longitudinal fasciculus, superior fronto-occipital fasciculus, and uncinate fasciculus), and in the corpus callosum (Chen et al., 2009). Task-based fMRI studies in SIVD show reduced activation in the frontal cortex during an executive function task and altered blood flow–metabolic coupling during a motor task (Li et al., 2011; Tak et al., 2011). rsfMRI studies have shown reduced connectivity of the posterior cingulate, precuneus, angular gyrus, left middle temporal gyrus, anterior and middle cingulate, right superior parietal lobule, bilateral middle frontal gyrus, right caudate, left medial frontal/paracentral lobule, and cerebellum (Li et al., 2014; Liu et al., 2014). Increased connectivity is also observed in SIVD, specifically in the anterior cingulate, right putamen, right supplementary motor area, hippocampus, right inferior temporal gyrus, left middle temporal gyrus, left precentral gyrus, left superior parietal lobule, cerebellum, and left insula, which is associated with cognitive impairment (Li et al., 2014; Liu et al., 2014).
Multifocal hypometabolism is often observed in SIVD with an asymmetric, scattered pattern in cortical and subcortical regions, near arteries, or in watershed regions of the brain (Kerrouche et al., 2006; Heiss and Zimmermann-Meinzingen, 2012). The sensorimotor cortex shows more pronounced hypometabolism in SIVD than seen in AD patients, while less hypometabolism is seen in association areas (Heiss and Zimmermann-Meinzingen, 2012). Multiinfarct dementia may show focal, asymmetrical hypometabolism (Duara et al., 1989). Finally, amyloid PET studies have generally shown minimal tracer uptake in SIVD in the absence of CAA (Yoon et al., 2013).
To date neuroimaging studies in VCI have shown atrophy, dysfunctional brain activity, and hypometabolism. However, prospective studies are warranted in evaluating patients at earlier stages of the disease to identify the progressive changes associated with the development of cognitive decline, as well as the effect of any interventional treatments (e.g., antihypertensives). Studies of patients with concurrent vascular pathology and other types of comorbid pathology (AD, FTD, etc.), the so-called mixed dementia patients, are also needed to assess the overlap of multiple diseases and the relative contribution of comorbid pathologies to cognitive decline.
FRONTOTEMPORAL DEMENTIA
FTD is an over-arching diagnosis that encompasses multiple disorders with varying symptoms, including behavioral variant FTD (bvFTD) and two forms of PPA, semantic dementia (SD), and progressive nonfluent aphasia (PNFA). FTD patients may also show motor system dysfunction, which is then classified as FTD with motor neuron disease (FTD-MND). bvFTD is characterized by changes in personality and behavior, disinhibition, apathy, loss of empathy, obsessive–compulsive behaviors, and changes in appetite. This disorder is most commonly associated with the accumulation of pathologic tau (Pick’s disease), but can be linked to the accumulation of TDP-43, a TAR DNA-binding protein (Whitwell and Josephs, 2011; Rohrer, 2012). SD features deficits in fluency and single word comprehension, aphasia, and later in the disease course, behavioral symptoms similar to bvFTD. SD is usually associated with TDP-43 accumulation but in rare cases may reflect tau pathology associated with Pick’s disease (Whitwell and Josephs, 2011; Rohrer, 2012). PNFA features speech production difficulties with agrammatism and apraxia of speech, as well as phonemic errors, anomia, and impaired sentence comprehension. PNFA is usually associated with tau pathology, although mutations in GRN gene resulting in TDP-43 pathology can cause PNFA symptoms but without apraxia of speech (Whitwell and Josephs, 2011; Rohrer, 2012). FTD-MND can be due to pathologic tau, such as in the Parkinson’s like FTD dementias—corticobasal degeneration (CBD) and progressive supranuclear palsy (PSP)—or TDP-43 pathology, which is present as FTD-MND with Lewy body-like pathology or FTD associated with amyotrophic lateral sclerosis (ALS) (FTD-ALS) (Whitwell and Josephs, 2011; Rohrer, 2012). Clinically, the Parkinson’s-like FTD dementias (CBD and PSP) can show either behavioral-type FTD symptoms (i.e., bvFTD) or language-type FTD symptoms (most commonly PFNA) in the presence of cortical and extrapyramidal motor dysfunction (Rohrer, 2012). CBD patients show cognitive disturbances, including changes in executive function, visuospatial function, and aphasia, and behavioral changes (such as in bvFTD) along with marked apraxia, akinesia, extreme rigidity, focal myoclonus, dystonia, and alien limb syndrome (Broski et al., 2014). PSP presents with asymmetric bradykinesia, rigidity, postural instability, pseudobulbar syndrome with dysarthria and dysphagia, and supranuclear palsy of vertical gaze, as well as cognitive changes (Brown et al., 2010; Broski et al., 2014). Patients with FTD-MND and FTD-ALS present with the motor symptoms associated with MND/ALS, including hyperreflexia, spasticity, progressive muscle weakness, progressive muscle wasting, and respiratory failure, as well as usually bvFTD symptoms but in rare cases SD or PNFA (Ferrari et al., 2011).
Behavioral variant FTD
Patients with bvFTD show marked frontal and temporal lobe atrophy (Schroeter et al., 2008; Whitwell et al., 2009; Pan et al., 2012), with a recent meta-analysis showing atrophy in FTD in the medial–frontal cortex, basal ganglia, anterior insula, and thalamus (Schroeter et al., 2014), and other studies showing additional atrophy in the anterior cingulate, orbitofrontal cortex, and deep gray matter structures (Hornberger et al., 2010; Rohrer, 2012; Moller et al., 2015). However, bvFTD can also present with little or no apparent atrophy (Koedam et al., 2010). Longitudinally, patients with FTD show an increased atrophy rate in the frontal lobes (Krueger et al., 2010). The atrophy pattern observed in bvFTD can vary by underlying pathology; bvFTD patients with TDP-43 pathology show frontal, temporal, and parietal atrophy, which tends to be asymmetric but either side can be predominant (Whitwell et al., 2010c; Whitwell and Josephs, 2011). Parietal atrophy may be greater in patients with TDP-43 bvFTD variants than the cases associated with tau (Whitwell and Josephs, 2011). bvFTD due to Pick’s disease shows prefrontal cortex, temporal lobe, anterior cingulate, and insular atrophy, which is typically bilateral but with slightly greater degeneration on the left than on the right (Whitwell and Josephs, 2011; Whitwell et al., 2011b). The frontal atrophy in Pick’s disease bvFTD patients is usually greater than seen in other forms, such as CBD patients with microtubule associated protein tau (MAPT) mutations and those with underlying TDP-43 pathology (Whitwell et al., 2005; Whitwell and Josephs, 2011). Hereditary bvFTD patients, including those with C9ORF72, GRN, MAPT, and Fused in Sarcoma (FUS) mutations, show similar patterns of frontal and temporal lobe atrophy. Specifically, C9ORF72 patients show symmetric atrophy of frontal regions that extend to other lobes and cerebellar atrophy. GRN patients show temporoparietal and inferior frontal atrophy that is more asymmetric than manifested in bvFTD patients with TDP-43 pathology without a GRN mutation (Rohrer et al., 2011). MAPT patients show anteromedial temporal lobe, hippocampal, parietal, basal ganglia, brain stem, insular, and orbitofrontal cortex atrophy (Whitwell and Josephs, 2011; Deters et al., 2014) and may show more temporal lobe atrophy than other forms of bvFTD (Rohrer, 2012; Deters et al., 2014). Finally, bvFTD patients with underlying FUS pathology, who often have concurrent motor symptoms, show a unique pattern of severe caudate atrophy, along with frontal atrophy similar to that seen in the other bvFTD forms (Whitwell and Josephs, 2011).
DTI studies in bvFTD show reduced WM integrity in the salience network, a set of interconnected regions involved in filtering sensory and emotional stimuli and directed attention that include the anterior cingulate and bilateral insula, as well as tracts connecting the frontal and temporal lobes (Zhang et al., 2011; Agosta et al., 2012b). Tracts affected include the anterior superior longitudinal fasciculus, inferior longitudinal fasciculus, inferior fronto-occipital fasciculus, uncinate fasciculus, anterior cingulum, and parts of the corpus callosum. bvFTD patients have greater frontal WM changes than those seen in AD, including in the anterior cingulum, anterior corpus callosum, and uncinate fasciculus (Whitwell et al., 2010a; Ebmeier et al., 2011). Patients with MAPT and GRN mutations also have reduced WM integrity on DTI (Dopper et al., 2013). Longitudinally, bvFTD patients show decline in the right paracallosal cingulum, while MAPT carriers show longitudinal changes in the left uncinate fasciculus (Mahoney et al., 2015). fMRI studies during cognitive tasks have shown attenuated frontal activation during working memory relative to AD patients (Rombouts et al., 2003), as well as abnormalities during facial expression identification tasks (Virani et al., 2013). Resting-state fMRI studies in bvFTD demonstrate significantly reduced salience network connectivity in these patients, which is predictive of worsening behavioral symptoms and is correlated with both clinical dementia ratings and behavioral test scores (Whitwell et al., 2011c; Farb et al., 2013; Filippi et al., 2013). Changes in DMN connectivity have also been reported, although conflicting reports of increased connectivity (Farb et al., 2013), decreased connectivity (Filippi et al., 2013), or mixed changes (Whitwell et al., 2011c) have been reported. bvFTD patients also show disrupted internetwork connectivity (Filippi et al., 2013) and a lack of cortical hubs in the frontal cortex (Agosta et al., 2013) on rsfMRI. Reduced connectivity in the anterior middle cingulate was observed in GRN bvFTD patients, while MAPT patients showed minimal change in connectivity (Dopper et al., 2013). However, another study showed alterations in DMN connectivity in MAPT patients, with increased connectivity in the medial parietal lobe and reduced connectivity in the lateral temporal and medial prefrontal cortices (Whitwell et al., 2011c).
[18F]FDG PET studies have demonstrated symmetric frontal hypometabolism, even in the absence of visually apparent atrophy on MRI, which later spreads to the anterior cingulate, parietal lobe, and temporal lobe (Diehl et al., 2004; Foster et al., 2007). The presence of frontal lobe hypometabolism, in particular, increases the diagnostic accuracy of bvFTD vs AD (Foster et al., 2007). Hypometabolism in the basal ganglia, insula, and thalamus have also been reported (Rabinovici et al., 2011; Schroeter et al., 2014). bvFTD patients are generally amyloid negative on PET, which can help to differentiate bvFTD from AD (Rabinovici et al., 2011; Villemagne et al., 2011a), but concurrent amyloid and FTD-related pathologies can occur (Serrano et al., 2014). Recent tau-PET studies have shown increased tau binding in frontal and temporal cortices in bvFTD associated with MAPT mutations, which correlates with atrophy and varies by tau isoform (3R vs 4R) (Smith et al., 2016a; Jones et al., 2018).
Semantic dementia
On structural MRI, SD patients show atrophy of the anterior and inferior temporal lobe, with an asymmetric left > right pattern (Rohrer et al., 2009) (Fig. 12.5A). A meta-analysis showed that patients with SD show atrophy in the left subcallosal area, left anterior superior temporal sulcus, middle temporal gyrus, amygdala, and the inferior part of the temporal poles (Schroeter et al., 2007). Other studies have shown atrophy in the perirhinal cortex, fusiform, hippocampus, and amygdala (Mummery et al., 2000). In more severe SD patients, atrophy of the left superior and posterior temporal lobe, left frontal lobe, left insula, left anterior cingulate, and right temporal lobe are observed (Rohrer et al., 2009; Rohrer et al., 2012). Longitudinally, SD patients show a high rate of progressive atrophy of the left temporal lobe (greater than the right temporal lobe), which is two-times greater than that of AD patients (Krueger et al., 2010; Rohrer et al., 2012).
Fig. 12.5.
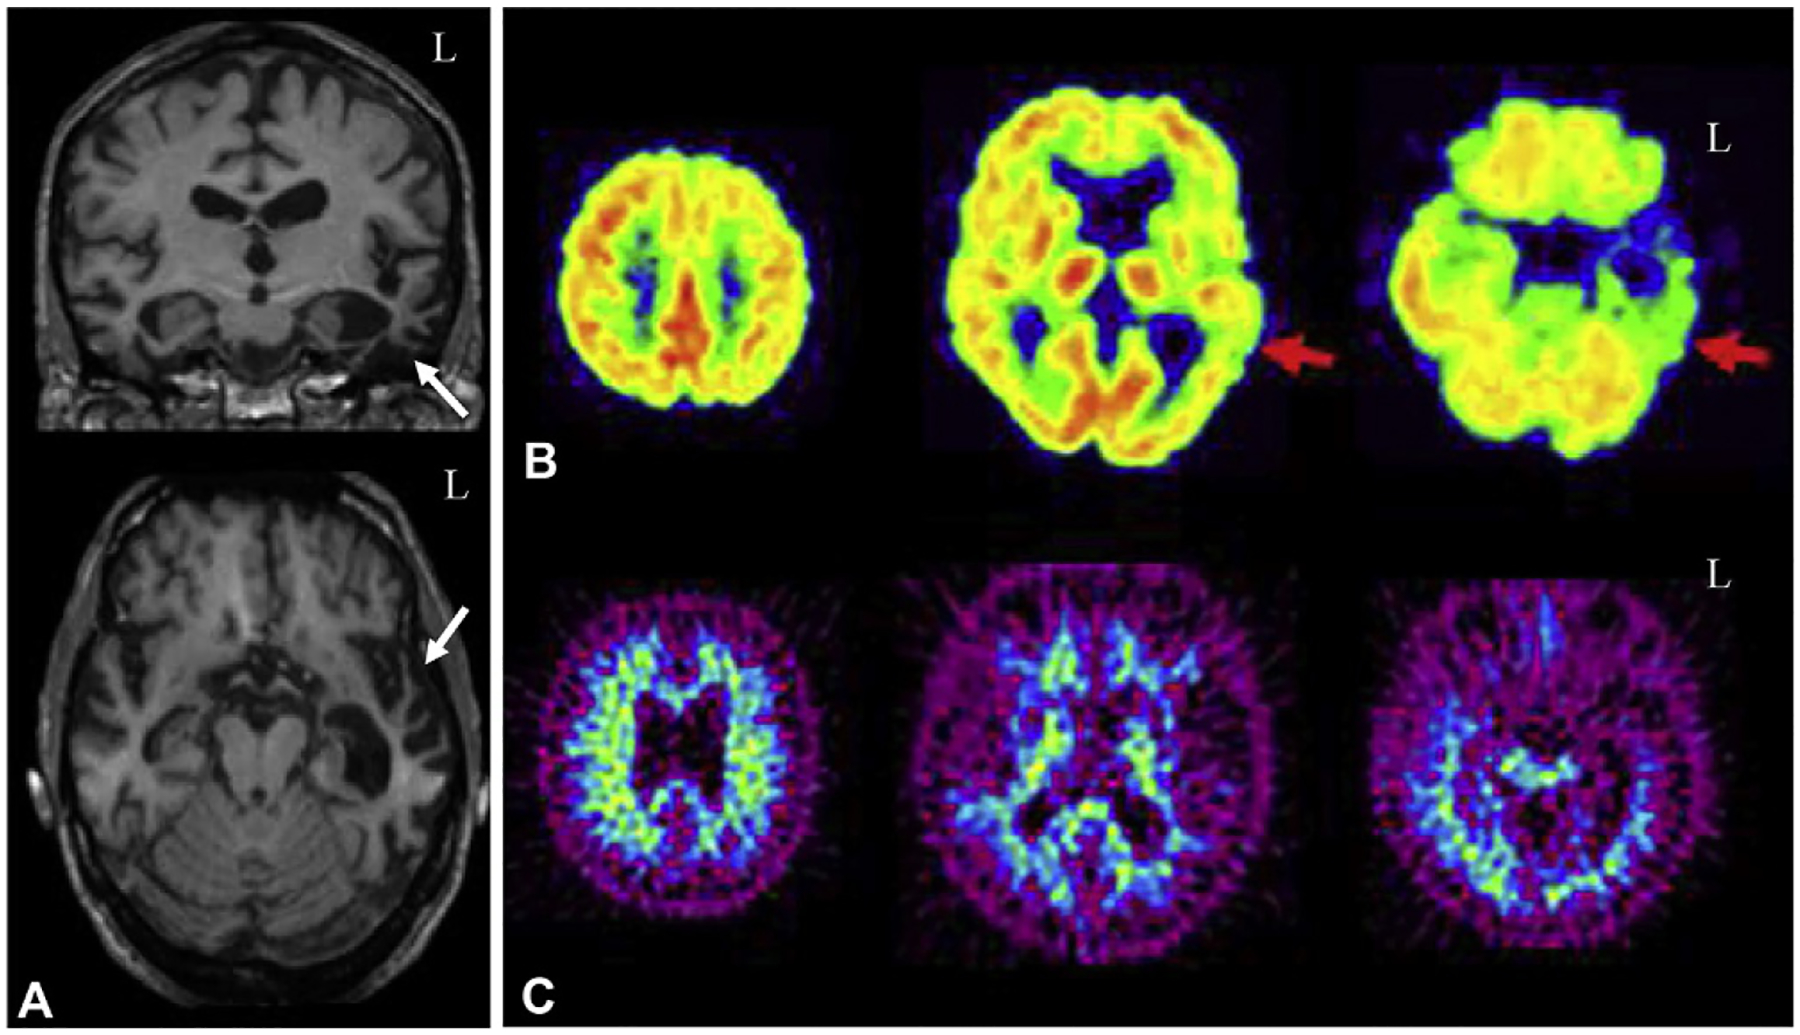
Neuroimaging in semantic dementia (SD). (A) Patients with semantic dementia (SD) show significant anterior temporal lobe atrophy, with greater atrophy in the left hemisphere than the right hemisphere (white arrows). (B) Patients with SD also show reduced glucose metabolism in the anterior temporal lobe (left > right, red arrow), but (C) no amyloid deposition on PET. L=left. Panel (A): adapted with permission from Rohrer, J.D., Clarkson, M.J., Kittus, R., et al., 2012. Rates of hemispheric and lobar atrophy in the language variants of frontotemporal lobar degeneration. J Alzheimers Dis 30, 407–411; Panel (B): adapted with permission from Drzezga, A., Grimmer, T., Henriksen, G., et al., 2008. Imaging of amyloid plaques and cerebral glucose metabolism in semantic dementia and Alzheimer’s disease. NeuroImage 39, 619–633.
Studies of SD patients with DTI have shown significant atrophy in the left uncinate fasciculus, left inferior longitudinal fasciculus, and left parahippocampal WM (Agosta et al., 2010; Zhang et al., 2011). The lowest FA values are seen in the left anterior temporal lobe (Whitwell et al., 2010a; Zhang et al., 2011; Magnin et al., 2012). SD patients also show reduced structural connectivity in frontotemporal pathways (Agosta et al., 2012b). On fMRI, SD patients have shown lack of activation in the superior temporal regions during reading (Wilson et al., 2009), while others show normal activation (Agosta et al., 2010). Altered activation was also manifested on a variety of tasks, including sound processing, autobiographical memory, and surface dyslexia (Wilson et al., 2009; Maguire et al., 2010; Goll et al., 2012). Studies using rsfMRI techniques have shown reduced functional connectivity of the left anterior temporal lobe (Agosta et al., 2014) and decreased connectivity of frontolimbic circuitry (Farb et al., 2013). Interestingly, increased connectivity in local networks of the prefrontal cortex was observed (Farb et al., 2013). Reduced left lateralized functional connectivity in inferior and ventral regions of the temporal lobe as well as in the bilateral occipital and frontal cortices, left amygdala, left hippocampus, and left caudate were also observed in SD patients (Agosta et al., 2014).
[18F]FDG PET studies of SD have identified reduced metabolism in the left anterior temporal lobe in these patients, but less significant frontal lobe hypometabolism than that seen in other FTD syndromes (Diehl et al., 2004; Rabinovici et al., 2008) (Fig. 12.5B). The reduced temporal lobe metabolism is associated with GM atrophy in that region (Diehl et al., 2004). Longitudinally, SD patients show progressively decreasing metabolism in the anterior cingulate and temporal lobe (Diehl-Schmid et al., 2006). Minimal binding of amyloid tracers are seen in these patients (Rabinovici et al., 2008) (Fig. 12.5C) (Smith et al., 2016a; Jones et al., 2018).
Progressive nonfluent aphasia
In patients with PNFA, studies have primarily demonstrated asymmetric perisylvian and anterior insular atrophy with the dominant language hemisphere most affected (usually the left hemisphere). Atrophy is also observed in the frontal operculum of the dominant hemisphere (e.g., Broca’s area), upper part of the temporal pole, lentiform nucleus, inferior and middle frontal gyri, premotor cortex, and the dorsolateral prefrontal cortex, spreading to other frontal, parietal, and temporal lobes, as well as the caudate and thalamus in later stages (Schroeter et al., 2007; Rohrer et al., 2009; Rohrer et al., 2012). Patients with PNFA caused by Pick’s disease (tau pathology) have more severe general temporal atrophy than other forms, while those with a GRN mutation (TDP-43 pathology) have more focalized atrophy in the left lateral temporal lobe (Whitwell and Josephs, 2011). Longitudinally, the frontal lobe shows a high rate of atrophy that is twice as fast as seen in patients with AD (Krueger et al., 2010).
PNFA patients show WM degeneration on DTI in frontotemporoparietal pathways, including the uncinate fasciculus, frontoparietal regions of the left arcuate fasciculus, other parts of the superior longitudinal fasciculus, and in the superior motor pathway (Whitwell et al., 2010a; Agosta et al., 2012b). In general, decreased WM integrity is seen in many of the same regions showing GM atrophy, including the left perisylvian region, inferior frontal gyrus, insula, and supplementary motor area (Whitwell et al., 2010a; Magnin et al., 2012). Task-based fMRI studies have demonstrated an absence of expected activation in the posterior inferior frontal cortex during a sentence complexity task, as well as reduced activation during sentence reading and comprehension (Cooke et al., 2003; Wilson et al., 2010).
On [18F]FDG PET, patients with PNFA show asymmetric frontal cortical hypometabolism in the language dominant hemisphere (usually the left), including in Broca’s area (Rabinovici et al., 2008). Notably, left-handed patients may show hypometabolism in the right frontal lobe, as this may be their language dominant hemisphere (Drzezga et al., 2002). Additional hypometabolism is seen in the insula, premotor cortex, and supplementary motor area (Nestor et al., 2003b). Amyloid PET studies have shown that the majority of PNFA patients are negative for significant amyloid tracer retention, although some with underlying Pick’s disease pathology may show some signal (Rabinovici et al., 2008).
Corticobasal degeneration
Patients with CBD show asymmetrical atrophy of the frontal cortex, especially in the premotor cortex and supplementary motor area, as well as the parietal lobe and the basal ganglia contralateral to the side most affected with rigidity and apraxia (Whitwell et al., 2007; Josephs et al., 2008) (Fig. 12.6A). If the CBD patient also manifests AD pathology, the temporal lobe is more likely to be affected than in other forms, while those with FTD pathology show a less clear pattern of atrophy (Whitwell et al., 2010b). Longitudinal atrophy rates of the whole brain are faster than seen in PSP (Whitwell et al., 2007; Whitwell and Josephs, 2011). DTI studies show a loss of WM integrity in the motor region of the thalamus, precentral and postcentral gyri, and in the bilateral supplementary motor area (Erbetta et al., 2009). A task-based fMRI study of limb apraxia in CBD demonstrated reduced activation in the premotor cortex with a corresponding increase in parietal activation, which may represent a compensatory neural recruitment (Beauchet et al., 2001).
Fig. 12.6.
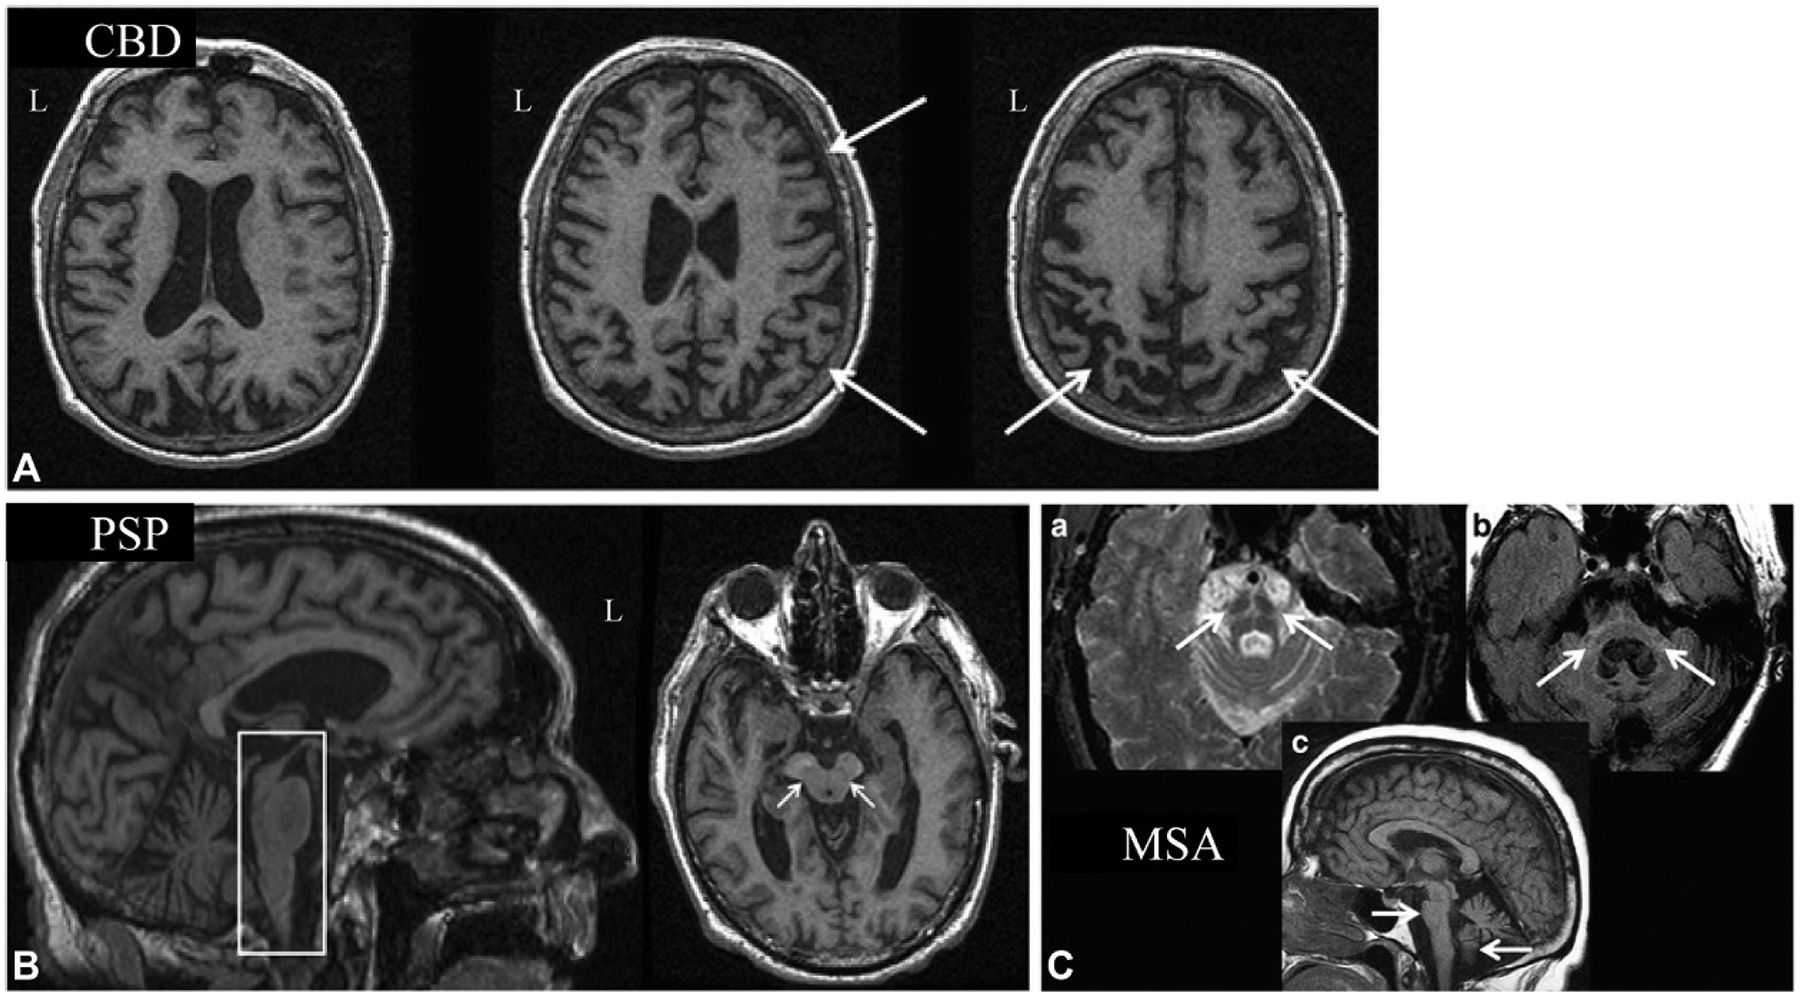
Neuroimaging in corticobasal degeneration (CBD), progressive supranuclear palsy (PSP), and multiple systems atrophy (MSA). (A) Example sMR images from a case with corticobasal degeneration (CBD) show atrophy in the frontal and parietal lobes (right > left; white arrows). (B) Structural MR images from a case with progressive supranuclear palsy (PSP) shows two hallmark findings often observed in these cases, including the “hummingbird sign,” which represents midbrain atrophy relative to the pons (white box) and the “mickey mouse sign,” which represents atrophy of the midbrain (white arrows). (C) MRI scans from a patient with multiple system atrophy (MSA) are shown, including the “hot cross buns sign” on T2-weighted MRI, which is reflective of pontocerebellar tract atrophy (a; white arrows), hyperintensity on a T2-weighted FLAIR sequence in the pons and middle cerebellar peduncles (b; white arrows), and marked atrophy of the brainstem and cerebellar vermis on T1-weighted MRI (c; white arrows). L = left. All panels adapted from Saeed, U., Compagnone, J., Aviv, R.I., et al., 2017. Imaging biomarkers in Parkinson’s disease and Parkinsonian syndromes: current and emerging concepts. Transl Neurodegener 6, 8 with permission through the Creative Commons Attribution 4.0 International License (http://creativecommons.org/licenses/by/4.0/).
[18F]FDG PET in CBD shows asymmetric hypometabolism in the posterior frontal lobes, paracentral lobule, sensorimotor cortex, thalamus, basal ganglia, middle cingulate, parietal lobe, and substantia nigra (Eckert et al., 2005; Teune et al., 2010). Amyloid PET studies are negative in CBD (Broski et al., 2014; Chiotis et al., 2016). Recent tau PET studies in CBD have shown deposition of tau in the supplementary motor area, midbrain, subthalamus, perirolandic area, basal ganglia and cerebral and cerebellar white matter regions; the deposition being greatest in regions contralateral to the more affected side (Kikuchi et al., 2016; Chiotis et al., 2018).
Progressive supranuclear palsy
Structural MRI studies have shown significant midbrain atrophy in PSP patients, particularly in comparison with the neighboring pons (Liscic et al., 2013); this degenerative change is more severe than that seen in CBD patients (Josephs et al., 2008; Whitwell and Josephs, 2011). This atrophy pattern has been described as the “-hummingbird sign” on a sagittal view and the “mickey mouse sign” on the axial view (Fig. 12.6B). Patients with PSP also show atrophy in the posterior frontal lobe, which is more severe than MSA, as well as atrophy in the premotor cortex, including the SMA, caudate nucleus, brainstem, and cerebellum (Josephs et al., 2008; Whitwell and Josephs, 2011).
PSP patients show decreased WM integrity on DTI in the superior longitudinal fasciculus, anterior thalamus, cingulum, primary motor cortex, supplementary motor area, and fronto-orbital WM (Whitwell et al., 2011d). Reduced structural connectivity in the cerebellothalamic network is also observed in patients with PSP, and this is associated with worse motor symptoms and cognitive decline (Whitwell et al., 2011d). In fact, DTI measures may be good biomarkers for diagnosis of PSP (Sajjadi et al., 2013). Finally, patients with PSP–Richardson syndrome, a PSP clinical presentation with postural instability and falls, supranuclear vertical gaze palsy, and cognitive dysfunction, show more severe WM damage in infratentorial fibers and thalamic radiations than PSP with Parkinson’s-like symptoms (Agosta et al., 2012a). Task-based fMRI studies have shown changes in brain activation in PSP patients during both a grip force task and a task involving mental imagery of lying, standing, walking, or running. Specifically, patients with PSP show reduced activation in the basal ganglia, primary motor cortex, and premotor cortex, including the supplementary motor area, and frontal and temporal lobes relative to controls (Burciu et al., 2015). This study also demonstrated that PSP patients had reduced activation in the contralateral caudate, lateral portion of the ventral premotor cortex, supplementary motor area, and frontal and temporal cortex relative to patients with PD (Burciu et al., 2015). PSP patients also showed increased activation in the parietal and occipital cortices during this grip task, perhaps suggesting compensatory changes in brain activation (Burciu et al., 2015). During the mental imagery tasks, patients with PSP showed reduced activation in the mesencephalic brainstem tegmentum, thalamus, midline cerebellum, caudate, inferior and superior parietal lobule, and left postcentral gyrus relative to controls, which was associated with increased postural instability and falls (Zwergal et al., 2011). Resting-state fMRI studies have shown decreased functional connectivity in the thalamus, caudate, anterior cingulate, dorsolateral prefrontal cortex, supramarginal gyrus, temporo-occipital cortex, supplementary motor area, and cerebellum in PSP patients (Piattella et al., 2015). Another study also showed reductions in functional connectivity in the DMN and the subcortical regions of the salience network, along with changes in the thalamus, striatum, cerebellum, and premotor cortex (Whitwell et al., 2011a).
[18F]FDG PET studies in PSP have shown hypometabolism of the prefrontal cortex, caudate, pallidum, thalamus, mesencephalon, and subthalamic nucleus (Eckert et al., 2005; Teune et al., 2010). In particular, the hypometabolism observed in the thalamus is associated with increased postural instability and falls (Zwergal et al., 2011). The presence of hypometabolism in the midbrain can differentia PSP from other dementias (Zhao et al., 2012). Amyloid PET studies generally show no significant binding in PSP patients (Broski et al., 2014; Chiotis et al., 2016). Finally, tau PET studies in PSP show significant uptake in the brainstem, basal ganglia, globus pallidum, thalamus, subthalamic nucleus, midbrain, perirolandic areas, cerebellum, and frontal cortex (Chiotis et al., 2016; Whitwell et al., 2017).
FTD with motor neuron disease and FTD with amyotrophic lateral sclerosis
Patients with FTD-MND show frontal and temporal lobe atrophy, while those with FTD-ALS show similar frontal and temporal atrophy plus atrophy in the anterior cingulate, occipital lobe, and precentral gyrus (Whitwell et al., 2011b; Rohrer, 2012). Patients with FTD-MND with a C9ORF72 mutation have more thalamic, frontal lobe, temporal lobe, insular, and posterior cortex atrophy than other patients (Sha et al., 2012; Yokoyama and Rosen, 2012). On DTI, patients with FTD-MND/ALS show reduced WM integrity in frontal and temporal lobe regions as well as in the corpus callosum, corticospinal tract, inferior longitudinal fasciculus, inferior fronto-occipital fasciculus, and uncinate fasciculus (Douaud et al., 2011; Trojsi et al., 2013). These WM changes are associated with poorer performance on cognitive tasks and greater disease severity and may represent a potential biomarker for disease progression (Trojsi et al., 2013). Longitudinal DTI studies show expanding degeneration of connectivity in motor networks (Verstraete et al., 2014). A combined DTI and rsfMRI study showed that reduced structural connectivity was associated with preserved or even increased functional connectivity (Douaud et al., 2011; Schmidt et al., 2014). The increased functional connectivity was associated with reduced disease severity but an increased rate of disease progression (Douaud et al., 2011). Longitudinally, progressive loss of functional and structural connectivity in the motor network and associated motor networks was observed (Schmidt et al., 2014). Task-based fMRI studies have shown reduced activation in the frontal lobe, insula, and thalamus during an executive task, in the frontal lobe during an emotional task, and in the frontal lobe, anterior cingulate, supramarginal gyrus, temporal lobe, and occipitotemporal regions during a verbal fluency task (Abrahams et al., 2004; Palmieri et al., 2010; Turner et al., 2011). rsfMRI studies have shown reduced or mixed functional connectivity changes in motor networks, increased DMN connectivity, and changes in frontoparietal networks (Mohammadi et al., 2009).
[18F]FDG PET studies show reduced metabolism in frontal lobe, anterior and medial temporal lobe, basal ganglia, and thalamic regions in patients with FTD-MND. Similarly, patients with FTD-ALS show hypometabolism in the frontal lobe, superior temporal lobe, parietal lobe, occipital lobe, and insula (Turner et al., 2011). The observed frontal lobe hypometabolism is worse in FTD-ALS than ALS participants without FTD (Canosa et al., 2016). Patients with C9ORF72 mutations causing FTD-ALS show hypometabolism in the anterior and posterior cingulate cortices, insula, caudate, thalamus, left frontal lobe, and left superior temporal gyrus relative to patients with ALS without the mutation or cognitive impairment (Cistaro et al., 2014a). Interestingly, these patients also showed hypermetabolism relative to ALS without mutations or FTD in the midbrain, bilateral occipital lobe, globus pallidum, and left inferior temporal lobe. Notably, the C9ORF72 FTD-ALS patients showed greater left temporal lobe hypometabolism than FTD-ALS without the genetic mutation (Cistaro et al., 2014b). By contrast, amyloid PET has shown minimal binding in either subtype (Yamakawa et al., 2012).
In sum, neuroimaging studies in FTD have identified structural and functional changes in the brain, including atrophy of the frontal and temporal lobes, altered brain function and connectivity, and significant hypometabolism. Additional studies in larger cohorts to better characterize and differentiate the various FTD subtypes, as well as the overlap between FTD and ALS, are needed.
LEWY BODY DISEASES
Neurodegenerative diseases caused by Lewy body pathology include dementia with Lewy bodies (DLB), Parkinson’s disease (with or without dementia), and multiple systems atrophy (MSA). Lewy bodies are pathologic protein aggregations of α-synuclein. Although Lewy body diseases are their own clinical entities, many patients have Lewy bodies co-occurring with amyloid and tau pathology or other proteinopathies.
Dementia with Lewy bodies
DLB is clinically characterized by cognitive decline in executive function, attention, higher order visuospatial processing, which can fluctuate in severity, visual hallucinations, and motor Parkinson’s symptoms. Although there are minimal pathologic and clinical differences between PDD and DLB during later stages of disease, the clinical picture at onset differs significantly, with motor disorder occurring first in PDD whereas cognitive changes precede motor symptoms in DLB. Since a major role for neuroimaging is early identification, we discuss imaging findings in these closely related disorders separately.
Structural MRI studies in DLB show that patients have cortical atrophy in the insula, middle, and posterior cingulate, superior temporo-occipital areas, lateral orbitofrontal lobe, and other regions of the frontal, inferior parietal, temporal, and occipital lobes (Burton et al., 2002) (Fig. 12.7A). Patients with DLB have less cortical atrophy and relative preservation of the MTL than seen in AD, which can help in the differential diagnosis between the two dementias (Whitwell et al., 2007). Hippocampal atrophy in DLB likely indicates comorbid amyloid and tau pathology, rather than the Lewy body pathology alone (Burton et al., 2009). In addition, patients with DLB show more atrophy of the midbrain, especially the substantia innominata, dorsal mesopontine areas, hypothalamus, basal forebrain, caudate, and putamen, and less frontal lobe atrophy than patients with AD (Hanyu et al., 2005; Kantarci et al., 2012a). Atrophy in the visual association areas rather than the occipital lobe has been shown to correlate with visual hallucinations, while inferior frontal lobe neurodegeneration was associated with the cognitive decline (Firbank et al., 2010; Sanchez-Castaneda et al., 2010). Relative to PDD, DLB patients show more atrophy in the temporal, parietal, and occipital lobes as well as areas of the striatum, but less caudate atrophy (Johansen et al., 2010; Lee et al., 2010). As might be expected, amyloid PET-positive DLB patients show more global atrophy than amyloid negative DLB (Johansen et al., 2010; Shimada et al., 2013). Longitudinally, DLB patients show a faster rate of atrophy in the medial and lateral temporal lobes and the temporo-occipital regions than in PDD (Burton et al., 2005; Johansen et al., 2010).
Fig. 12.7.
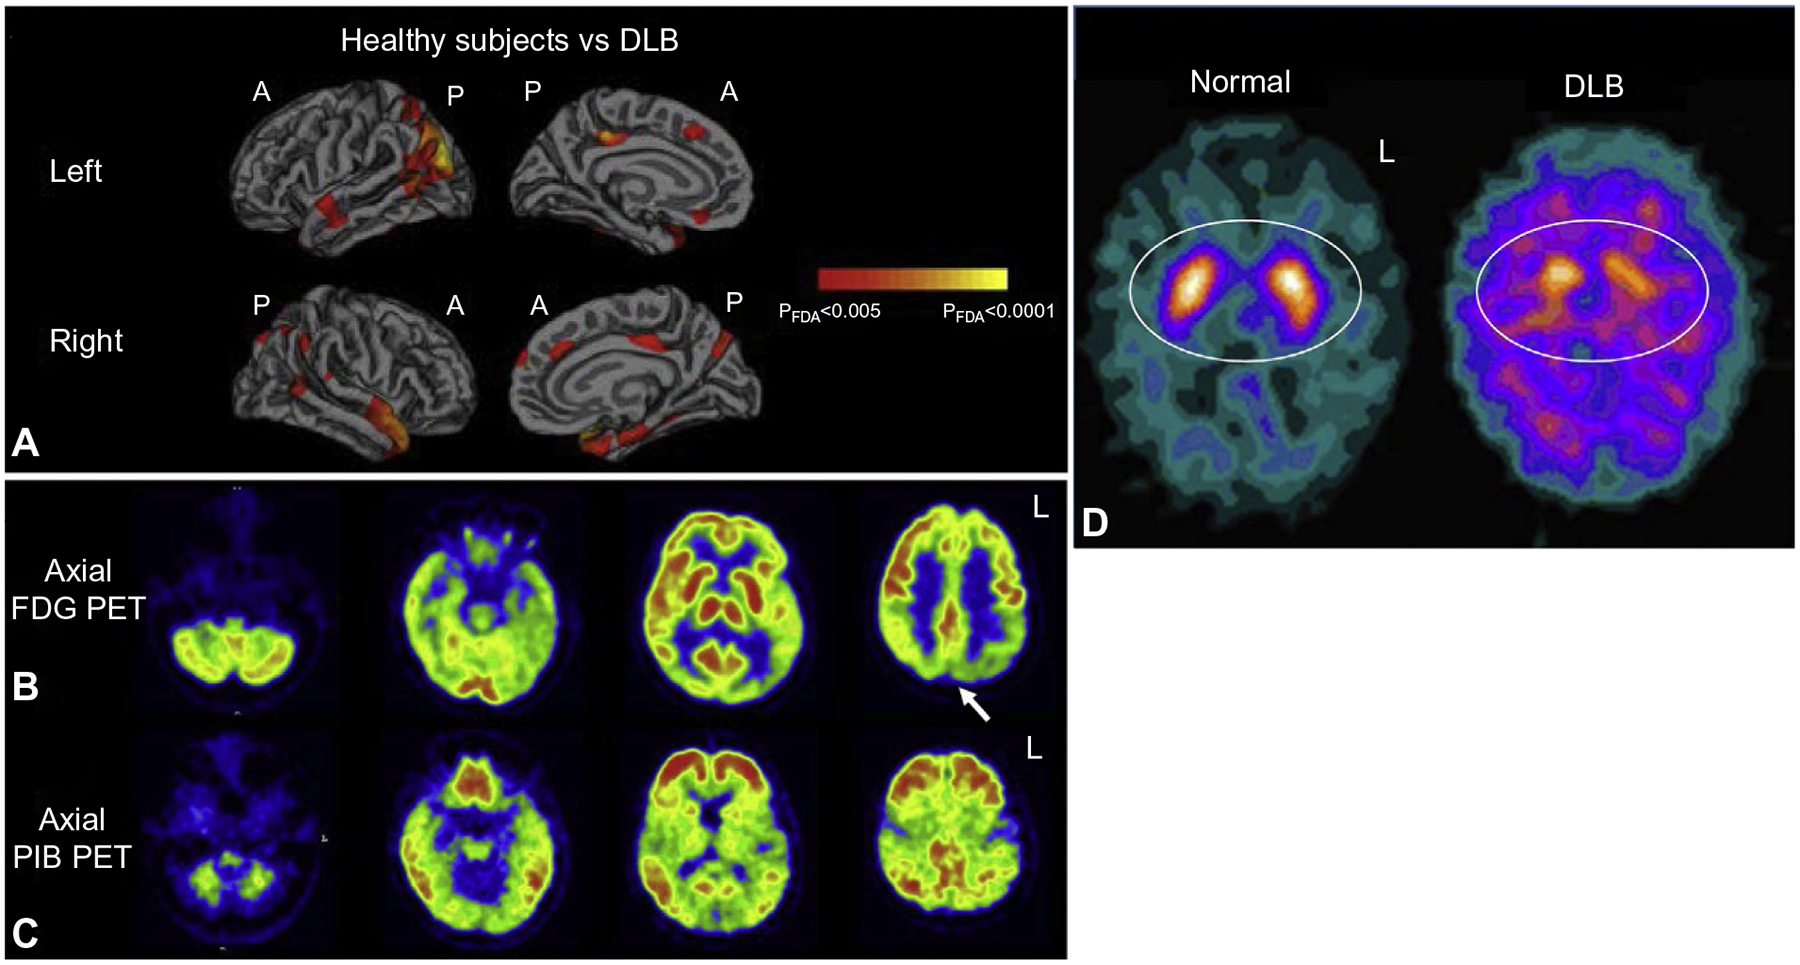
Neuroimaging in dementia with Lewy bodies. (A) Surface-based analysis shows significant gray matter atrophy in patients with dementia with Lewy bodies (DLB) relative to healthy older adults in the frontal, parietal, and temporal lobes, as well as the posterior cingulate. (B) Glucose hypometabolism is observed in a patient with DLB in the parietal and occipital lobes (white arrow), while (C) amyloid deposition is seen throughout the cortex. (D) 123I-FP-CIT SPECT (DaTSCAN®, GE Healthcare, UK) images show reduced striatal dopamine transporter availability, reflecting lower dopaminergic neurotransmission, in a patient with DLB relative to a cognitively normal individual (“Normal”; white ovals). A = anterior; FDG = fluorodeoxyglucose; L = left; P = posterior; PET = positron emission tomography; PiB = Pittsburgh Compound B. Panel (A): adapted with permission from Watson, R., Colloby, S.J., Blamire, A.M., et al., 2015. Assessment of regional gray matter loss in dementia with Lewy bodies: a surface-based MRI analysis. Am J Geriatr Psychiatry 23, 38–46; Panels (B) and (C): adapted with permission from Claassen, D.-O., Lowe, V.J., Peller, P.J., et al., 2011. Amyloid and glucose imaging in dementia with Lewy bodies and multiple systems atrophy. Parkinsonism Relat Disord 17, 160–165; Panel (D): adapted with permission from Rossi, C., Volterrani, D., Nicoletti, V., et al., 2009. “Parkinson-dementia” diseases: a comparison by double tracer SPECT studies. Parkinsonism Relat Disord 15, 762–766.
Using DTI, significant abnormalities in WM are seen in DLB patients including in the corpus callosum, longitudinal fasciculi, and frontal, parietal, and occipital WM (Kantarci et al., 2010). Changes in WM integrity in the amygdala on DTI were associated with worse motor symptoms in patients with DLB (Kantarci et al., 2010). Relative to AD, DLB patients show more atrophy in posterior WM (e.g., parieto-occipital WM) as well as in the pons and thalamus (Watson et al., 2012). On DTI, DLB patients also show greater WM changes than PDD patients in the posterior temporal lobe, posterior cingulate, and bilateral visual areas (Lee et al., 2010; Ebmeier et al., 2011). On fMRI, DLB patients have reduced activation in lateral occipitotemporal areas during visual motion and in ventral occipitotemporal areas during face-matching tasks (Sauer et al., 2006; Taylor et al., 2012). Increased activation in the superior temporal sulcus was also seen during face-matching in DLB patients (Sauer et al., 2006). rsfMRI studies of DLB patients show reduced global and local cortico-cortical connectivity, as well as reduced connectivity of the precuneus with the dorsal attention network and putamen (Galvin et al., 2011). Increased connectivity in the DMN and occipital cortex were also observed in DLB (Galvin et al., 2011). Relative to AD patients, DLB patients show greater connectivity in the DMN and between the putamen and frontal, temporal, and parietal regions (Franciotti et al., 2013).
Hypometabolism on [18F]FDG PET is seen in DLB in the basal ganglia, cerebellum, temporoparietal regions, occipital lobe including the primary visual cortex, and the posterior cingulate, with relative sparing of the MTL (Minoshima et al., 2001; Kantarci et al., 2012b) (Fig. 12.7B). Compared to AD, DLB patients show more hypometabolism in the occipital lobe, a measure that can be used to distinguish AD from DLB (Minoshima et al., 2001; Teune et al., 2010; Kantarci et al., 2012b). Occipital lobe hypometabolism is also linked to the visual hallucinations that are seen in DLB patients (Perneczky et al., 2008). Amyloid PET demonstrates plaque deposition in the majority of DLB patients but at a lower level than that typical in AD (Edison et al., 2008). However, DLB patients show more tracer uptake in the visual cortex relative to AD (Edison et al., 2008; Gomperts et al., 2008; Shimada et al., 2013). Greater amyloid burden in DLB is associated with faster cognitive decline, especially in visuospatial function (Gomperts et al., 2008) (Fig. 12.7C). Dopaminergic neurotransmitter system tracers have proven useful as biomarkers for DLB and other Lewy body diseases, with both PET and single-photon emission computed tomography (SPECT) based approaches in use (Fig. 12.7D). SPECT studies targeting the dopamine transporter (DAT) have shown reduced tracer binding in the striatum, which can differentiate DLB from AD (Walker et al., 2002). The marked difference in DAT tracer binding in DLB relative to AD justifies the use of these techniques in clinical practice and is an element of the diagnostic criteria for DLB (McKeith et al., 2005). D2 receptors and other measures of dopaminergic neurotransmission (e.g., fluorodopa PET imaging) are significantly reduced in DLB relative to CN or AD (Walker et al., 1997; Hu et al., 2000), and reductions in the extent of nigrostriatal projections to the caudate and putamen are seen (Gilman et al., 2004). However, none of the imaging measures of dopaminergic neurotransmission can distinguish between different Parkinsonian syndromes (e.g., DLB, PDD, MSA). Interestingly, decreased DAT binding in the caudate is associated with the cognitive symptoms of DLB, while reductions in the putamen are associated with the motor symptoms of DLB (Johansen et al., 2010). A recent tau PET study indicated increased tau in the inferior temporal gyrus and precuneus in DLB, but it was variable across patients and most commonly observed in those that were amyloid positive (Gomperts et al., 2016).
Parkinson’s disease dementia
Patients with PDD show atrophy in limbic and paralimbic areas, including the amygdala, hippocampus, and entorhinal cortex (Junque et al., 2005; Kenny et al., 2008). The SPARE-AD index, which is a composite measure of the extent of AD-like atrophy, and atrophy in the hippocampus, are associated with cognitive decline, including decline in memory (Weintraub et al., 2012). WMH are also associated with reduced cognition and dementia in PD (Burton et al., 2006). Longitudinally, PDD patients show increased atrophy in limbic and temporo-occipital regions, which is associated with increasing cognitive decline (Burton et al., 2005).
DTI studies show reduced WM integrity in PDD in the bilateral parietal lobe, which is associated with poorer cognitive performance (Cochrane and Ebmeier, 2013). PD patients without dementia show WM damage in the brainstem and thalamus, and in later stages in frontal white matter tracts, a change that is associated with clinical and cognitive decline (Melzer et al., 2013). Reduced structural connectivity in the DMN and visual network are also seen in PDD (Tessitore et al., 2012; Gottlich et al., 2013). A task-based fMRI in PDD showed mixed changes in the prefrontal cortex during an executive function task (Monchi et al., 2004). rsfMRI studies show reduced thalamocortical functional connectivity in drug naive PD patients, which improve after treatment (Luo et al., 2014). Similarly, PD patients who were scanned in an “off drug state” or were “drug normalized” showed mixed patterns of functional connectivity changes in these regions (Wu et al., 2009; Kwak et al., 2010).
PDD patients show hypometabolism in the frontal and parietal lobes, visual association areas, and the posterior cingulate (Eckert et al., 2005). In fact, the extent of hypometabolism in the visual association areas and posterior cingulate can predict later cognitive decline in PD to dementia (Eckert et al., 2005). Early amyloid PET observations suggested minimal tracer binding in PDD (Edison et al., 2008). However, subsequent studies have indicated that some amyloid binding in PD, when present, is predictive of developing cognitive impairment and dementia (Gomperts et al., 2013). Dopaminergic SPECT imaging show nigrostriatal degeneration and decreased DAT binding in the caudate and putamen (Walker et al., 2002). Severe reductions in fluorodopa PET signal have also been reported (Snow, 1996). Tau PET studies have indicated increased tau deposition in PDD patients, especially but not exclusively in those who are amyloid positive (Gomperts et al., 2016). Further, patients with PD have shown reduced tau deposition in the substantia nigra (Hansen et al., 2016).
Multiple system atrophy
MSA encompasses a number of diseases, including olivopontocerebellar atrophy, Shy–Drager syndrome, and striatonigral degeneration. MSA presents clinically with Parkinsonism of varying degrees, cerebellar ataxia, and prominent dysfunction in the autonomic nervous system, including urinary dysfunction and orthostatic hypotension (Stefanova et al., 2009; Broski et al., 2014). MSA patients are sometimes divided into a Parkinsonian type MSA (MSA-P) or a cerebellar ataxia type MSA (MSA-C) based on their predominant symptoms. Cognition can be relatively preserved in MSA but deficits in executive function have been reported (Robbins et al., 1992; Brown et al., 2010).
MRI studies in MSA show pontine and cerebellar atrophy, enlargement of the fourth ventricle, and atrophy of the parietal and occipital lobes, supplementary motor area, substantia nigra, striatum, thalamus, and middle cerebellar peduncle (Planetta et al., 2015; Mestre et al., 2016) (Fig. 12.6C). A visual rating scale of atrophy in MSA has been developed that focuses on atrophy in the brainstem and cerebellum, midbrain, putamen, and basal ganglia (Rolland et al., 2011). T2-weighted imaging often shows a cruciform hyperintensity in the pons that is known as the “hot cross buns sign” (Broski et al., 2014). A slit-like hyperintensity on the edge of the putamen is also seen in MSA patients (Mestre et al., 2016). T2*-weighted imaging shows iron deposits in MSA patients in the posterior putamen and pulvinar thalamus (Wang et al., 2012a). Longitudinally, MSA patients show increased atrophy rates in the pons, cerebellum, midbrain, and superior cerebellar peduncle relative to CN, and increased cortical atrophy rates were associated with declining cognition (Paviour et al., 2006).
MSA patients show reduced WM integrity in the substantia nigra, putamen, pons, and middle cerebellar peduncle on DTI (Tsukamoto et al., 2012). Relative to PD patients, MSA patients show reduced WM integrity in the middle and inferior cerebellar peduncles, basis pontis, internal capsule, superior corona radiata, lateral periputaminal WM, corpus callosum, corticospinal tract, medial lemniscus, and the thalamic radiations (Shiga et al., 2005; Cnyrim et al., 2014). The WM degeneration in the middle cerebellar peduncle, pons, and internal capsule are associated with severity of the ataxia (Shiga et al., 2005). A task-based fMRI study in MSA showed reduced activation in motor control areas, including the basal ganglia, thalamus, insula, primary sensorimotor cortex, prefrontal cortex, and cerebellum during a precision grip force task (Planetta et al., 2015). On rsfMRI, MSA patients showed decreased connectivity of the left primary sensorimotor cortex, posterior cingulate, left lateral prefrontal cortex, and right inferior parietal lobule (You et al., 2011). MSA patients also showed increased connectivity in the right primary sensorimotor cortex, premotor cortex, supplementary motor area, medial prefrontal cortex, and left inferior parietal lobule in the same study, which may suggest compensatory changes (You et al., 2011).
On molecular imaging, patients with MSA show decreased glucose metabolism on [18F]FDG PET in the cerebellum and putamen that does not correlate well with changes in dopaminergic function; amyloid PET signal tends to be minimal (Claassen et al., 2011; Ko et al., 2016). DAT SPECT shows reductions in binding associated with disease severity and duration that is specific to MSA-P and not observed in MSA-C (Ko et al., 2016). Finally, a single MSA case showed increased tau in the globus pallidus, midbrain, putamen, substantia nigra, thalamus, ventral striatum, and frontal, parietal and temporal lobes (Perez-Soriano et al., 2017).
Overall, studies in patients with DLB, PD with or without dementia, and MSA have shown significant atrophic, functional, and molecular brain changes. Future studies in the earliest stages of these disorders will help further the understanding of disease development in relation to phenomenology. In addition, development of new tracers targeting α-synuclein would significantly advance the understanding of disease course in DLB, PDD, and MSA and be of use in treatment development.
DIFFERENTIAL DIAGNOSIS OF DEMENTIAS AND RELATED NEURODEGENERATIVE DISORDERS
Differential diagnosis of cognitive decline and other indicators of possible neurodegenerative conditions that are not associated with a known familial mutation or known event such as recent history of cardiovascular disease or stroke can be challenging, due to overlapping clinical symptoms and features and the range of age-associated changes and comorbidities. The neuroimaging modalities discussed throughout this chapter may be helpful to distinguish among these disorders in a clinical setting. See the sections above for the AUC for amyloid imaging, as well as other neuroimaging techniques, in clinical diagnosis of AD and for clinical trials.
Differential diagnosis of neurodegenerative diseases presenting without motor symptoms, such as late-onset AD, atypical AD, and FTD, may be facilitated by MRI and PET. sMRI will typically show significant MTL and temporo-parietal atrophy in LOAD vs prominent atrophy of the frontal and lateral temporal lobes in FTD. PET studies with [18F]FDG and amyloid tracers will provide good delineation of AD/atypical AD from FTD, as AD patients will typically show significant amyloid deposition and posterior hypometabolism and most FTD patients will be amyloid PET negative, while showing frontal hypometabolism. Although experimental today, tau PET is likely to improve early in vivo differential diagnosis.
Distinguishing between LOAD and atypical forms of AD is usually achieved based on cognitive symptoms, as cognitive domains other than memory tend to be more affected in atypical AD. sMRI may provide additional support for a diagnosis. For example, logopenic aphasia patients show more asymmetrical left posterior temporal and temporoparietal atrophy than is typically seen in LOAD. PCA patients show greater parietal and occipital atrophy, while CAA and VaD patients present with more vascular abnormalities on MRI, including more frequent microhemorrhages and higher WMH burden. Metabolic patterns on [18F]FDG PET may also help with differential diagnosis, as logopenic aphasia patients show more asymmetric lateral parietal and posterior temporal hypometabolism, PCA patients show more occipital lobe hypometabolism, and SIVD patients show diffuse and patchy areas of hypometabolism relative to LOAD. Further, widespread amyloid deposition in pure SIVD without CAA is not common, although amyloid deposition is seen in many of the atypical AD forms (PCA, logopenic aphasia, CAA).
In addition, distinguishing between diseases with prominent motor symptoms can also be challenging. FTD-MND and FTD-ALS both show cognitive and motor symptoms and are associated with atrophy and reduced metabolism in the frontal and temporal lobes. PSP and CBD also show cognitive deficits and motor symptoms. Therefore, differentiation of these two diseases is currently not well assisted by neuroimaging, aside from subtle differences in sMRI atrophy patterns. PDD, DLB, and MSA show greater basal ganglia and less MTL atrophy than seen in typical LOAD, as well as decreased striatal dopaminergic neurotransmission on PET or SPECT. The latter measure (reduced dopaminergic neurotransmission) may be the most clinically distinguishing measure for differentiating Lewy Body-associated disorders from other diseases. In fact, reduced dopaminergic binding on PET or SPECT is included in the diagnostic criteria for DLB. Further, PDD and DLB patients tend to show more atrophy and hypometabolism in posterior cortical regions, particularly in parietal and occipital lobes, than is seen in FTD-MND/ALS. Differentiating between DLB, PDD, and MSA can also be difficult clinically. However, on sMRI, MSA patients show a distinctive cruciform hyperintensity on T2-weighted imaging in the pons and slit-like hyperintensity around the putamen, which may be specific to MSA. Ultimately, future tools targeting multiple proteinopathies (e.g., α-synuclein, TDP-43, ubiquitin inclusions), as well as the neuroinflammation that is observed in nearly all neurodegenerative diseases, will permit a better mechanistic and stage-specific understanding of the neurodegenerative dementias, which will in turn enhance patient care and treatment development.
CONCLUSION
The extensive body of neuroimaging studies of neurodegenerative dementias reviewed in this chapter provides important information about structural, functional, and molecular changes in the brain underlying the observed clinical symptoms of a wide variety of diseases. Neuroimaging can be helpful, if not essential, for differential diagnosis of many of these conditions. Further studies with advanced MRI techniques and development of novel PET tracers for additional proteinopathies beyond amyloid (i.e., α-synuclein, TDP-43, etc.) will likely provide even more information about pathophysiology associated with the various degenerative and dementing syndromes. In addition, neuroimaging techniques will be useful in clinical trials of new therapeutics designed to treat these disabling and often refractory disorders for monitoring disease-related changes or as endpoints to complement current clinical outcome measures.
References
- Abrahams S, Goldstein LH, Simmons A et al. (2004). Word retrieval in amyotrophic lateral sclerosis: a functional magnetic resonance imaging study. Brain 127: 1507–1517. [DOI] [PubMed] [Google Scholar]
- Agosta F, Henry RG, Migliaccio R et al. (2010). Language networks in semantic dementia. Brain 133: 286–299. [DOI] [PMC free article] [PubMed] [Google Scholar]
- Agosta F, Pievani M, Svetel M et al. (2012a). Diffusion tensor MRI contributes to differentiate Richardson’s syndrome from PSP-parkinsonism. Neurobiol Aging 33: 2817–2826. [DOI] [PubMed] [Google Scholar]
- Agosta F, Scola E, Canu E et al. (2012b). White matter damage in frontotemporal lobar degeneration spectrum. Cereb Cortex 22: 2705–2714. [DOI] [PubMed] [Google Scholar]
- Agosta F, Sala S, Valsasina P et al. (2013). Brain network connectivity assessed using graph theory in frontotemporal dementia. Neurology 81: 134–143. [DOI] [PubMed] [Google Scholar]
- Agosta F, Galantucci S, Valsasina P et al. (2014). Disrupted brain connectome in semantic variant of primary progressive aphasia. Neurobiol Aging 35: 2646–2655. [DOI] [PubMed] [Google Scholar]
- Aizenstein HJ, Nebes RD, Saxton JA et al. (2008). Frequent amyloid deposition without significant cognitive impairment among the elderly. Arch Neurol 65: 1509–1517. [DOI] [PMC free article] [PubMed] [Google Scholar]
- Albert MS, DeKosky ST, Dickson D et al. (2011). The diagnosis of mild cognitive impairment due to Alzheimer’s disease: recommendations from the National Institute on Aging-Alzheimer’s Association workgroups on diagnostic guidelines for Alzheimer’s disease. Alzheimers Dement 7: 270–279. [DOI] [PMC free article] [PubMed] [Google Scholar]
- Alexander GE, Chen K, Pietrini P et al. (2002). Longitudinal PET evaluation of cerebral metabolic decline in dementia: a potential outcome measure in Alzheimer’s disease treatment studies. Am J Psychiatry 159: 738–745. [DOI] [PubMed] [Google Scholar]
- Alzheimer’s Association (2016). 2016 Alzheimer’s disease facts and figures. Alzheimers Dement 12: 459–509. [DOI] [PubMed] [Google Scholar]
- Andrade K, Kas A, Valabregue R et al. (2012). Visuospatial deficits in posterior cortical atrophy: structural and functional correlates. J Neurol Neurosurg Psychiatry 83: 860–863. [DOI] [PubMed] [Google Scholar]
- Apostolova LG, Hwang KS, Andrawis JP et al. (2010a). 3D PIB and CSF biomarker associations with hippocampal atrophy in ADNI subjects. Neurobiol Aging 31: 1284–1303. [DOI] [PMC free article] [PubMed] [Google Scholar]
- Apostolova LG, Mosconi L, Thompson PM et al. (2010b). Subregional hippocampal atrophy predicts Alzheimer’s dementia in the cognitively normal. Neurobiol Aging 31: 1077–1088. [DOI] [PMC free article] [PubMed] [Google Scholar]
- Apostolova LG, Hwang KS, Medina LD et al. (2011). Cortical and hippocampal atrophy in patients with autosomal dominant familial Alzheimer’s disease. Dement Geriatr Cogn Disord 32: 118–125. [DOI] [PMC free article] [PubMed] [Google Scholar]
- Barnes J, Whitwell JL, Frost C et al. (2006). Measurements of the amygdala and hippocampus in pathologically confirmed Alzheimer disease and frontotemporal lobar degeneration. Arch Neurol 63: 1434–1439. [DOI] [PubMed] [Google Scholar]
- Barnes J, Bartlett JW, van de Pol LA et al. (2009). A meta-analysis of hippocampal atrophy rates in Alzheimer’s disease. Neurobiol Aging 30: 1711–1723. [DOI] [PMC free article] [PubMed] [Google Scholar]
- Baron JC, Farid K, Dolan E et al. (2014). Diagnostic utility of amyloid PET in cerebral amyloid angiopathy-related symptomatic intracerebral hemorrhage. J Cereb Blood Flow Metab 34: 753–758. [DOI] [PMC free article] [PubMed] [Google Scholar]
- Bateman RJ, Xiong C, Benzinger TL et al. (2012). Clinical and biomarker changes in dominantly inherited Alzheimer’s disease. N Engl J Med 367: 795–804. [DOI] [PMC free article] [PubMed] [Google Scholar]
- Beauchet O, Giraux P, Schneider F et al. (2001). Brain abnormalities underlying limb apraxia in corticobasal degeneration: an fMRI study. Dialogues Clin Neurosci 3: 214–215. [DOI] [PMC free article] [PubMed] [Google Scholar]
- Beeson PM, King RM, Bonakdarpour B et al. (2011). Positive effects of language treatment for the logopenic variant of primary progressive aphasia. J Mol Neurosci 45: 724–736. [DOI] [PMC free article] [PubMed] [Google Scholar]
- Bendlin BB, Ries ML, Canu E et al. (2010). White matter is altered with parental family history of Alzheimer’s disease. Alzheimers Dement 6: 394–403. [DOI] [PMC free article] [PubMed] [Google Scholar]
- Benzinger TLS, Gordon BA, Friedrichsen KA et al. (2016). Tau PET imaging with AV-1451 in autosomal dominant Alzheimer’s disease: update from the Dominantly Inherited Alzheimer Network (DIAN). Alzheimers Dement 12: P378. [Google Scholar]
- Braak H, Braak E, Bohl J (1993). Staging of Alzheimer-related cortical destruction. Eur Neurol 33: 403–408. [DOI] [PubMed] [Google Scholar]
- Brambati SM, Amici S, Racine CA et al. (2015). Longitudinal gray matter contraction in three variants of primary progressive aphasia: a tenser-based morphometry study. Neuroimage Clin 8: 345–355. [DOI] [PMC free article] [PubMed] [Google Scholar]
- Brickman AM, Provenzano FA, Muraskin J et al. (2012). Regional white matter hyperintensity volume, not hippocampal atrophy, predicts incident Alzheimer disease in the community. Arch Neurol 69: 1621–1627. [DOI] [PMC free article] [PubMed] [Google Scholar]
- Brier MR, Thomas JB, Snyder AZ et al. (2012). Loss of intra-network and internetwork resting state functional connections with Alzheimer’s disease progression. J Neurosci 32: 8890–8899. [DOI] [PMC free article] [PubMed] [Google Scholar]
- Brier MR, Gordon B, Friedrichsen K et al. (2016). Tau and Abeta imaging, CSF measures, and cognition in Alzheimer’s disease. Sci Transl Med 8: 338ra366. [DOI] [PMC free article] [PubMed] [Google Scholar]
- Broski SM, Hunt CH, Johnson GB et al. (2014). Structural and functional imaging in parkinsonian syndromes. Radiographics 34: 1273–1292. [DOI] [PMC free article] [PubMed] [Google Scholar]
- Brown RG, Lacomblez L, Landwehrmeyer BG et al. (2010). Cognitive impairment in patients with multiple system atrophy and progressive supranuclear palsy. Brain 133: 2382–2393. [DOI] [PubMed] [Google Scholar]
- Brundel M, de Bresser J, van Dillen JJ et al. (2012). Cerebral microinfarcts: a systematic review of neuropathological studies. J Cereb Blood Flow Metab 32: 425–436. [DOI] [PMC free article] [PubMed] [Google Scholar]
- Burciu RG, Ofori E, Shukla P et al. (2015). Distinct patterns of brain activity in progressive supranuclear palsy and Parkinson’s disease. Mov Disord 30: 1248–1258. [DOI] [PMC free article] [PubMed] [Google Scholar]
- Burgmans S, van Boxtel MP, Smeets F et al. (2009). Prefrontal cortex atrophy predicts dementia over a six-year period. Neurobiol Aging 30: 1413–1419. [DOI] [PubMed] [Google Scholar]
- Burton EJ, Karas G, Paling SM et al. (2002). Patterns of cerebral atrophy in dementia with Lewy bodies using voxel-based morphometry. NeuroImage 17: 618–630. [PubMed] [Google Scholar]
- Burton EJ, McKeith IG, Burn DJ et al. (2005). Brain atrophy rates in Parkinson’s disease with and without dementia using serial magnetic resonance imaging. Mov Disord 20: 1571–1576. [DOI] [PubMed] [Google Scholar]
- Burton EJ, McKeith IG, Burn DJ et al. (2006). Progression of white matter hyperintensities in Alzheimer disease, dementia with Lewy bodies, and Parkinson disease dementia: a comparison with normal aging. Am J Geriatr Psychiatry 14: 842–849. [DOI] [PubMed] [Google Scholar]
- Burton EJ, Barber R, Mukaetova-Ladinska EB et al. (2009). Medial temporal lobe atrophy on MRI differentiates Alzheimer’s disease from dementia with Lewy bodies and vascular cognitive impairment: a prospective study with pathological verification of diagnosis. Brain 132: 195–203. [DOI] [PubMed] [Google Scholar]
- Canosa A, Pagani M, Cistaro A et al. (2016). 18F-FDG-PET correlates of cognitive impairment in ALS. Neurology 86: 44–49. [DOI] [PubMed] [Google Scholar]
- Cash DM, Ridgway GR, Liang Y et al. (2013). The pattern of atrophy in familial Alzheimer disease: volumetric MRI results from the DIAN study. Neurology 81: 1425–1433. [DOI] [PMC free article] [PubMed] [Google Scholar]
- Celone KA, Calhoun VD, Dickerson BC et al. (2006). Alterations in memory networks in mild cognitive impairment and Alzheimer’s disease: an independent component analysis. J Neurosci 26: 10222–10231. [DOI] [PMC free article] [PubMed] [Google Scholar]
- Chan D, Fox NC, Jenkins R et al. (2001). Rates of global and regional cerebral atrophy in AD and frontotemporal dementia. Neurology 57: 1756–1763. [DOI] [PubMed] [Google Scholar]
- Charidimou A, Meegahage R, Fox Z et al. (2013). Enlarged perivascular spaces as a marker of underlying arteriopathy in intracerebral haemorrhage: a multicentre MRI cohort study. J Neurol Neurosurg Psychiatry 84: 624–629. [DOI] [PMC free article] [PubMed] [Google Scholar]
- Charidimou A, Ni J, Martinez-Ramirez S et al. (2016). Cortical superficial siderosis in memory clinic patients: further evidence for underlying cerebral amyloid angiopathy. Cerebrovasc Dis 41: 156–162. [DOI] [PMC free article] [PubMed] [Google Scholar]
- Chen YW, Gurol ME, Rosand J et al. (2006). Progression of white matter lesions and hemorrhages in cerebral amyloid angiopathy. Neurology 67: 83–87. [DOI] [PMC free article] [PubMed] [Google Scholar]
- Chen TF, Lin CC, Chen YF et al. (2009). Diffusion tensor changes in patients with amnesic mild cognitive impairment and various dementias. Psychiatry Res 173: 15–21. [DOI] [PubMed] [Google Scholar]
- Chetelat G, Villemagne VL, Bourgeat P et al. (2010). Relationship between atrophy and beta-amyloid deposition in Alzheimer disease. Ann Neurol 67: 317–324. [DOI] [PubMed] [Google Scholar]
- Chetelat G, Villemagne VL, Villain N et al. (2012). Accelerated cortical atrophy in cognitively normal elderly with high beta-amyloid deposition. Neurology 78: 477–484. [DOI] [PubMed] [Google Scholar]
- Chetelat G, La Joie R, Villain N et al. (2013). Amyloid imaging in cognitively normal individuals, at-risk populations and preclinical Alzheimer’s disease. Neuroimage Clin 2: 356–365. [DOI] [PMC free article] [PubMed] [Google Scholar]
- Chhatwal JP, Schultz AP, Johnson K et al. (2013). Impaired default network functional connectivity in autosomal dominant Alzheimer disease. Neurology 81: 736–744. [DOI] [PMC free article] [PubMed] [Google Scholar]
- Chien DT, Bahri S, Szardenings AK et al. (2013). Early clinical PET imaging results with the novel PHF-tau radio-ligand [F-18]-T807. J Alzheimers Dis 34: 457–468. [DOI] [PubMed] [Google Scholar]
- Chiotis K, Saint-Aubert L, Savitcheva I et al. (2016). Imaging in-vivo tau pathology in Alzheimer’s disease with THK5317 PET in a multimodal paradigm. Eur J Nucl Med Mol Imaging 43: 1686–1699. [DOI] [PMC free article] [PubMed] [Google Scholar]
- Chiotis K, Saint-Aubert L, Rodriguez-Vieitez E et al. (2018). Longitudinal changes of tau PET imaging in relation to hypometabolism in prodromal and Alzheimer’s disease dementia. Mol Psychiatry 23: 1666–1673. [DOI] [PubMed] [Google Scholar]
- Cho H, Jeon S, Kang SJ et al. (2013a). Longitudinal changes of cortical thickness in early- versus late-onset Alzheimer’s disease. Neurobiol Aging 34: 1921: e9–1921.e15. [DOI] [PubMed] [Google Scholar]
- Cho H, Seo SW, Kim JH et al. (2013b). Changes in subcortical structures in early- versus late-onset Alzheimer’s disease. Neurobiol Aging 34: 1740–1747. [DOI] [PubMed] [Google Scholar]
- Cho H, Seo SW, Kim JH et al. (2013c). Amyloid deposition in early onset versus late onset Alzheimer’s disease. J Alzheimers Dis 35: 813–821. [DOI] [PubMed] [Google Scholar]
- Chui HC (2007). Subcortical ischemic vascular dementia. Neurol Clin 25: 717–vi. [DOI] [PMC free article] [PubMed] [Google Scholar]
- Cistaro A, Cuccurullo V, Quartuccio N et al. (2014a). Role of PET and SPECT in the study of amyotrophic lateral sclerosis. Biomed Res Int 2014: 237437. [DOI] [PMC free article] [PubMed] [Google Scholar]
- Cistaro A, Pagani M, Montuschi A et al. (2014b). The metabolic signature of C9ORF72-related ALS: FDG PET comparison with nonmutated patients. Eur J Nucl Med Mol Imaging 41: 844–852. [DOI] [PMC free article] [PubMed] [Google Scholar]
- Claassen DO, Lowe VJ, Peller PJ et al. (2011). Amyloid and glucose imaging in dementia with Lewy bodies and multiple systems atrophy. Parkinsonism Relat Disord 17: 160–165. [DOI] [PubMed] [Google Scholar]
- Clark CM, Pontecorvo MJ, Beach TG et al. (2012). Cerebral PET with florbetapir compared with neuropathology at autopsy for detection of neuritic amyloid-beta plaques: a prospective cohort study. Lancet Neurol 11: 669–678. [DOI] [PubMed] [Google Scholar]
- Cnyrim CD, Kupsch A, Ebersbach G et al. (2014). Diffusion tensor imaging in idiopathic Parkinson’s disease and multisystem atrophy (Parkinsonian type). Neurodegener Dis 13: 1–8. [DOI] [PubMed] [Google Scholar]
- Cochrane CJ, Ebmeier KP (2013). Diffusion tensor imaging in parkinsonian syndromes: a systematic review and meta-analysis. Neurology 80: 857–864. [DOI] [PMC free article] [PubMed] [Google Scholar]
- Cong S, Risacher SL, West JD et al. (2018). Volumetric comparison of hippocampal subfields extracted from 4-minute accelerated vs. 8-minute high-resolution T2-weighted 3T MRI scans. Brain Imaging Behav 12: 1583–1595. [DOI] [PMC free article] [PubMed] [Google Scholar]
- Cooke A, DeVita C, Gee J et al. (2003). Neural basis for sentence comprehension deficits in frontotemporal dementia. Brain Lang 85: 211–221. [DOI] [PubMed] [Google Scholar]
- Curtis C, Gamez JE, Singh U et al. (2015). Phase 3 trial of flutemetamol labeled with radioactive fluorine 18 imaging and neuritic plaque density. JAMA Neurol 72: 287–294. [DOI] [PubMed] [Google Scholar]
- Dean DC 3rd, Jerskey BA, Chen K et al. (2014). Brain differences in infants at differential genetic risk for late-onset Alzheimer disease: a cross-sectional imaging study. JAMA Neurol 71: 11–22. [DOI] [PMC free article] [PubMed] [Google Scholar]
- Dennis NA, Browndyke JN, Stokes J et al. (2010). Temporal lobe functional activity and connectivity in young adult APOE varepsilon4 carriers. Alzheimers Dement 6: 303–311. [DOI] [PMC free article] [PubMed] [Google Scholar]
- Deters KD, Risacher SL, Farlow MR et al. (2014). Cerebral hypometabolism and grey matter density in MAPT intron 10 +3 mutation carriers. Am J Neurodegener Dis 3: 103–114. [PMC free article] [PubMed] [Google Scholar]
- Devanand DP, Bansal R, Liu J et al. (2012). MRI hippocampal and entorhinal cortex mapping in predicting conversion to Alzheimer’s disease. NeuroImage 60: 1622–1629. [DOI] [PMC free article] [PubMed] [Google Scholar]
- Dickerson BC, Salat DH, Greve DN et al. (2005). Increased hippocampal activation in mild cognitive impairment compared to normal aging and AD. Neurology 65: 404–411. [DOI] [PMC free article] [PubMed] [Google Scholar]
- Dickerson BC, Wolk DA, Alzheimer’s Disease Neuroimaging I (2011). Dysexecutive versus amnesic phenotypes of very mild Alzheimer’s disease are associated with distinct clinical, genetic and cortical thinning characteristics. J Neurol Neurosurg Psychiatry 82: 45–51. [DOI] [PMC free article] [PubMed] [Google Scholar]
- Dickerson BC, Wolk DA, Alzheimer’s Disease Neuroimaging Initiative (2012). MRI cortical thickness biomarker predicts AD-like CSF and cognitive decline in normal adults. Neurology 78: 84–90. [DOI] [PMC free article] [PubMed] [Google Scholar]
- Diehl J, Grimmer T, Drzezga A et al. (2004). Cerebral metabolic patterns at early stages of frontotemporal dementia and semantic dementia. A PET study. Neurobiol Aging 25: 1051–1056. [DOI] [PubMed] [Google Scholar]
- Diehl-Schmid J, Grimmer T, Drzezga A et al. (2006). Longitudinal changes of cerebral glucose metabolism in semantic dementia. Dement Geriatr Cogn Disord 22: 346–351. [DOI] [PubMed] [Google Scholar]
- Dierksen GA, Skehan ME, Khan MA et al. (2010). Spatial relation between microbleeds and amyloid deposits in amyloid angiopathy. Ann Neurol 68: 545–548. [DOI] [PMC free article] [PubMed] [Google Scholar]
- Donix M, Burggren AC, Suthana NA et al. (2010a). Family history of Alzheimer’s disease and hippocampal structure in healthy people. Am J Psychiatry 167: 1399–1406. [DOI] [PMC free article] [PubMed] [Google Scholar]
- Donix M, Burggren AC, Suthana NA et al. (2010b). Longitudinal changes in medial temporal cortical thickness in normal subjects with the APOE-4 polymorphism. NeuroImage 53: 37–43. [DOI] [PMC free article] [PubMed] [Google Scholar]
- Dopper EG, Rombouts SA, Jiskoot LC et al. (2013). Structural and functional brain connectivity in presymptomatic familial frontotemporal dementia. Neurology 80: 814–823. [DOI] [PMC free article] [PubMed] [Google Scholar]
- Doraiswamy PM, Sperling RA, Johnson K et al. (2014). Florbetapir F 18 amyloid PET and 36-month cognitive decline: a prospective multicenter study. Mol Psychiatry 19: 1044–1051. [DOI] [PMC free article] [PubMed] [Google Scholar]
- Douaud G, Filippini N, Knight S et al. (2011). Integration of structural and functional magnetic resonance imaging in amyotrophic lateral sclerosis. Brain 134: 3470–3479. [DOI] [PubMed] [Google Scholar]
- Douaud G, Menke RA, Gass A et al. (2013). Brain microstructure reveals early abnormalities more than two years prior to clinical progression from mild cognitive impairment to Alzheimer’s disease. J Neurosci 33: 2147–2155. [DOI] [PMC free article] [PubMed] [Google Scholar]
- Doubal FN, MacLullich AM, Ferguson KJ et al. (2010). Enlarged perivascular spaces on MRI are a feature of cerebral small vessel disease. Stroke 41: 450–454. [DOI] [PubMed] [Google Scholar]
- Dronse J, Fliessbach K, Bischof GN et al. (2017). In vivo patterns of tau pathology, amyloid-beta burden, and neuronal dysfunction in clinical variants of Alzheimer’s disease. J Alzheimers Dis 55: 465–471. [DOI] [PubMed] [Google Scholar]
- Drzezga A, Grimmer T, Siebner H et al. (2002). Prominent hypometabolism of the right temporoparietal and frontal cortex in two left-handed patients with primary progressive aphasia. J Neurol 249: 1263–1267. [DOI] [PubMed] [Google Scholar]
- Du AT, Schuff N, Laakso MP et al. (2002). Effects of subcortical ischemic vascular dementia and AD on entorhinal cortex and hippocampus. Neurology 58: 1635–1641. [DOI] [PMC free article] [PubMed] [Google Scholar]
- Duara R, Barker W, Loewenstein D et al. (1989). Sensitivity and specificity of positron emission tomography and magnetic resonance imaging studies in Alzheimer’s disease and multi-infarct dementia. Eur Neurol 29: 9–15. [DOI] [PubMed] [Google Scholar]
- Dumas A, Dierksen GA, Gurol ME et al. (2012). Functional magnetic resonance imaging detection of vascular reactivity in cerebral amyloid angiopathy. Ann Neurol 72: 76–81. [DOI] [PMC free article] [PubMed] [Google Scholar]
- Ebmeier KP, Filippini N, Heise V et al. (2011). Other magnetic resonance imaging techniques. Int Psychogeriatr 23: S50–S57. [DOI] [PubMed] [Google Scholar]
- Eckerstrom C, Olsson E, Klasson N et al. (2011). High white matter lesion load is associated with hippocampal atrophy in mild cognitive impairment. Dement Geriatr Cogn Disord 31: 132–138. [DOI] [PubMed] [Google Scholar]
- Eckert T, Barnes A, Dhawan V et al. (2005). FDG PET in the differential diagnosis of parkinsonian disorders. NeuroImage 26: 912–921. [DOI] [PubMed] [Google Scholar]
- Edison P, Rowe CC, Rinne JO et al. (2008). Amyloid load in Parkinson’s disease dementia and Lewy body dementia measured with [11C]PIB positron emission tomography. J Neurol Neurosurg Psychiatry 79: 1331–1338. [DOI] [PubMed] [Google Scholar]
- Erbetta A, Mandelli ML, Savoiardo M et al. (2009). Diffusion tensor imaging shows different topographic involvement of the thalamus in progressive supranuclear palsy and corticobasal degeneration. AJNR Am J Neuroradiol 30: 1482–1487. [DOI] [PMC free article] [PubMed] [Google Scholar]
- Erk S, Spottke A, Meisen A et al. (2011). Evidence of neuronal compensation during episodic memory in subjective memory impairment. Arch Gen Psychiatry 68: 845–852. [DOI] [PubMed] [Google Scholar]
- Ewers M, Brendel M, Rizk-Jackson A et al. (2014). Reduced FDG-PET brain metabolism and executive function predict clinical progression in elderly healthy subjects. Neuroimage Clin 4: 45–52. [DOI] [PMC free article] [PubMed] [Google Scholar]
- Farb NA, Grady CL, Strother S et al. (2013). Abnormal network connectivity in frontotemporal dementia: evidence for prefrontal isolation. Cortex 49: 1856–1873. [DOI] [PubMed] [Google Scholar]
- Fein G, Di Sclafani V, Tanabe J et al. (2000). Hippocampal and cortical atrophy predict dementia in subcortical ischemic vascular disease. Neurology 55: 1626–1635. [DOI] [PMC free article] [PubMed] [Google Scholar]
- Ferrari R, Kapogiannis D, Huey ED et al. (2011). FTD and ALS: a tale of two diseases. Curr Alzheimer Res 8: 273–294. [DOI] [PMC free article] [PubMed] [Google Scholar]
- Filippi M, Agosta F, Barkhof F et al. (2012). EFNS task force: the use of neuroimaging in the diagnosis of dementia. Eur J Neurol 19: e131–e140. 1487–1501. [DOI] [PubMed] [Google Scholar]
- Filippi M, Agosta F, Scola E et al. (2013). Functional network connectivity in the behavioral variant of frontotemporal dementia. Cortex 49: 2389–2401. [DOI] [PubMed] [Google Scholar]
- Filippini N, MacIntosh BJ, Hough MG et al. (2009). Distinct patterns of brain activity in young carriers of the APOE-epsilon4 allele. Proc Natl Acad Sci USA 106: 7209–7214. [DOI] [PMC free article] [PubMed] [Google Scholar]
- Firbank MJ, Blamire AM, Teodorczuk A et al. (2010). High resolution imaging of the medial temporal lobe in Alzheimer’s disease and dementia with Lewy bodies. J Alzheimers Dis 21: 1129–1140. [DOI] [PubMed] [Google Scholar]
- Fodero-Tavoletti MT, Brockschnieder D, Villemagne VL et al. (2012). In vitro characterization of [18F]-florbetaben, an Aβ imaging radiotracer. Nucl Med Biol 39: 1042–1048. [DOI] [PubMed] [Google Scholar]
- Forsberg A, Engler H, Almkvist O et al. (2008). PET imaging of amyloid deposition in patients with mild cognitive impairment. Neurobiol Aging 29: 1456–1465. [DOI] [PubMed] [Google Scholar]
- Foster NL, Heidebrink JL, Clark CM et al. (2007). FDG-PET improves accuracy in distinguishing frontotemporal dementia and Alzheimer’s disease. Brain 130: 2616–2635. [DOI] [PubMed] [Google Scholar]
- Fox NC, Warrington EK, Stevens JM et al. (1996). Atrophy of the hippocampal formation in early familial Alzheimer’s disease. A longitudinal MRI study of at-risk members of a family with an amyloid precursor protein 717Val-Gly mutation. Ann N Y Acad Sci 777: 226–232. [DOI] [PubMed] [Google Scholar]
- Fox NC, Cousens S, Scahill R et al. (2000). Using serial registered brain magnetic resonance imaging to measure disease progression in Alzheimer disease: power calculations and estimates of sample size to detect treatment effects. Arch Neurol 57: 339–344. [DOI] [PubMed] [Google Scholar]
- Franciotti R, Falasca NW, Bonanni L et al. (2013). Default network is not hypoactive in dementia with fluctuating cognition: an Alzheimer disease/dementia with Lewy bodies comparison. Neurobiol Aging 34: 1148–1158. [DOI] [PubMed] [Google Scholar]
- Frisoni GB, Pievani M, Testa C et al. (2007). The topography of grey matter involvement in early and late onset Alzheimer’s disease. Brain 130: 720–730. [DOI] [PubMed] [Google Scholar]
- Frisoni GB, Prestia A, Rasser PE et al. (2009). In vivo mapping of incremental cortical atrophy from incipient to overt Alzheimer’s disease. J Neurol 256: 916–924. [DOI] [PubMed] [Google Scholar]
- Gahr M, Nowak DA, Connemann BJ et al. (2013). Cerebral amyloidal angiopathy—a disease with implications for neurology and psychiatry. Brain Res 1519: 19–30. [DOI] [PubMed] [Google Scholar]
- Galvin JE, Price JL, Yan Z et al. (2011). Resting bold fMRI differentiates dementia with Lewy bodies vs Alzheimer disease. Neurology 76: 1797–1803. [DOI] [PMC free article] [PubMed] [Google Scholar]
- Gerardin E, Chetelat G, Chupin M et al. (2009). Multidimensional classification of hippocampal shape features discriminates Alzheimer’s disease and mild cognitive impairment from normal aging. NeuroImage 47: 1476–1486. [DOI] [PMC free article] [PubMed] [Google Scholar]
- Gillebert CR, Schaeverbeke J, Bastin C et al. (2015). 3D shape perception in posterior cortical atrophy: a visual neuroscience perspective. J Neurosci 35: 12673–12692. [DOI] [PMC free article] [PubMed] [Google Scholar]
- Gilman S, Koeppe RA, Little R et al. (2004). Striatal monoamine terminals in Lewy body dementia and Alzheimer’s disease. Ann Neurol 55: 774–780. [DOI] [PubMed] [Google Scholar]
- Goll JC, Ridgway GR, Crutch SJ et al. (2012). Nonverbal sound processing in semantic dementia: a functional MRI study. NeuroImage 61: 170–180. [DOI] [PMC free article] [PubMed] [Google Scholar]
- Gomperts SN, Rentz DM, Moran E et al. (2008). Imaging amyloid deposition in Lewy body diseases. Neurology 71: 903–910. [DOI] [PMC free article] [PubMed] [Google Scholar]
- Gomperts SN, Locascio JJ, Rentz D et al. (2013). Amyloid is linked to cognitive decline in patients with Parkinson disease without dementia. Neurology 80: 85–91. [DOI] [PMC free article] [PubMed] [Google Scholar]
- Gomperts SN, Locascio JJ, Makaretz SJ et al. (2016). Tau positron emission tomographic imaging in the Lewy body diseases. JAMA Neurol 73: 1334–1341. [DOI] [PMC free article] [PubMed] [Google Scholar]
- Gorno-Tempini ML, Hillis AE, Weintraub S et al. (2011). Classification of primary progressive aphasia and its variants. Neurology 76: 1006–1014. [DOI] [PMC free article] [PubMed] [Google Scholar]
- Gottlich M, Munte TF, Heldmann M et al. (2013). Altered resting state brain networks in Parkinson’s disease. PLoS One 8: e77336. [DOI] [PMC free article] [PubMed] [Google Scholar]
- Gour N, Felician O, Didic M et al. (2014). Functional connectivity changes differ in early and late-onset Alzheimer’s disease. Hum Brain Mapp 35: 2978–2994. [DOI] [PMC free article] [PubMed] [Google Scholar]
- Greicius MD, Srivastava G, Reiss AL et al. (2004). Default-mode network activity distinguishes Alzheimer’s disease from healthy aging: evidence from functional MRI. Proc Natl Acad Sci USA 101: 4637–4642. [DOI] [PMC free article] [PubMed] [Google Scholar]
- Grothe M, Heinsen H, Teipel SJ (2012). Atrophy of the cholinergic basal forebrain over the adult age range and in early stages of Alzheimer’s disease. Biol Psychiatry 71: 805–813. [DOI] [PMC free article] [PubMed] [Google Scholar]
- Grothe M, Heinsen H, Teipel S (2013). Longitudinal measures of cholinergic forebrain atrophy in the transition from healthy aging to Alzheimer’s disease. Neurobiol Aging 34: 1210–1220. [DOI] [PMC free article] [PubMed] [Google Scholar]
- Grothe MJ, Schuster C, Bauer F et al. (2014). Atrophy of the cholinergic basal forebrain in dementia with Lewy bodies and Alzheimer’s disease dementia. J Neurol 261: 1939–1948. [DOI] [PubMed] [Google Scholar]
- Gurol ME, Dierksen G, Betensky R et al. (2012). Predicting sites of new hemorrhage with amyloid imaging in cerebral amyloid angiopathy. Neurology 79: 320–326. [DOI] [PMC free article] [PubMed] [Google Scholar]
- Hansen AK, Knudsen K, Lillethorup TP et al. (2016). In vivo imaging of neuromelanin in Parkinson’s disease using 18F-AV-1451 PET. Brain 139: 2039–2049. [DOI] [PubMed] [Google Scholar]
- Hanyu H, Tanaka Y, Shimizu S et al. (2005). Differences in MR features of the substantia innominata between dementia with Lewy bodies and Alzheimer’s disease. J Neurol 252: 482–484. [DOI] [PubMed] [Google Scholar]
- Harrington MG, Chiang J, Pogoda JM et al. (2013). Executive function changes before memory in preclinical Alzheimer’s pathology: a prospective, cross-sectional, case control study. PLoS One 8: e79378. [DOI] [PMC free article] [PubMed] [Google Scholar]
- He W, Liu D, Radua J et al. (2015). Meta-analytic comparison between PIB-PET and FDG-PET results in Alzheimer’s disease and MCI. Cell Biochem Biophys 71: 17–26. [DOI] [PubMed] [Google Scholar]
- Heise V, Filippini N, Ebmeier KP et al. (2011). The APOE varepsilon4 allele modulates brain white matter integrity in healthy adults. Mol Psychiatry 16: 908–916. [DOI] [PubMed] [Google Scholar]
- Heiss WD, Zimmermann-Meinzingen S (2012). PET imaging in the differential diagnosis of vascular dementia. J Neurol Sci 322: 268–273. [DOI] [PubMed] [Google Scholar]
- Herholz K, Nordberg A, Salmon E et al. (1999). Impairment of neocortical metabolism predicts progression in Alzheimer’s disease. Dement Geriatr Cogn Disord 10: 494–504. [DOI] [PubMed] [Google Scholar]
- Holland CM, Smith EE, Csapo I et al. (2008). Spatial distribution of white-matter hyperintensities in Alzheimer disease, cerebral amyloid angiopathy, and healthy aging. Stroke 39: 1127–1133. [DOI] [PMC free article] [PubMed] [Google Scholar]
- Honea RA, Swerdlow RH, Vidoni ED et al. (2011). Progressive regional atrophy in normal adults with a maternal history of Alzheimer disease. Neurology 76: 822–829. [DOI] [PMC free article] [PubMed] [Google Scholar]
- Hornberger M, Savage S, Hsieh S et al. (2010). Orbitofrontal dysfunction discriminates behavioral variant frontotemporal dementia from Alzheimer’s disease. Dement Geriatr Cogn Disord 30: 547–552. [DOI] [PubMed] [Google Scholar]
- Hsu PJ, Shou H, Benzinger T et al. (2015). Amyloid burden in cognitively normal elderly is associated with preferential hippocampal subfield volume loss. J Alzheimers Dis 45: 27–33. [DOI] [PMC free article] [PubMed] [Google Scholar]
- Hu XS, Okamura N, Arai H et al. (2000). 18F-fluorodopa PET study of striatal dopamine uptake in the diagnosis of dementia with Lewy bodies. Neurology 55: 1575–1577. [DOI] [PubMed] [Google Scholar]
- Ikonomovic MD, Klunk WE, Abrahamson EE et al. (2008). Post-mortem correlates of in vivo PiB-PET amyloid imaging in a typical case of Alzheimer’s disease. Brain 131: 1630–1645. [DOI] [PMC free article] [PubMed] [Google Scholar]
- Ishiki A, Okamura N, Furukawa K et al. (2015). Longitudinal assessment of tau pathology in patients with Alzheimer’s disease using [18F]THK-5117 positron emission tomography. PLoS One 10: e0140311. [DOI] [PMC free article] [PubMed] [Google Scholar]
- Jack CR Jr, Petersen RC, O’Brien PC et al. (1992). MR-based hippocampal volumetry in the diagnosis of Alzheimer’s disease. Neurology 42: 183–188. [DOI] [PubMed] [Google Scholar]
- Jack CR Jr, Lowe VJ, Weigand SD et al. (2009). Serial PIB and MRI in normal, mild cognitive impairment and Alzheimer’s disease: implications for sequence of pathological events in Alzheimer’s disease. Brain 132: 1355–1365. [DOI] [PMC free article] [PubMed] [Google Scholar]
- Jack CR Jr, Knopman DS, Jagust WJ et al. (2013). Tracking pathophysiological processes in Alzheimer’s disease: an updated hypothetical model of dynamic biomarkers. Lancet Neurol 12: 207–216. [DOI] [PMC free article] [PubMed] [Google Scholar]
- Jack CR Jr, Wiste HJ, Weigand SD et al. (2015). Age, sex, and APOE epsilon4 effects on memory, brain structure, and beta-amyloid across the adult life span. JAMA Neurol 72: 511–519. [DOI] [PMC free article] [PubMed] [Google Scholar]
- Jagust WJ, Zheng L, Harvey DJ et al. (2008). Neuropathological basis of magnetic resonance images in aging and dementia. Ann Neurol 63: 72–80. [DOI] [PMC free article] [PubMed] [Google Scholar]
- Jessen F, Amariglio RE, van Boxtel M et al. (2014). A conceptual framework for research on subjective cognitive decline in preclinical Alzheimer’s disease. Alzheimers Dement 10: 844–852. [DOI] [PMC free article] [PubMed] [Google Scholar]
- Johansen KK, White LR, Sando SB et al. (2010). Biomarkers: Parkinson disease with dementia and dementia with Lewy bodies. Parkinsonism Relat Disord 16: 307–315. [DOI] [PubMed] [Google Scholar]
- Johnson SC, Baxter LC, Susskind-Wilder L et al. (2004). Hippocampal adaptation to face repetition in healthy elderly and mild cognitive impairment. Neuropsychologia 4–2: 980–989. [DOI] [PubMed] [Google Scholar]
- Johnson SC, Schmitz TW, Trivedi MA et al. (2006). The influence of Alzheimer disease family history and apolipoprotein E epsilon4 on mesial temporal lobe activation. J Neurosci 26: 6069–6076. [DOI] [PMC free article] [PubMed] [Google Scholar]
- Johnson KA, Minoshima S, Bohnen NI et al. (2013a). Appropriate use criteria for amyloid PET: a report of the Amyloid Imaging Task Force, the Society of Nuclear Medicine and Molecular Imaging, and the Alzheimer’s Association. J Nucl Med 54: 476–490. [DOI] [PubMed] [Google Scholar]
- Johnson KA, Minoshima S, Bohnen NI et al. (2013b). Update on appropriate use criteria for amyloid PET imaging: dementia experts, mild cognitive impairment, and education. J Nucl Med 54: 1011–1013. [DOI] [PubMed] [Google Scholar]
- Johnson SC, Christian BT, Okonkwo OC et al. (2014). Amyloid burden and neural function in people at risk for Alzheimer’s Disease. Neurobiol Aging 35: 576–584. [DOI] [PMC free article] [PubMed] [Google Scholar]
- Johnson KA, Schultz A, Betensky RA et al. (2016). Tau positron emission tomographic imaging in aging and early Alzheimer disease. Ann Neurol 79: 110–119. [DOI] [PMC free article] [PubMed] [Google Scholar]
- Jones DT, Knopman DS, Graff-Radford J et al. (2018). In vivo (18)F-AV-1451 tau-PET signal in MAPT mutation carriers varies by expected tau isoforms. Neurology 90: e947–e954. [DOI] [PMC free article] [PubMed] [Google Scholar]
- Josephs KA, Whitwell JL, Dickson DW et al. (2008). Voxel-based morphometry in autopsy proven PSP and CBD. Neurobiol Aging 29: 280–289. [DOI] [PMC free article] [PubMed] [Google Scholar]
- Josephs KA, Duffy JR, Strand EA et al. (2014). Progranulin-associated PiB-negative logopenic primary progressive aphasia. J Neurol 261: 604–614. [DOI] [PMC free article] [PubMed] [Google Scholar]
- Junque C, Ramirez-Ruiz B, Tolosa E et al. (2005). Amygdalar and hippocampal MRI volumetric reductions in Parkinson’s disease with dementia. Mov Disord 20: 540–544. [DOI] [PubMed] [Google Scholar]
- Kantarci K, Avula R, Senjem ML et al. (2010). Dementia with Lewy bodies and Alzheimer disease: neurodegenerative patterns characterized by DTI. Neurology 74: 1814–1821. [DOI] [PMC free article] [PubMed] [Google Scholar]
- Kantarci K, Ferman TJ, Boeve BF et al. (2012a). Focal atrophy on MRI and neuropathologic classification of dementia with Lewy bodies. Neurology 79: 553–560. [DOI] [PMC free article] [PubMed] [Google Scholar]
- Kantarci K, Lowe VJ, Boeve BF et al. (2012b). Multimodality imaging characteristics of dementia with Lewy bodies. Neurobiol Aging 33: 2091–2105. [DOI] [PMC free article] [PubMed] [Google Scholar]
- Kantarci K, Weigand SD, Przybelski SA et al. (2013). MRI and MRS predictors of mild cognitive impairment in a population-based sample. Neurology 81: 126–133. [DOI] [PMC free article] [PubMed] [Google Scholar]
- Kennedy AM, Frackowiak RS, Newman SK et al. (1995). Deficits in cerebral glucose metabolism demonstrated by positron emission tomography in individuals at risk of familial Alzheimer’s disease. Neurosci Lett 186: 17–20. [DOI] [PubMed] [Google Scholar]
- Kenny ER, Burton EJ, O’Brien JT (2008). A volumetric magnetic resonance imaging study of entorhinal cortex volume in dementia with lewy bodies. A comparison with Alzheimer’s disease and Parkinson’s disease with and without dementia. Dement Geriatr Cogn Disord 26: 218–225. [DOI] [PubMed] [Google Scholar]
- Kerrouche N, Herholz K, Mielke R et al. (2006). 18FDG PET in vascular dementia: differentiation from Alzheimer’s disease using voxel-based multivariate analysis. J Cereb Blood Flow Metab 26: 1213–1221. [DOI] [PubMed] [Google Scholar]
- Khan W, Westman E, Jones N et al. (2015). Automated hippocampal subfield measures as predictors of conversion from mild cognitive impairment to Alzheimer’s disease in two independent cohorts. Brain Topogr 28: 746–759. [DOI] [PMC free article] [PubMed] [Google Scholar]
- Kikuchi A, Okamura N, Hasegawa T et al. (2016). In vivo visualization of tau deposits in corticobasal syndrome by 18F-THK5351 PET. Neurology 87: 2309–2316. [DOI] [PMC free article] [PubMed] [Google Scholar]
- Kim SH, Park JS, Ahn HJ et al. (2011). Voxel-based analysis of diffusion tensor imaging in patients with subcortical vascular cognitive impairment: correlates with cognitive and motor deficits. J Neuroimaging 21: 317–324. [DOI] [PubMed] [Google Scholar]
- Kim HJ, Cho H, Werring DJ et al. (2017). 18F-AV-1451 PET imaging in three patients with probable cerebral amyloid angiopathy. J Alzheimers Dis 57: 711–716. [DOI] [PubMed] [Google Scholar]
- Kimberly WT, Gilson A, Rost NS et al. (2009). Silent ischemic infarcts are associated with hemorrhage burden in cerebral amyloid angiopathy. Neurology 72: 1230–1235. [DOI] [PMC free article] [PubMed] [Google Scholar]
- Klunk WE, Engler H, Nordberg A et al. (2004). Imaging brain amyloid in Alzheimer’s disease with Pittsburgh Compound-B. Ann Neurol 55: 306–319. [DOI] [PubMed] [Google Scholar]
- Klunk WE, Price JC, Mathis CA et al. (2007). Amyloid deposition begins in the striatum of presenilin-1 mutation carriers from two unrelated pedigrees. J Neurosci 27: 6174–6184. [DOI] [PMC free article] [PubMed] [Google Scholar]
- Knopman DS, Jack CR Jr, Wiste HJ et al. (2014). 18F-fluorodeoxyglucose positron emission tomography, aging, and apolipoprotein E genotype in cognitively normal persons. Neurobiol Aging 35: 2096–2106. [DOI] [PMC free article] [PubMed] [Google Scholar]
- Ko JH, Lee CS, Eidelberg D (2016). Metabolic network expression in parkinsonism: clinical and dopaminergic correlations. J Cereb Blood Flow Metab. [DOI] [PMC free article] [PubMed] [Google Scholar]
- Koedam EL, Van der Flier WM, Barkhof F et al. (2010). Clinical characteristics of patients with frontotemporal dementia with and without lobar atrophy on MRI. Alzheimer Dis Assoc Disord 24: 242–247. [DOI] [PubMed] [Google Scholar]
- Koedam EL, Lehmann M, van der Flier WM et al. (2011). Visual assessment of posterior atrophy development of a MRI rating scale. Eur Radiol 21: 2618–2625. [DOI] [PMC free article] [PubMed] [Google Scholar]
- Krueger CE, Dean DL, Rosen HJ et al. (2010). Longitudinal rates of lobar atrophy in frontotemporal dementia, semantic dementia, and Alzheimer’s disease. Alzheimer Dis Assoc Disord 24: 43–48. [DOI] [PMC free article] [PubMed] [Google Scholar]
- Kwak Y, Peltier S, Bohnen NI et al. (2010). Altered resting state cortico-striatal connectivity in mild to moderate stage Parkinson’s disease. Front Syst Neurosci 4: 143. [DOI] [PMC free article] [PubMed] [Google Scholar]
- Laakso MP, Soininen H, Partanen K et al. (1995). Volumes of hippocampus, amygdala and frontal lobes in the MRI-based diagnosis of early Alzheimer’s disease: correlation with memory functions. J Neural Transm Park Dis Dement Sect 9: 73–86. [DOI] [PubMed] [Google Scholar]
- Laforce R Jr, Tosun D, Ghosh P et al. (2014). Parallel ICA of FDG-PET and PiB-PET in three conditions with underlying Alzheimer’s pathology. Neuroimage Clin 4: 508–516. [DOI] [PMC free article] [PubMed] [Google Scholar]
- Landau SM, Harvey D, Madison CM et al. (2010). Comparing predictors of conversion and decline in mild cognitive impairment. Neurology 75: 230–238. [DOI] [PMC free article] [PubMed] [Google Scholar]
- Langbaum JB, Chen K, Lee W et al. (2009). Categorical and correlational analyses of baseline fluorodeoxyglucose positron emission tomography images from the Alzheimer’s Disease Neuroimaging Initiative (ADNI). NeuroImage 45: 1107–1116. [DOI] [PMC free article] [PubMed] [Google Scholar]
- Langbaum JB, Chen K, Caselli RJ et al. (2010). Hypometabolism in Alzheimer-affected brain regions in cognitively healthy Latino individuals carrying the apolipoprotein E epsilon4 allele. Arch Neurol 67: 462–468. [DOI] [PMC free article] [PubMed] [Google Scholar]
- Lee JE, Park B, Song SK et al. (2010). A comparison of gray and white matter density in patients with Parkinson’s disease dementia and dementia with Lewy bodies using voxel-based morphometry. Mov Disord 25: 28–34. [DOI] [PubMed] [Google Scholar]
- Lee S, Viqar F, Zimmerman ME et al. (2016). White matter hyperintensities are a core feature of Alzheimer’s disease: Evidence from the dominantly inherited Alzheimer network. Ann Neurol 79: 929–939. [DOI] [PMC free article] [PubMed] [Google Scholar]
- Lehmann M, Madison CM, Ghosh PM et al. (2013). Intrinsic connectivity networks in healthy subjects explain clinical variability in Alzheimer’s disease. Proc Natl Acad Sci USA 110: 11606–11611. [DOI] [PMC free article] [PubMed] [Google Scholar]
- Lehmann M, Madison C, Ghosh PM et al. (2015). Loss of functional connectivity is greater outside the default mode network in nonfamilial early-onset Alzheimer’s disease variants. Neurobiol Aging 36: 2678–2686. [DOI] [PMC free article] [PubMed] [Google Scholar]
- Lemoine L, Gillberg PG, Svedberg M et al. (2017). Comparative binding properties of the tau PET tracers THK5117, THK5351, PBB3, and T807 in postmortem Alzheimer brains. Alzheimers Res Ther 9: 96. [DOI] [PMC free article] [PubMed] [Google Scholar]
- Li C, Zheng J, Wang J et al. (2011). Comparison between Alzheimer’s disease and subcortical vascular dementia: attentional cortex study in functional magnetic resonance imaging. J Int Med Res 39: 1413–1419. [DOI] [PubMed] [Google Scholar]
- Li C, Liu C, Yin X et al. (2014). Frequency-dependent changes in the amplitude of low-frequency fluctuations in subcortical ischemic vascular disease (SIVD): a resting-state fMRI study. Behav Brain Res 274: 205–210. [DOI] [PubMed] [Google Scholar]
- Li HJ, Hou XH, Liu HH et al. (2015). Toward systems neuroscience in mild cognitive impairment and Alzheimer’s disease: a meta-analysis of 75 fMRI studies. Hum Brain Mapp 36: 1217–1232. [DOI] [PMC free article] [PubMed] [Google Scholar]
- Liang KY, Mintun MA, Fagan AM et al. (2010). Exercise and Alzheimer’s disease biomarkers in cognitively normal older adults. Ann Neurol 68: 311–318. [DOI] [PMC free article] [PubMed] [Google Scholar]
- Lim JS, Park YH, Jang JW et al. (2014). Differential white matter connectivity in early mild cognitive impairment according to CSF biomarkers. PLoS One 9: e91400. [DOI] [PMC free article] [PubMed] [Google Scholar]
- Lim YY, Villemagne VL, Pietrzak RH et al. (2015). APOE epsilon4 moderates amyloid-related memory decline in preclinical Alzheimer’s disease. Neurobiol Aging 36: 1239–1244. [DOI] [PubMed] [Google Scholar]
- Liscic RM, Srulijes K, Groger A et al. (2013). Differentiation of progressive supranuclear palsy: clinical, imaging and laboratory tools. Acta Neurol Scand 127: 362–370. [DOI] [PubMed] [Google Scholar]
- Liu CY, Krishnan AP, Yan L et al. (2013). Complexity and synchronicity of resting state blood oxygenation level-dependent (BOLD) functional MRI in normal aging and cognitive decline. J Magn Reson Imaging 38: 36–45. [DOI] [PMC free article] [PubMed] [Google Scholar]
- Liu C, Li C, Yin X et al. (2014). Abnormal intrinsic brain activity patterns in patients with subcortical ischemic vascular dementia. PLoS One 9: e87880. [DOI] [PMC free article] [PubMed] [Google Scholar]
- Luo C, Song W, Chen Q et al. (2014). Reduced functional connectivity in early-stage drug-naive Parkinson’s disease: a resting-state fMRI study. Neurobiol Aging 35: 431–441. [DOI] [PubMed] [Google Scholar]
- Madhavan A, Whitwell JL, Weigand SD et al. (2013). FDG PET and MRI in logopenic primary progressive aphasia versus dementia of the Alzheimer’s type. PLoS One 8: e62471. [DOI] [PMC free article] [PubMed] [Google Scholar]
- Madhavan A, Schwarz CG, Duffy JR et al. (2015). Characterizing white matter tract degeneration in syndromic variants of Alzheimer’s disease: a diffusion tensor imaging study. J Alzheimers Dis 49: 633–643. [DOI] [PMC free article] [PubMed] [Google Scholar]
- Magnin E, Cattin F, Vandel P et al. (2012). Fractional anisotropy in three variants of primary progressive aphasia. Eur Neurol 68: 229–233. [DOI] [PubMed] [Google Scholar]
- Maguire EA, Kumaran D, Hassabis D et al. (2010). Autobiographical memory in semantic dementia: a longitudinal fMRI study. Neuropsychologia 48: 123–136. [DOI] [PMC free article] [PubMed] [Google Scholar]
- Mahoney CJ, Simpson IJ, Nicholas JM et al. (2015). Longitudinal diffusion tensor imaging in frontotemporal dementia. Ann Neurol 77: 33–46. [DOI] [PMC free article] [PubMed] [Google Scholar]
- Manning EN, Macdonald KE, Leung KK et al. (2015). Differential hippocampal shapes in posterior cortical atrophy patients: a comparison with control and typical AD subjects. Hum Brain Mapp 36: 5123–5136. [DOI] [PMC free article] [PubMed] [Google Scholar]
- Marks SM, Lockhart SN, Baker SL et al. (2017). Tau and beta-amyloid are associated with medial temporal lobe structure, function, and memory encoding in normal aging. J Neurosci 37: 3192–3201. [DOI] [PMC free article] [PubMed] [Google Scholar]
- McGinnis SM (2012). Neuroimaging in neurodegenerative dementias. Semin Neurol 32: 347–360. [DOI] [PubMed] [Google Scholar]
- McKeith IG, Dickson DW, Lowe J et al. (2005). Diagnosis and management of dementia with Lewy bodies: third report of the DLB consortium. Neurology 65: 1863–1872. [DOI] [PubMed] [Google Scholar]
- McKhann GM, Knopman DS, Chertkow H et al. (2011). The diagnosis of dementia due to Alzheimer’s disease: recommendations from the National Institute on Aging-Alzheimer’s Association workgroups on diagnostic guidelines for Alzheimer’s disease. Alzheimers Dement 7: 263–269. [DOI] [PMC free article] [PubMed] [Google Scholar]
- Melzer TR, Watts R, MacAskill MR et al. (2013). White matter microstructure deteriorates across cognitive stages in Parkinson disease. Neurology 80: 1841–1849. [DOI] [PubMed] [Google Scholar]
- Mestre TA, Gupta A, Lang AE (2016). MRI signs of multiple system atrophy preceding the clinical diagnosis: the case for an imaging-supported probable MSA diagnostic category. J Neurol Neurosurg Psychiatry 87: 443–444. [DOI] [PubMed] [Google Scholar]
- Migliaccio R, Gallea C, Kas A et al. (2016). Functional connectivity of ventral and dorsal visual streams in posterior cortical atrophy. J Alzheimers Dis 51: 1119–1130. [DOI] [PubMed] [Google Scholar]
- Minoshima S, Foster NL, Sima AA et al. (2001). Alzheimer’s disease versus dementia with Lewy bodies: cerebral metabolic distinction with autopsy confirmation. Ann Neurol 50: 358–365. [DOI] [PubMed] [Google Scholar]
- Mohammadi B, Kollewe K, Samii A et al. (2009). Changes of resting state brain networks in amyotrophic lateral sclerosis. Exp Neurol 217: 147–153. [DOI] [PubMed] [Google Scholar]
- Molinuevo JL, Ripolles P, Simo M et al. (2014). White matter changes in preclinical Alzheimer’s disease: a magnetic resonance imaging-diffusion tensor imaging study on cognitively normal older people with positive amyloid beta protein 42 levels. Neurobiol Aging 35: 2671–2680. [DOI] [PubMed] [Google Scholar]
- Moller C, van der Flier WM, Versteeg A et al. (2014). Quantitative regional validation of the visual rating scale for posterior cortical atrophy. Eur Radiol 24: 397–404. [DOI] [PubMed] [Google Scholar]
- Moller C, Dieleman N, van der Flier WM et al. (2015). More atrophy of deep gray matter structures in frontotemporal dementia compared to Alzheimer’s disease. J Alzheimers Dis 44: 635–647. [DOI] [PubMed] [Google Scholar]
- Monchi O, Petrides M, Doyon J et al. (2004). Neural bases of set-shifting deficits in Parkinson’s disease. J Neurosci 24: 702–710. [DOI] [PMC free article] [PubMed] [Google Scholar]
- Mormino EC, Kluth JT, Madison CM et al. (2009). Episodic memory loss is related to hippocampal-mediated beta-amyloid deposition in elderly subjects. Brain 132: 1310–1323. [DOI] [PMC free article] [PubMed] [Google Scholar]
- Mosconi L, Sorbi S, de Leon MJ et al. (2006). Hypometabolism exceeds atrophy in presymptomatic early-onset familial Alzheimer’s disease. J Nucl Med 47: 1778–1786. [PubMed] [Google Scholar]
- Mosconi L, Brys M, Switalski R et al. (2007). Maternal family history of Alzheimer’s disease predisposes to reduced brain glucose metabolism. Proc Natl Acad Sci USA 104: 19067–19072. [DOI] [PMC free article] [PubMed] [Google Scholar]
- Mosconi L, De Santi S, Li J et al. (2008). Hippocampal hypometabolism predicts cognitive decline from normal aging. Neurobiol Aging 29: 676–692. [DOI] [PMC free article] [PubMed] [Google Scholar]
- Mosconi L, Rinne JO, Tsui WH et al. (2010). Increased fibrillar amyloid-{beta} burden in normal individuals with a family history of late-onset Alzheimer’s. Proc Natl Acad Sci USA 107: 5949–5954. [DOI] [PMC free article] [PubMed] [Google Scholar]
- Mosconi L, Murray J, Tsui WH et al. (2014). Brain imaging of cognitively normal individuals with 2 parents affected by late-onset AD. Neurology 82: 752–760. [DOI] [PMC free article] [PubMed] [Google Scholar]
- Mueller SG, Weiner MW (2009). Selective effect of age, Apo e4, and Alzheimer’s disease on hippocampal subfields. Hippocampus 19: 558–564. [DOI] [PMC free article] [PubMed] [Google Scholar]
- Mummery CJ, Patterson K, Price CJ et al. (2000). A voxel-based morphometry study of semantic dementia: relationship between temporal lobe atrophy and semantic memory. Ann Neurol 47: 36–45. [PubMed] [Google Scholar]
- Mungas D, Jagust WJ, Reed BR et al. (2001). MRI predictors of cognition in subcortical ischemic vascular disease and Alzheimer’s disease. Neurology 57: 2229–2235. [DOI] [PMC free article] [PubMed] [Google Scholar]
- Murray ME, Graff-Radford NR, Ross OA et al. (2011). Neuropathologically defined subtypes of Alzheimer’s disease with distinct clinical characteristics: a retrospective study. Lancet Neurol 10: 785–796. [DOI] [PMC free article] [PubMed] [Google Scholar]
- Nestor PJ, Caine D, Fryer TD et al. (2003a). The topography of metabolic deficits in posterior cortical atrophy (the visual variant of Alzheimer’s disease) with FDG-PET. J Neurol Neurosurg Psychiatry 74: 1521–1529. [DOI] [PMC free article] [PubMed] [Google Scholar]
- Nestor PJ, Graham NL, Fryer TD et al. (2003b). Progressive non-fluent aphasia is associated with hypometabolism centred on the left anterior insula. Brain 126: 2406–2418. [DOI] [PubMed] [Google Scholar]
- Nowrangi MA, Lyketsos CG, Leoutsakos JM et al. (2013). Longitudinal, region-specific course of diffusion tensor imaging measures in mild cognitive impairment and Alzheimer’s disease. Alzheimers Dement 9: 519–528. [DOI] [PMC free article] [PubMed] [Google Scholar]
- O’Brien JL, O’Keefe KM, LaViolette PS et al. (2010). Longitudinal fMRI in elderly reveals loss of hippocampal activation with clinical decline. Neurology 74: 1969–1976. [DOI] [PMC free article] [PubMed] [Google Scholar]
- Ossenkoppele R, Cohn-Sheehy BI, La Joie R et al. (2015a). Atrophy patterns in early clinical stages across distinct phenotypes of Alzheimer’s disease. Hum Brain Mapp 36: 4421–4437. [DOI] [PMC free article] [PubMed] [Google Scholar]
- Ossenkoppele R, Pijnenburg YA, Perry DC et al. (2015b). The behavioural/dysexecutive variant of Alzheimer’s disease: clinical, neuroimaging and pathological features. Brain 138: 2732–2749. [DOI] [PMC free article] [PubMed] [Google Scholar]
- Ossenkoppele R, Schonhaut DR, Baker SL et al. (2015c). Tau, amyloid, and hypometabolism in a patient with posterior cortical atrophy. Ann Neurol 77: 338–342. [DOI] [PMC free article] [PubMed] [Google Scholar]
- Ossenkoppele R, Schonhaut DR, Scholl M et al. (2016). Tau PET patterns mirror clinical and neuroanatomical variability in Alzheimer’s disease. Brain 139: 1551–1567. [DOI] [PMC free article] [PubMed] [Google Scholar]
- Palmieri A, Naccarato M, Abrahams S et al. (2010). Right hemisphere dysfunction and emotional processing in ALS: an fMRI study. J Neurol 257: 1970–1978. [DOI] [PubMed] [Google Scholar]
- Pan PL, Song W, Yang J et al. (2012). Gray matter atrophy in behavioral variant frontotemporal dementia: a meta-analysis of voxel-based morphometry studies. Dement Geriatr Cogn Disord 33: 141–148. [DOI] [PubMed] [Google Scholar]
- Park JH, Seo SW, Kim C et al. (2013). Pathogenesis of cerebral microbleeds: in vivo imaging of amyloid and subcortical ischemic small vessel disease in 226 individuals with cognitive impairment. Ann Neurol 73: 584–593. [DOI] [PubMed] [Google Scholar]
- Pascoal TA, Mathotaarachchi S, Mohades S et al. (2017). Amyloid-beta and hyperphosphorylated tau synergy drives metabolic decline in preclinical Alzheimer’s disease. Mol Psychiatry 22: 306–311. [DOI] [PMC free article] [PubMed] [Google Scholar]
- Paviour DC, Price SL, Jahanshahi M et al. (2006). Longitudinal MRI in progressive supranuclear palsy and multiple system atrophy: rates and regions of atrophy. Brain 129: 1040–1049. [DOI] [PubMed] [Google Scholar]
- Peca S, McCreary CR, Donaldson E et al. (2013). Neurovascular decoupling is associated with severity of cerebral amyloid angiopathy. Neurology 81: 1659–1665. [DOI] [PMC free article] [PubMed] [Google Scholar]
- Perez-Soriano A, Arena JE, Dinelle K et al. (2017). PBB3 imaging in Parkinsonian disorders: evidence for binding to tau and other proteins. Mov Disord 32: 1016–1024. [DOI] [PubMed] [Google Scholar]
- Perneczky R, Drzezga A, Boecker H et al. (2008). Cerebral metabolic dysfunction in patients with dementia with Lewy bodies and visual hallucinations. Dement Geriatr Cogn Disord 25: 531–538. [DOI] [PubMed] [Google Scholar]
- Perrotin A, Mormino EC, Madison CM et al. (2012). Subjective cognition and amyloid deposition imaging: a Pittsburgh Compound B positron emission tomography study in normal elderly individuals. Arch Neurol 69: 223–229. [DOI] [PMC free article] [PubMed] [Google Scholar]
- Petersen RC, Smith GE, Waring SC et al. (1999). Mild cognitive impairment: clinical characterization and outcome. Arch Neurol 56: 303–308. [DOI] [PubMed] [Google Scholar]
- Phillips JS, Das SR, McMillan CT et al. (2018). Tau PET imaging predicts cognition in atypical variants of Alzheimer’s disease. Hum Brain Mapp 39: 691–708. [DOI] [PMC free article] [PubMed] [Google Scholar]
- Piattella MC, Tona F, Bologna M et al. (2015). Disrupted resting-state functional connectivity in progressive supranuclear palsy. AJNR Am J Neuroradiol 36: 915–921. [DOI] [PMC free article] [PubMed] [Google Scholar]
- Pievani M, Agosta F, Pagani E et al. (2010). Assessment of white matter tract damage in mild cognitive impairment and Alzheimer’s disease. Hum Brain Mapp 31: 1862–1875. [DOI] [PMC free article] [PubMed] [Google Scholar]
- Pievani M, Bocchetta M, Boccardi M et al. (2013). Striatal morphology in early-onset and late-onset Alzheimer’s disease: a preliminary study. Neurobiol Aging 34: 1728–1739. [DOI] [PubMed] [Google Scholar]
- Planetta PJ, Kurani AS, Shukla P et al. (2015). Distinct functional and macrostructural brain changes in Parkinson’s disease and multiple system atrophy. Hum Brain Mapp 36: 1165–1179. [DOI] [PMC free article] [PubMed] [Google Scholar]
- Quiroz YT, Budson AE, Celone K et al. (2010). Hippocampal hyperactivation in presymptomatic familial Alzheimer’s disease. Ann Neurol 68: 865–875. [DOI] [PMC free article] [PubMed] [Google Scholar]
- Rabinovici GD, Jagust WJ, Furst AJ et al. (2008). Abeta amyloid and glucose metabolism in three variants of primary progressive aphasia. Ann Neurol 64: 388–401. [DOI] [PMC free article] [PubMed] [Google Scholar]
- Rabinovici GD, Rosen HJ, Alkalay A et al. (2011). Amyloid vs FDG-PET in the differential diagnosis of AD and FTLD. Neurology 77: 2034–2042. [DOI] [PMC free article] [PubMed] [Google Scholar]
- Rami L, Sala-Llonch R, Sole-Padulles C et al. (2012). Distinct functional activity of the precuneus and posterior cingulate cortex during encoding in the preclinical stage of Alzheimer’s disease. J Alzheimers Dis 31: 517–526. [DOI] [PubMed] [Google Scholar]
- Reiman EM, Chen K, Liu X et al. (2009). Fibrillar amyloid-beta burden in cognitively normal people at 3 levels of genetic risk for Alzheimer’s disease. Proc Natl Acad Sci USA 106: 6820–6825. [DOI] [PMC free article] [PubMed] [Google Scholar]
- Rentz DM, Locascio JJ, Becker JA et al. (2010). Cognition, reserve, and amyloid deposition in normal aging. Ann Neurol 67: 353–364. [DOI] [PMC free article] [PubMed] [Google Scholar]
- Ridha BH, Barnes J, Bartlett JW et al. (2006). Tracking atrophy progression in familial Alzheimer’s disease: a serial MRI study. Lancet Neurol 5: 828–834. [DOI] [PubMed] [Google Scholar]
- Ringman JM, O’Neill J, Geschwind D et al. (2007). Diffusion tensor imaging in preclinical and presymptomatic carriers of familial Alzheimer’s disease mutations. Brain 130: 1767–1776. [DOI] [PubMed] [Google Scholar]
- Ringman JM, Medina LD, Braskie M et al. (2011). Effects of risk genes on BOLD activation in presymptomatic carriers of familial Alzheimer’s disease mutations during a novelty encoding task. Cereb Cortex 21: 877–883. [DOI] [PMC free article] [PubMed] [Google Scholar]
- Risacher SL, Saykin AJ (2013). Neuroimaging biomarkers of neurodegenerative diseases and dementia. Semin Neurol 33: 386–416. [DOI] [PMC free article] [PubMed] [Google Scholar]
- Risacher SL, Saykin AJ, West JD et al. (2009). Baseline MRI predictors of conversion from MCI to probable AD in the ADNI cohort. Curr Alzheimer Res 6: 347–361. [DOI] [PMC free article] [PubMed] [Google Scholar]
- Risacher SL, Shen L, West JD et al. (2010). Longitudinal MRI atrophy biomarkers: relationship to conversion in the ADNI cohort. Neurobiol Aging 31: 1401–1418. [DOI] [PMC free article] [PubMed] [Google Scholar]
- Risacher SL, Kim S, Shen L et al. (2013). The role of apolipoprotein E (APOE) genotype in early mild cognitive impairment (E-MCI). Front Aging Neurosci 5: 11. [DOI] [PMC free article] [PubMed] [Google Scholar]
- Risacher SL, West JD, Tallman EF et al. (2014). Altered fMRI activation pattern during visual scene encoding in affected and non-affected carriers of PSEN1 and APP mutations. Alzheimers Dement 10: P53. [Google Scholar]
- Risacher SL, Kim S, Nho K et al. (2015). APOE effect on Alzheimer’s disease biomarkers in older adults with significant memory concern. Alzheimers Dement 11: 1417–1429. [DOI] [PMC free article] [PubMed] [Google Scholar]
- Rizk-Jackson A, Insel P, Petersen R et al. (2013). Early indications of future cognitive decline: stable versus declining controls. PLoS One 8: e74062. [DOI] [PMC free article] [PubMed] [Google Scholar]
- Robbins TW, James M, Lange KW et al. (1992). Cognitive performance in multiple system atrophy. Brain 115: 271–291. [DOI] [PubMed] [Google Scholar]
- Rodda JE, Dannhauser TM, Cutinha DJ et al. (2009). Subjective cognitive impairment: increased prefrontal cortex activation compared to controls during an encoding task. Int J Geriatr Psychiatry 24: 865–874. [DOI] [PubMed] [Google Scholar]
- Rodda J, Dannhauser T, Cutinha DJ et al. (2011). Subjective cognitive impairment: functional MRI during a divided attention task. Eur Psychiatry 26: 457–462. [DOI] [PubMed] [Google Scholar]
- Rohrer JD (2012). Structural brain imaging in frontotemporal dementia. Biochim Biophys Acta 1822: 325–332. [DOI] [PubMed] [Google Scholar]
- Rohrer JD, Warren JD, Modat M et al. (2009). Patterns of cortical thinning in the language variants of frontotemporal lobar degeneration. Neurology 72: 1562–1569. [DOI] [PMC free article] [PubMed] [Google Scholar]
- Rohrer JD, Lashley T, Schott JM et al. (2011). Clinical and neuroanatomical signatures of tissue pathology in frontotemporal lobar degeneration. Brain 134: 2565–2581. [DOI] [PMC free article] [PubMed] [Google Scholar]
- Rohrer JD, Clarkson MJ, Kittus R et al. (2012). Rates of hemispheric and lobar atrophy in the language variants of frontotemporal lobar degeneration. J Alzheimers Dis 30: 407–411. [DOI] [PMC free article] [PubMed] [Google Scholar]
- Rolland Y, Verin M, Payan CA et al. (2011). A new MRI rating scale for progressive supranuclear palsy and multiple system atrophy: validity and reliability. J Neurol Neurosurg Psychiatry 82: 1025–1032. [DOI] [PMC free article] [PubMed] [Google Scholar]
- Rombouts SA, van Swieten JC, Pijnenburg YA et al. (2003). Loss of frontal fMRI activation in early frontotemporal dementia compared to early AD. Neurology 60: 1904–1908. [DOI] [PubMed] [Google Scholar]
- Rombouts SA, Barkhof F, Goekoop R et al. (2005). Altered resting state networks in mild cognitive impairment and mild Alzheimer’s disease: an fMRI study. Hum Brain Mapp 26: 231–239. [DOI] [PMC free article] [PubMed] [Google Scholar]
- Rosenberg GA (2016). Vascular cognitive impairment: biomarkers in diagnosis and molecular targets in therapy. J Cereb Blood Flow Metab 36: 4–5. [DOI] [PMC free article] [PubMed] [Google Scholar]
- Saint-Aubert L, Sagot C, Wallon D et al. (2014). A case of logopenic primary progressive aphasia with C9ORF72 expansion and cortical florbetapir binding. J Alzheimers Dis 42: 413–420. [DOI] [PubMed] [Google Scholar]
- Sajjadi SA, Acosta-Cabronero J, Patterson K et al. (2013). Diffusion tensor magnetic resonance imaging for single subject diagnosis in neurodegenerative diseases. Brain 136: 2253–2261. [DOI] [PubMed] [Google Scholar]
- Sala-Llonch R, Fortea J, Bartres-Faz D et al. (2013). Evolving brain functional abnormalities in PSEN1 mutation carriers: a resting and visual encoding fMRI study. J Alzheimers Dis 36: 165–175. [DOI] [PubMed] [Google Scholar]
- Salmon E, Sadzot B, Maquet P et al. (1994). Differential diagnosis of Alzheimer’s disease with PET. J Nucl Med 35: 391–398. [PubMed] [Google Scholar]
- Samuraki M, Matsunari I, Yoshita M et al. (2015). Cerebral amyloid angiopathy-related microbleeds correlate with glucose metabolism and brain volume in Alzheimer’s disease. J Alzheimers Dis 48: 517–528. [DOI] [PubMed] [Google Scholar]
- Sanchez-Castaneda C, Rene R, Ramirez-Ruiz B et al. (2010). Frontal and associative visual areas related to visual hallucinations in dementia with Lewy bodies and Parkinson’s disease with dementia. Mov Disord 25: 615–622. [DOI] [PubMed] [Google Scholar]
- Sauer J, ffytche DH, Ballard C et al. (2006). Differences between Alzheimer’s disease and dementia with Lewy bodies: an fMRI study of task-related brain activity. Brain 129: 1780–1788. [DOI] [PubMed] [Google Scholar]
- Saykin AJ, Flashman LA, Frutiger SA et al. (1999). Neuroanatomic substrates of semantic memory impairment in Alzheimer’s disease: patterns of functional MRI activation. J Int Neuropsychol Soc 5: 377–392. [DOI] [PMC free article] [PubMed] [Google Scholar]
- Saykin AJ, Wishart HA, Rabin LA et al. (2006). Older adults with cognitive complaints show brain atrophy similar to that of amnestic MCI. Neurology 67: 834–842. [DOI] [PMC free article] [PubMed] [Google Scholar]
- Scheef L, Spottke A, Daerr M et al. (2012). Glucose metabolism, gray matter structure, and memory decline in subjective memory impairment. Neurology 79: 1332–1339. [DOI] [PubMed] [Google Scholar]
- Scheltens P, Leys D, Barkhof F et al. (1992). Atrophy of medial temporal lobes on MRI in “probable” Alzheimer’s disease and normal ageing: diagnostic value and neuropsychological correlates. J Neurol Neurosurg Psychiatry 55: 967–972. [DOI] [PMC free article] [PubMed] [Google Scholar]
- Scheltens P, Pasquier F, Weerts JG et al. (1997). Qualitative assessment of cerebral atrophy on MRI: inter- and intra-observer reproducibility in dementia and normal aging. Eur Neurol 37: 95–99. [DOI] [PubMed] [Google Scholar]
- Scher AI, Xu Y, Korf ES et al. (2011). Hippocampal morphometry in population-based incident Alzheimer’s disease and vascular dementia: the HAAS. J Neurol Neurosurg Psychiatry 82: 373–376. [DOI] [PMC free article] [PubMed] [Google Scholar]
- Schmidt R, Verstraete E, de Reus MA et al. (2014). Correlation between structural and functional connectivity impairment in amyotrophic lateral sclerosis. Hum Brain Mapp 35: 4386–4395. [DOI] [PMC free article] [PubMed] [Google Scholar]
- Scholl M, Lockhart SN, Schonhaut DR et al. (2016). PET imaging of tau deposition in the aging human brain. Neuron 89: 971–982. [DOI] [PMC free article] [PubMed] [Google Scholar]
- Scholl M, Ossenkoppele R, Strandberg O et al. (2017). Distinct 18F-AV-1451 tau PET retention patterns in early- and late-onset Alzheimer’s disease. Brain 140: 2286–2294. [DOI] [PubMed] [Google Scholar]
- Schroeter ML, Raczka K, Neumann J et al. (2007). Towards a nosology for frontotemporal lobar degenerations-a meta-analysis involving 267 subjects. NeuroImage 36: 497–510. [DOI] [PubMed] [Google Scholar]
- Schroeter ML, Raczka K, Neumann J et al. (2008). Neural networks in frontotemporal dementia—a meta-analysis. Neurobiol Aging 29: 418–426. [DOI] [PubMed] [Google Scholar]
- Schroeter ML, Laird AR, Chwiesko C et al. (2014). Conceptualizing neuropsychiatric diseases with multimodal data-driven meta-analyses—the case of behavioral variant frontotemporal dementia. Cortex 57: 22–37. [DOI] [PMC free article] [PubMed] [Google Scholar]
- Schultz AP, Chhatwal JP, Hedden T et al. (2017). Phases of hyperconnectivity and hypoconnectivity in the default mode and salience networks track with amyloid and tau in clinically normal individuals. J Neurosci 37: 4323–4331. [DOI] [PMC free article] [PubMed] [Google Scholar]
- Schwarz AJ, Yu P, Miller BB et al. (2016). Regional profiles of the candidate tau PET ligand 18F-AV-1451 recapitulate key features of Braak histopathological stages. Brain 139: 1539–1550. [DOI] [PubMed] [Google Scholar]
- Selnes P, Fjell AM, Gjerstad L et al. (2012). White matter imaging changes in subjective and mild cognitive impairment. Alzheimers Dement 8: S112–S121. [DOI] [PubMed] [Google Scholar]
- Selnes P, Aarsland D, Bjornerud A et al. (2013). Diffusion tensor imaging surpasses cerebrospinal fluid as predictor of cognitive decline and medial temporal lobe atrophy in subjective cognitive impairment and mild cognitive impairment. J Alzheimers Dis 33: 723–736. [DOI] [PubMed] [Google Scholar]
- Serrano GE, Sabbagh MN, Sue LI et al. (2014). Positive florbetapir PET amyloid imaging in a subject with frequent cortical neuritic plaques and frontotemporal lobar degeneration with TDP43-positive inclusions. J Alzheimers Dis 42: 813–821. [DOI] [PMC free article] [PubMed] [Google Scholar]
- Sha SJ, Takada LT, Rankin KP et al. (2012). Frontotemporal dementia due to C9ORF72 mutations: clinical and imaging features. Neurology 79: 1002–1011. [DOI] [PMC free article] [PubMed] [Google Scholar]
- Shames H, Raz N, Levin N (2015). Functional neural substrates of posterior cortical atrophy patients. J Neurol 262: 1751–1761. [DOI] [PubMed] [Google Scholar]
- Sheline YI, Morris JC, Snyder AZ et al. (2010). APOE4 allele disrupts resting state fMRI connectivity in the absence of amyloid plaques or decreased CSF Abeta42. J Neurosci 30: 17035–17040. [DOI] [PMC free article] [PubMed] [Google Scholar]
- Shiga K, Yamada K, Yoshikawa K et al. (2005). Local tissue anisotropy decreases in cerebellopetal fibers and pyramidal tract in multiple system atrophy. J Neurol 252: 589–596. [DOI] [PubMed] [Google Scholar]
- Shimada H, Shinotoh H, Hirano S et al. (2013). Beta-amyloid in Lewy body disease is related to Alzheimer’s disease-like atrophy. Mov Disord 28: 169–175. [DOI] [PubMed] [Google Scholar]
- Silverman DH, Cummings JL, Small GW et al. (2002). Added clinical benefit of incorporating 2-deoxy-2-[18F]fluoro-D-glucose with positron emission tomography into the clinical evaluation of patients with cognitive impairment. Mol Imaging Biol 4: 283–293. [DOI] [PubMed] [Google Scholar]
- Smith R, Puschmann A, Scholl M et al. (2016a). 18F-AV-1451 tau PET imaging correlates strongly with tau neuropathology in MAPT mutation carriers. Brain 139: 2372–2379. [DOI] [PMC free article] [PubMed] [Google Scholar]
- Smith R, Wibom M, Olsson T et al. (2016b). Posterior accumulation of tau and concordant hypometabolism in an early-onset Alzheimer’s disease patient with presenilin-1 mutation. J Alzheimers Dis 51: 339–343. [DOI] [PubMed] [Google Scholar]
- Smits LL, Pijnenburg YA, Koedam EL et al. (2012). Early onset Alzheimer’s disease is associated with a distinct neuropsychological profile. J Alzheimers Dis 30: 101–108. [DOI] [PubMed] [Google Scholar]
- Snow BJ (1996). Fluorodopa PET scanning in Parkinson’s disease. Adv Neurol 69: 449–457. [PubMed] [Google Scholar]
- Sperling RA, Bates JF, Chua EF et al. (2003). fMRI studies of associative encoding in young and elderly controls and mild Alzheimer’s disease. J Neurol Neurosurg Psychiatry 74: 44–50. [DOI] [PMC free article] [PubMed] [Google Scholar]
- Sperling RA, Laviolette PS, O’Keefe K et al. (2009). Amyloid deposition is associated with impaired default network function in older persons without dementia. Neuron 63: 178–188. [DOI] [PMC free article] [PubMed] [Google Scholar]
- Sperling RA, Aisen PS, Beckett LA et al. (2011). Toward defining the preclinical stages of Alzheimer’s disease: recommendations from the National Institute on Aging-Alzheimer’s Association workgroups on diagnostic guidelines for Alzheimer’s disease. Alzheimers Dement 7: 280–292. [DOI] [PMC free article] [PubMed] [Google Scholar]
- Sperling RA, Johnson KA, Doraiswamy PM et al. (2013). Amyloid deposition detected with florbetapir F 18 ((18) F-AV-45) is related to lower episodic memory performance in clinically normal older individuals. Neurobiol Aging 34: 822–831. [DOI] [PMC free article] [PubMed] [Google Scholar]
- Stefanova N, Bucke P, Duerr S et al. (2009). Multiple system atrophy: an update. Lancet Neurol 8: 1172–1178. [DOI] [PubMed] [Google Scholar]
- Stewart R, Godin O, Crivello F et al. (2011). Longitudinal neuroimaging correlates of subjective memory impairment: 4-year prospective community study. Br J Psychiatry 198: 199–205. [DOI] [PubMed] [Google Scholar]
- Tak S, Yoon SJ, Jang J et al. (2011). Quantitative analysis of hemodynamic and metabolic changes in subcortical vascular dementia using simultaneous near-infrared spectroscopy and fMRI measurements. NeuroImage 55: 176–184. [DOI] [PubMed] [Google Scholar]
- Taylor JP, Firbank MJ, He J et al. (2012). Visual cortex in dementia with Lewy bodies: magnetic resonance imaging study. Br J Psychiatry 200: 491–498. [DOI] [PMC free article] [PubMed] [Google Scholar]
- Tessitore A, Amboni M, Esposito F et al. (2012). Resting-state brain connectivity in patients with Parkinson’s disease and freezing of gait. Parkinsonism Relat Disord 18: 781–787. [DOI] [PubMed] [Google Scholar]
- Teune LK, Bartels AL, de Jong BM et al. (2010). Typical cerebral metabolic patterns in neurodegenerative brain diseases. Mov Disord 25: 2395–2404. [DOI] [PubMed] [Google Scholar]
- Tondelli M, Wilcock GK, Nichelli P et al. (2012). Structural MRI changes detectable up to ten years before clinical Alzheimer’s disease. Neurobiol Aging 33: e825–e836. [DOI] [PubMed] [Google Scholar]
- Trachtenberg AJ, Filippini N, Ebmeier KP et al. (2012). The effects of APOE on the functional architecture of the resting brain. NeuroImage 59: 565–572. [DOI] [PubMed] [Google Scholar]
- Trivedi MA, Wichmann AK, Torgerson BM et al. (2006). Structural MRI discriminates individuals with Mild Cognitive Impairment from age-matched controls: a combined neuropsychological and voxel based morphometry study. Alzheimers Dement 2: 296–302. [DOI] [PMC free article] [PubMed] [Google Scholar]
- Trojsi F, Corbo D, Caiazzo G et al. (2013). Motor and extra-motor neurodegeneration in amyotrophic lateral sclerosis: a 3T high angular resolution diffusion imaging (HARDI) study. Amyotroph Lateral Scler Frontotemporal Degener 14: 553–561. [DOI] [PubMed] [Google Scholar]
- Tsukamoto K, Matsusue E, Kanasaki Y et al. (2012). Significance of apparent diffusion coefficient measurement for the differential diagnosis of multiple system atrophy, progressive supranuclear palsy, and Parkinson’s disease: evaluation by 3.0-T MR imaging. Neuroradiology 54: 947–955. [DOI] [PubMed] [Google Scholar]
- Turner MR, Grosskreutz J, Kassubek J et al. (2011). Towards a neuroimaging biomarker for amyotrophic lateral sclerosis. Lancet Neurol 10: 400–403. [DOI] [PubMed] [Google Scholar]
- van der Flier WM, van Buchem MA, Weverling-Rijnsburger AW et al. (2004). Memory complaints in patients with normal cognition are associated with smaller hippocampal volumes. J Neurol 251: 671–675. [DOI] [PubMed] [Google Scholar]
- Verdelho A, Madureira S, Moleiro C et al. (2010). White matter changes and diabetes predict cognitive decline in the elderly: the LADIS study. Neurology 75: 160–167. [DOI] [PubMed] [Google Scholar]
- Verstraete E, Veldink JH, van den Berg LH et al. (2014). Structural brain network imaging shows expanding disconnection of the motor system in amyotrophic lateral sclerosis. Hum Brain Mapp 35: 1351–1361. [DOI] [PMC free article] [PubMed] [Google Scholar]
- Villemagne VL, Pike KE, Darby D et al. (2008). Abeta deposits in older non-demented individuals with cognitive decline are indicative of preclinical Alzheimer’s disease. Neuropsychologia 46: 1688–1697. [DOI] [PubMed] [Google Scholar]
- Villemagne VL, Ataka S, Mizuno T et al. (2009). High striatal amyloid beta-peptide deposition across different autosomal Alzheimer disease mutation types. Arch Neurol 66: 1537–1544. [DOI] [PubMed] [Google Scholar]
- Villemagne VL, Ong K, Mulligan RS et al. (2011a). Amyloid imaging with (18)F-florbetaben in Alzheimer disease and other dementias. J Nucl Med 52: 1210–1217. [DOI] [PubMed] [Google Scholar]
- Villemagne VL, Pike KE, Chetelat G et al. (2011b). Longitudinal assessment of Aβ and cognition in aging and Alzheimer disease. Ann Neurol 69: 181–192. [DOI] [PMC free article] [PubMed] [Google Scholar]
- Virani K, Jesso S, Kertesz A et al. (2013). Functional neural correlates of emotional expression processing deficits in behavioural variant frontotemporal dementia. J Psychiatry Neurosci 38: 174–182. [DOI] [PMC free article] [PubMed] [Google Scholar]
- Viswanathan A, Greenberg SM (2011). Cerebral amyloid angiopathy in the elderly. Ann Neurol 70: 871–880. [DOI] [PMC free article] [PubMed] [Google Scholar]
- Walker Z, Costa DC, Janssen AG et al. (1997). Dementia with Lewy bodies: a study of post-synaptic dopaminergic receptors with iodine-123 iodobenzamide single-photon emission tomography. Eur J Nucl Med 24: 609–614. [DOI] [PubMed] [Google Scholar]
- Walker Z, Costa DC, Walker RW et al. (2002). Differentiation of dementia with Lewy bodies from Alzheimer’s disease using a dopaminergic presynaptic ligand. J Neurol Neurosurg Psychiatry 73: 134–140. [DOI] [PMC free article] [PubMed] [Google Scholar]
- Wang Y, Butros SR, Shuai X et al. (2012a). Different iron-deposition patterns of multiple system atrophy with predominant parkinsonism and idiopathetic Parkinson diseases demonstrated by phase-corrected susceptibility-weighted imaging. AJNR Am J Neuroradiol 33: 266–273. [DOI] [PMC free article] [PubMed] [Google Scholar]
- Wang Y, West JD, Flashman LA et al. (2012b). Selective changes in white matter integrity in MCI and older adults with cognitive complaints. Biochim Biophys Acta 1822: 423–430. [DOI] [PMC free article] [PubMed] [Google Scholar]
- Wang Y, Risacher SL, West JD et al. (2013). Altered default mode network connectivity in older adults with cognitive complaints and amnestic mild cognitive impairment. J Alzheimers Dis 35: 751–760. [DOI] [PMC free article] [PubMed] [Google Scholar]
- Wang F, Gordon BA, Ryman DC et al. (2015a). Cerebral amyloidosis associated with cognitive decline in autosomal dominant Alzheimer disease. Neurology 85: 790–798. [DOI] [PMC free article] [PubMed] [Google Scholar]
- Wang R, Fratiglioni L, Laukka EJ et al. (2015b). Effects of vascular risk factors and APOE epsilon4 on white matter integrity and cognitive decline. Neurology 84: 1128–1135. [DOI] [PMC free article] [PubMed] [Google Scholar]
- Wang XD, Lu H, Shi Z et al. (2015c). A pilot study on clinical and neuroimaging characteristics of Chinese posterior cortical atrophy: comparison with typical Alzheimer’s disease. PLoS One 10: e0134956. [DOI] [PMC free article] [PubMed] [Google Scholar]
- Watson R, Blamire AM, Colloby SJ et al. (2012). Characterizing dementia with Lewy bodies by means of diffusion tensor imaging. Neurology 79: 906–914. [DOI] [PMC free article] [PubMed] [Google Scholar]
- Weintraub D, Dietz N, Duda JE et al. (2012). Alzheimer’s disease pattern of brain atrophy predicts cognitive decline in Parkinson’s disease. Brain 135: 170–180. [DOI] [PMC free article] [PubMed] [Google Scholar]
- Whitwell JL, Josephs KA (2011). Neuroimaging in frontotemporal lobar degeneration—predicting molecular pathology. Nat Rev Neurol 8: 131–142. [DOI] [PubMed] [Google Scholar]
- Whitwell JL, Josephs KA, Rossor MN et al. (2005). Magnetic resonance imaging signatures of tissue pathology in frontotemporal dementia. Arch Neurol 62: 1402–1408. [DOI] [PubMed] [Google Scholar]
- Whitwell JL, Jack CR Jr, Parisi JE et al. (2007). Rates of cerebral atrophy differ in different degenerative pathologies. Brain 130: 1148–1158. [DOI] [PMC free article] [PubMed] [Google Scholar]
- Whitwell JL, Przybelski SA, Weigand SD et al. (2009). Distinct anatomical subtypes of the behavioural variant of frontotemporal dementia: a cluster analysis study. Brain 132: 2932–2946. [DOI] [PMC free article] [PubMed] [Google Scholar]
- Whitwell JL, Avula R, Senjem ML et al. (2010a). Gray and white matter water diffusion in the syndromic variants of frontotemporal dementia. Neurology 74: 1279–1287. [DOI] [PMC free article] [PubMed] [Google Scholar]
- Whitwell JL, Jack CR Jr, Boeve BF et al. (2010b). Imaging correlates of pathology in corticobasal syndrome. Neurology 75: 1879–1887. [DOI] [PMC free article] [PubMed] [Google Scholar]
- Whitwell JL, Jack CR Jr, Parisi JE et al. (2010c). Does TDP-43 type confer a distinct pattern of atrophy in frontotemporal lobar degeneration? Neurology 75: 2212–2220. [DOI] [PMC free article] [PubMed] [Google Scholar]
- Whitwell JL, Avula R, Master A et al. (2011a). Disrupted thalamocortical connectivity in PSP: a resting-state fMRI, DTI, and VBM study. Parkinsonism Relat Disord 17: 599–605. [DOI] [PMC free article] [PubMed] [Google Scholar]
- Whitwell JL, Jack CR Jr, Parisi JE et al. (2011b). Imaging signatures of molecular pathology in behavioral variant frontotemporal dementia. J Mol Neurosci 45: 372–378. [DOI] [PMC free article] [PubMed] [Google Scholar]
- Whitwell JL, Josephs KA, Avula R et al. (2011c). Altered functional connectivity in asymptomatic MAPT subjects: a comparison to bvFTD. Neurology 77: 866–874. [DOI] [PMC free article] [PubMed] [Google Scholar]
- Whitwell JL, Master AV, Avula R et al. (2011d). Clinical correlates of white matter tract degeneration in progressive supranuclear palsy. Arch Neurol 68: 753–760. [DOI] [PMC free article] [PubMed] [Google Scholar]
- Whitwell JL, Dickson DW, Murray ME et al. (2012). Neuroimaging correlates of pathologically defined subtypes of Alzheimer’s disease: a case-control study. Lancet Neurol 11: 868–877. [DOI] [PMC free article] [PubMed] [Google Scholar]
- Whitwell JL, Lowe VJ, Duffy JR et al. (2013). Elevated occipital beta-amyloid deposition is associated with widespread cognitive impairment in logopenic progressive aphasia. J Neurol Neurosurg Psychiatry 84: 1357–1364. [DOI] [PMC free article] [PubMed] [Google Scholar]
- Whitwell JL, Duffy JR, Strand EA et al. (2015a). Clinical and neuroimaging biomarkers of amyloid-negative logopenic primary progressive aphasia. Brain Lang 142: 45–53. [DOI] [PMC free article] [PubMed] [Google Scholar]
- Whitwell JL, Kantarci K, Weigand SD et al. (2015b). Microbleeds in atypical presentations of Alzheimer’s disease: a comparison to dementia of the Alzheimer’s type. J Alzheimers Dis 45: 1109–1117. [DOI] [PMC free article] [PubMed] [Google Scholar]
- Whitwell JL, Lowe VJ, Tosakulwong N et al. (2017). [(18) F] AV-1451 tau positron emission tomography in progressive supranuclear palsy. Mov Disord 32: 124–133. [DOI] [PMC free article] [PubMed] [Google Scholar]
- Whitwell JL, Graff-Radford J, Tosakulwong N et al. (2018). [(18) F]AV-1451 clustering of entorhinal and cortical uptake in Alzheimer’s disease. Ann Neurol 83: 248–257. [DOI] [PMC free article] [PubMed] [Google Scholar]
- Wilson SM, Brambati SM, Henry RG et al. (2009). The neural basis of surface dyslexia in semantic dementia. Brain 132: 71–86. [DOI] [PMC free article] [PubMed] [Google Scholar]
- Wilson SM, Dronkers NF, Ogar JM et al. (2010). Neural correlates of syntactic processing in the nonfluent variant of primary progressive aphasia. J Neurosci 30: 16845–16854. [DOI] [PMC free article] [PubMed] [Google Scholar]
- Wirth M, Villeneuve S, La Joie R et al. (2014). Gene-environment interactions: lifetime cognitive activity, APOE genotype, and beta-amyloid burden. J Neurosci 34: 8612–8617. [DOI] [PMC free article] [PubMed] [Google Scholar]
- Wishart HA, Saykin AJ, Rabin LA et al. (2006). Increased brain activation during working memory in cognitively intact adults with the APOE epsilon4 allele. Am J Psychiatry 163: 1603–1610. [DOI] [PubMed] [Google Scholar]
- Wisse LE, Biessels GJ, Heringa SM et al. (2014). Hippocampal subfield volumes at 7T in early Alzheimer’s disease and normal aging. Neurobiol Aging 35: 2039–2045. [DOI] [PubMed] [Google Scholar]
- Wu T, Wang L, Chen Y et al. (2009). Changes of functional connectivity of the motor network in the resting state in Parkinson’s disease. Neurosci Lett 460: 6–10. [DOI] [PubMed] [Google Scholar]
- Xia C, Dickerson BC (2017). Multimodal PET imaging of amyloid and tau pathology in Alzheimer disease and non-Alzheimer disease dementias. PET Clin 12: 351–359. [DOI] [PMC free article] [PubMed] [Google Scholar]
- Yamada S, Saiki M, Satow T et al. (2012). Periventricular and deep white matter leukoaraiosis have a closer association with cerebral microbleeds than age. Eur J Neurol 19: 98–104. [DOI] [PubMed] [Google Scholar]
- Yamakawa Y, Shimada H, Ataka S et al. (2012). Two cases of dementias with motor neuron disease evaluated by Pittsburgh compound B-positron emission tomography. Neurol Sci 33: 87–92. [DOI] [PubMed] [Google Scholar]
- Yau WY, Tudorascu DL, McDade EM et al. (2015). Longitudinal assessment of neuroimaging and clinical markers in autosomal dominant Alzheimer’s disease: a prospective cohort study. Lancet Neurol 14: 804–813. [DOI] [PMC free article] [PubMed] [Google Scholar]
- Yokoyama JS, Rosen HJ (2012). Neuroimaging features of C9ORF72 expansion. Alzheimers Res Ther 4: 45. [DOI] [PMC free article] [PubMed] [Google Scholar]
- Yoon CW, Shin JS, Kim HJ et al. (2013). Cognitive deficits of pure subcortical vascular dementia vs. Alzheimer disease: PiB-PET-based study. Neurology 80: 569–573. [DOI] [PubMed] [Google Scholar]
- You H, Wang J, Wang H et al. (2011). Altered regional homogeneity in motor cortices in patients with multiple system atrophy. Neurosci Lett 502: 18–23. [DOI] [PubMed] [Google Scholar]
- Yushkevich PA, Pluta JB, Wang H et al. (2015). Automated volumetry and regional thickness analysis of hippocampal subfields and medial temporal cortical structures in mild cognitive impairment. Hum Brain Mapp 36: 258–287. [DOI] [PMC free article] [PubMed] [Google Scholar]
- Zhang Y, Schuff N, Ching C et al. (2011). Joint assessment of structural, perfusion, and diffusion MRI in Alzheimer’s disease and frontotemporal dementia. Int J Alzheimers Dis 2011: 546871. [DOI] [PMC free article] [PubMed] [Google Scholar]
- Zhao P, Zhang B, Gao S (2012). 18F-FDG PET study on the idiopathic Parkinson’s disease from several parkinsonian-plus syndromes. Parkinsonism Relat Disord 18: S60–S62. [DOI] [PubMed] [Google Scholar]
- Zwergal A, la Fougere C, Lorenzl S et al. (2011). Postural imbalance and falls in PSP correlate with functional pathology of the thalamus. Neurology 77: 101–109. [DOI] [PubMed] [Google Scholar]