Abstract
Purpose:
T1- and T2-weighted (T1w, and T2w) imaging are essential sequences in routine clinical practice to detect and characterize a wide variety of pathologies. Many approaches have been proposed to obtain T1w and T2w contrast although many challenges still remain, including long acquisition time, and limitations that favor 2D imaging, etc. In this study, we propose a novel method for simultaneous T1w and T2w imaging using RF phase-modulated 3D gradient echo (GRE) imaging.
Theory:
Configuration theory is used to derive closed form equations for the steady-state of RF phase-modulated GRE signal. These equations suggest the use of small RF phase increments to provide orthogonal signal contrast with T2w and T1w in the real and imaginary components, respectively. Background phase can be removed using a two-pass acquisition with opposite RF phase increments.
Methods:
Simulation and phantom experiments were performed to validate our proposed method. Volunteer images of the brain and knee were acquired to demonstrate the clinical feasibility. The proposed method was compared with T1w and T2w fast spin-echo (FSE) imaging.
Results:
The relative signal intensity of images acquired using the proposed method agreed closely with simulations and FSE imaging in phantoms. Images from volunteer imaging showed very similar contrast compared to conventional FSE imaging.
Conclusion:
RF phase-modulated GRE with small RF phase increments is an alternative method that provides simultaneous T1w and T2w contrast in short scan times with 3D volumetric coverage.
Keywords: Magnetic resonance imaging, gradient echo imaging, T1-weighted, T2-weighted, RF phase modulation
Introduction
Spin-lattice relaxation (T1), and spin-spin relaxation (T2), are the two most important relaxation mechanisms commonly exploited to provide soft tissue contrast in clinical MRI. Both T1- and T2-weighted (T1w, T2w) acquisitions play a ubiquitous role in almost every clinical MRI exam and are important for a variety of applications including lesion detection, characterization, and treatment monitoring. Fast spin-echo (FSE)-based MRI is the most widely used approach for T1w and T2w imaging but is generally limited to 2D acquisitions. While 3D-FSE-based acquisitions are feasible, the need for extended echo trains may compromise image contrast, and scan times remain long. Increasingly, spoiled gradient echo (SGRE) methods are being used for 3D T1w-MRI, but separate T2w-FSE-based imaging is still necessary.
Historically, FSE-based approaches have suffered from relatively long scan times, although this has been addressed in part through the use of parallel imaging(1,2), compressed sensing(3), and more recently synthetic imaging strategies(4). In addition, the need to acquire both T1w and T2w imaging in separate acquisitions increases the overall scan time. Current clinical approaches have several drawbacks including the use of 2D-FSE imaging, although some 3D-FSE methods(5) are showing increased use in clinical care. Overall, all FSE-based imaging approaches are relatively slow and inefficient. Therefore, strategies that can reduce scan time remain advantageous, particularly in an era with increased attention on “focused” MRI protocols(6).
SGRE methods(7) can provide high quality T1w-MRI using RF modulated GRE imaging with RF phase increments chosen carefully to spoil coherent transverse magnetization(8), leading to purely T1w contrast. T2w strategies using GRE imaging have been more challenging. Strategies including balanced steady state free precession (bSSFP) can provide some degree of T2-weighting(9), although bSSFP methods have mixed T2/T1 contrast. bSSFP also suffers from banding and flow related artifacts that can occur in the presence of magnetic field (B0) inhomogeneities. Steady-state sequences using free induction decay (FID, also known as FISP) and time reversed FISP (PSIF) with gradient spoiling can provide T2*- and T2-weighted imaging, respectively. In addition, dual-echo steady-state (DESS)(10) can be used to obtain FISP and PSIF signals simultaneously, although its use is limited to specific applications, such as knee imaging, due to its sensitivity to motion. Recently there has been interest in the use of RF phase-modulated GRE methods using small RF phase increments to encode T2-weighting into the complex GRE signal(11). In this work, we propose a novel RF phase-modulated GRE imaging strategy to obtain simultaneous T1w- and T2w-MRI, through separable encoding of T1w and T2w into real and imaginary components of the complex RF phase-modulated GRE signal.
Theory
We have adopted Sobol’s approach(12), which utilizes configuration theory(13) to explain the signal characteristics of steady-state RF phase-modulated SGRE. We consider a sequence with an RF pulse with flip angle of α, RF phase of ϕ, and repetition time of TR. RF phase modulation is performed by incrementing the transmit RF phase () quadratically such that , where θ is the RF phase increment(8,14). In this case, the steady-state complex signal (S) after RF excitation can be expressed as
| (1) |
| (2) |
with
| (3) |
where is the proton density, and and are real coefficients defined as
| (4) |
with
| (5) |
where and are determined from the diagonal elements, and , of the recursive matrix equation:
| (6) |
with the matrix defined as
| (7) |
where l = 1, …, L, where L is an integer determined to satisfy the following condition
| (8) |
where N is the minimum integer number to satisfy Eq. 8. For example, if , the smallest value of N that satisfies equation 8 is 1, and L = 180. A detailed explanation of the derivation of equation 7 is found in the Supporting Information (Appendix S1).
Equations 1 and 2 show that real and imaginary components of the signal have different contrast weighting. It is possible to control image contrast by changing and η, which depend on TR, α, and the RF phase increment, θ. In particular, the RF phase increment θ is an important parameter that can be used to adjust image contrast. Figure 1 (a, b) plots and η for various T1 and T2 values for a range of small RF phase increment values, with TR of 6 ms, and flip angle of 20°. Both and η decrease monotonically as θ increases over small RF phase increment range. Relatively large RF phase increments makes the absolute value of η large, which results in T1-weighting in both real and imaginary components.
Figure 1.
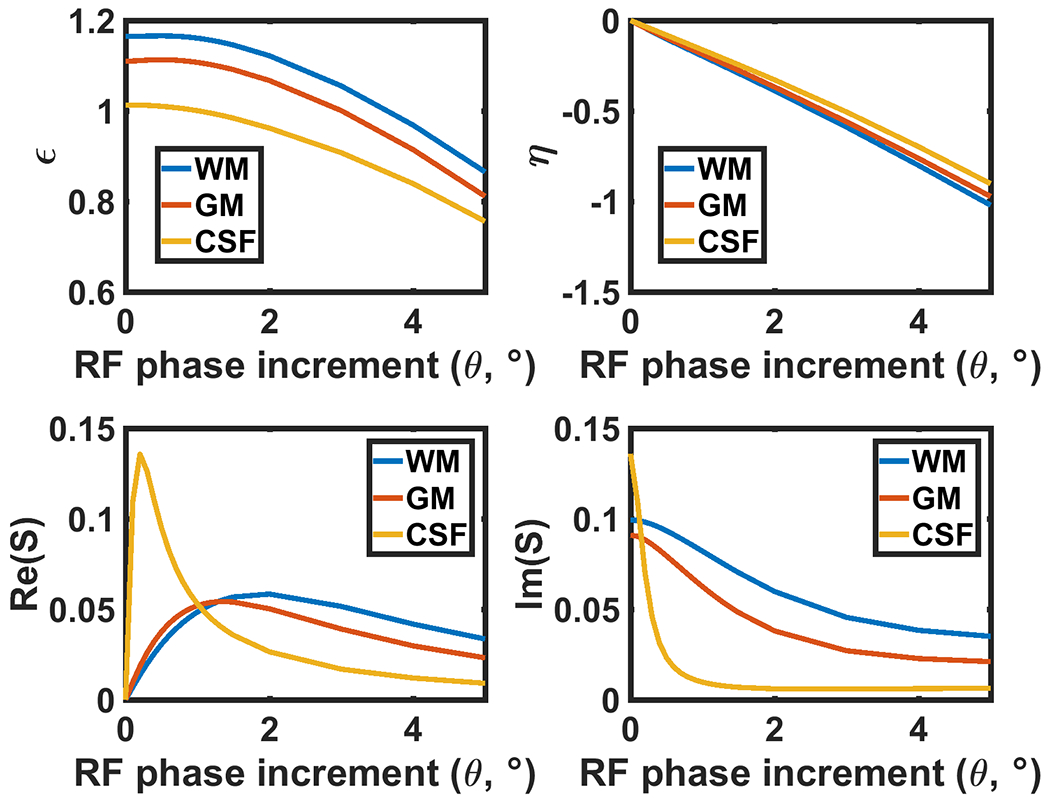
The coefficients ε and η, derived from Equation 4, are plotted over a range of physiological T1 and T2 values of various tissues with TR = 6 ms and flip angle of 20°. (c, d) The signal intensity plotted against RF phase increment corresponding to (a, b). The steady-state signal is determined by T1, T2, TR, flip angle, and these coefficients as described in Equations 1–3. The values of ϵ and η monotonically decrease with RF phase increment in all tissues shown. This behavior implies that the contrast of the RF phase modulated GRE imaging can be controlled by adjusting the RF phase increment.
Indeed, Eq. 2 becomes equivalent to the SGRE signal equation when η is sufficiently large (). Conversely, when small RF phase increments are used, the real component of the signal becomes more T2 weighted. Figure 1 (c, d) plots the real and imaginary components of the simulated signal as a function of RF phase increment, explicitly demonstrating this behavior, using typical T1 and T2 values(15–17) for gray matter (GM), white matter (WM) and cerebrospinal fluid (CSF) to illustrate this effect.
Figure 2a plots the real and imaginary components from Equations 1 and 2 with 6ms TR and 20° flip angle for different RF phase increments over a wide range of T1 and T2 values commonly experienced in vivo. Note that for the real component, for a fixed T1, increasing T2 leads to a monotonic increase in the real component of the complex GRE signal. Similarly, for the imaginary component, for a fixed T2, increasing T1 leads to a separable decrease in signal with increasing T1. Hence, this figure explicitly plots the effect outlined in Equations 1 and 2.
Figure 2.
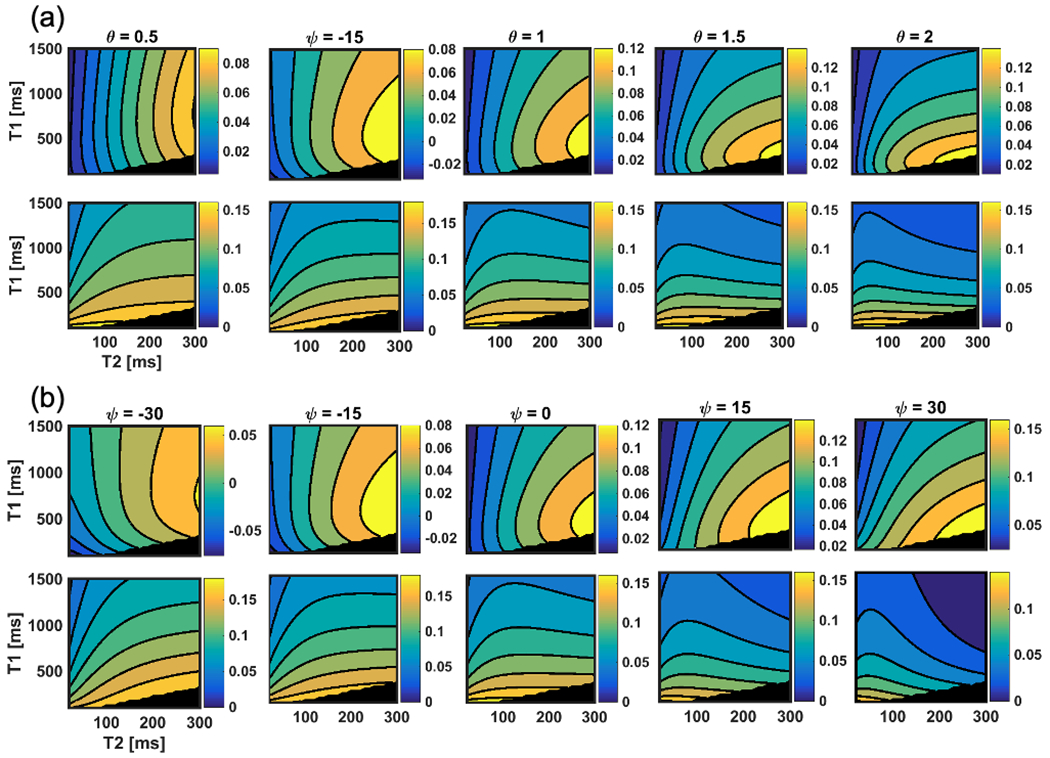
Calculated steady-state signal intensity of real (top row) and imaginary (bottom row) parts of the RF phase-modulated GRE signal as a function of T1 and T2 with varying (a) RF phase increment θ and (b) Ψ. Over a range of small RF phase increments, the imaginary signal (bottom row) is seen to depend heavily on T1, whereas the real component depends on both T1 and T2. These contour plots indicate that smaller RF phase increment provides higher T2w contrast in the real part of the signal. In addition, the plot (b) indicated that fine tuning of contrast could be possible by changing Ψ. The blackened area corresponds to non-physical combinations of T1 and T2 (T1 < T2).
Based on this theoretical framework, we propose the use of RF modulated 3D GRE imaging using small RF phase increments, such as 1-3°, to separate T1w and T2w signal components into the real and imaginary components of the complex signal. Note however, that for specific ranges of T1 and T2, the optimal RF phase increment may vary from application to application.
Since two different contrasts are encoded into real and imaginary components separately, it can be altered by modulating the signal phase. The signal equations with phase modulation can be expressed as
| (9) |
| (10) |
where and are real and imaginary components of the phase modulated signal, and and are the modulated phase for and , respectively. and can be determined independently in order to modulate the T2 and T1 contrast. Figure 2b shows the real and imaginary components with varying phase modulation. As shown in the plots, angle of contour lines can be tilted by adjusting the modulated phase of the signal.”
Importantly, complex RF phase-modulated GRE images also contain background phase shifts related to system imperfections including time independent phase shifts related to the receiver coil, complex B1 inhomogeneities, as well as time dependent phase shifts due to B0 inhomogeneities. In order to remove background phase, two passes of the RF phase-modulated GRE acquisition, which utilize positive and negative RF phase increments, can be performed. By performing a phase subtraction, the effects of background phase can be removed efficiently. The proposed two-pass approach used in this work is summarized in Figure 3. When a set of positive and negative RF phase increments are used, the sign of is inverted while remains the same. Therefore, the real and imaginary components can be extracted by subtracting and adding the images acquired from the two passes. Modulating and are performed before addition and subtraction, in order to generate T2w and T1w images, respectively. and can be adjusted empirically to provide similar contrast with T1/T2-weighted FSE images retrospectively. A procedure for determination of these values is explained in Supporting Information (Appendix S4).
Figure 3.
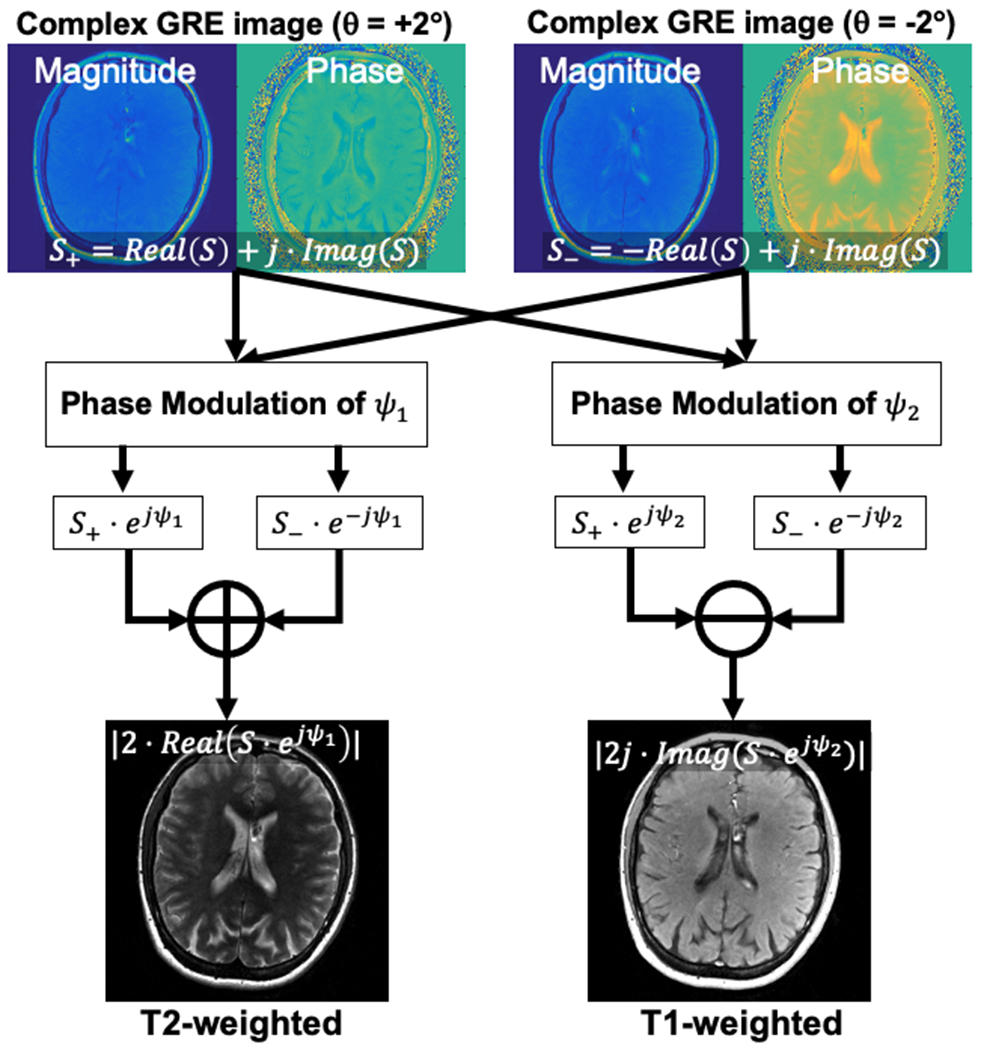
Proposed reconstruction scheme used in this study. In order to remove background phase, two acquisitions with opposite RF phase increments are acquired. These images are modulated with specific phase of Ψ1 and Ψ2 to improve T1 and T2 contrast. Finally, T1w and T2w images were calculated through addition and subtraction of modulated images.
Methods
We performed simulations, phantom, volunteer, and patient experiments to demonstrate the feasibility of this method. Simulations were used to validate the contrast mechanism explained above using a digital phantom. Also, Bloch equation simulations were performed to validate equations 1 and 2 in the Supporting Information (Appendix S2). The images using the proposed method were obtained using the following parameters: TR = 5.0–6.1 ms, TE = 2.0–2.3 ms, FA = 15–25°, θ = 1.25°, = 0–−15°, and = 0–30°. All FSE sequences used in this study were adopted from standard of care clinical protocols, which were previously optimized by expert radiologists to obtain T1 and T2 weighting, optimized differently for different region of the body. Detailed acquisition parameters for experiments are summarized in Tables 1 and 2.
Table 1.
Parameters for 2D FSE and the proposed method used for the phantom and health volunteers.
| Phantom | Brain | Knee | |||||||
|---|---|---|---|---|---|---|---|---|---|
|
| |||||||||
| Parameters | T1w FSE | T2w FSE | Proposed | T1w FSE | T2w FSE | Proposed | T1w FSE | T2w FSE | Proposed |
| TR | 868 ms | 3000 ms | 6.1 ms | 857 ms | 3484 ms | 6.1 ms | 708 ms | 3952 ms | 5 ms |
| (Effective) TE | 8.85 ms | 100 ms | 1.98 ms | 14 ms | 100 ms | 1.98 ms | 8.5 ms | 68.4 ms | 2.3 ms |
| Echo Train Length | 2 | 19 | NA | 3 | 19 | NA | 3 | 19 | NA |
| Flip Angle | 90° | 90° | 20° | 90° | 90° | 20° | 90° | 90° | 25° |
| Refocusing Flip Angle | 111° | 143° | NA | 111° | 143° | NA | 111° | 143° | NA |
| FOV | 24 × 24 cm2 | 24 × 24 cm2 | 24 × 24 × 10 cm3 | 24 × 24 cm2 | 24 × 24 cm2 | 24 × 24 × 16 cm3 | 18 × 18 cm2 | 18 × 18 cm2 | 20 × 20 × 12 cm3 |
| Matrix Size | 300×224 | 300×224 | 300×224×20 | 300×224 | 300×224 | 300×224×32 | 320 × 256 | 320 × 256 | 320 × 256 × 24 |
| Number of Slices | 16 | 16 | NA | 28 | 28 | NA | 3 mm | 3 mm | NA |
| Slice Thickness | 5 mm | 5 mm | NA | 5 mm | 5 mm | NA | 1 mm | 1 mm | NA |
| Bandwidth | 244 Hz/Px | 244 Hz/Px | 390 Hz/Px | 244 Hz/Px | 244 Hz/Px | 390 Hz/Px | 24 | 24 | 390 Hz/Px |
| RF phase increment | NA | NA | 1.25° | NA | NA | 1.25 ° | 195 Hz/Px | 195 Hz/Px | 1.25 ° |
| Ψ1/Ψ2 | NA | NA | −15°/30° | NA | NA | −15°/30° | NA | NA | 0°/0° |
| Scan Time | 1:20 min | 0:35 min | 0:51 min | 1:28 min | 0:56 min | 1:28 min | 1:04 min | 1:15 min | 1:02 min |
Table 2.
Parameters for isotropic imaging of healthy volunteer (left 4 columns) and patient scans with contrast agent (right 3 columns).
| Volunteer 3D isotropic imaging | Patient imaging | ||||||
|---|---|---|---|---|---|---|---|
|
| |||||||
| Parameters | MPRAGE | 3D T1W FSE | 3D T2W FSE | Proposed | T1W FSE | T2W FSE | Proposed |
| TR | 2094 ms | 552 ms | 3002 ms | 6.0 ms | 750-935 ms | 3000-5515 ms | 6.1 ms |
| (Effective) TE | 2.8 ms | 11.9 ms | 91.9 ms | 1.98 ms | 6.6 ms | 100 ms | 1.98 ms |
| Echo Train Length | NA | 22 | 130 | NA | 2 | 16-30 | NA |
| Flip Angle | 8° | 90° | 90° | 15° | 90° | 90° | 20° |
| Refocusing Flip Angle | NA | 111° | 143° | NA | 111° | 143° | NA |
| FOV | 240×240×160 | 22 × 22 cm2-24 × 24 cm2 | 22 × 22 cm2-24 × 24 cm2 | 22 × 22 × 14.4 cm3 | |||
| Matrix Size | 24 × 24 × 16 cm3 | 300×256-416×416 | 300×256-416×416 | 300×224×30-300×224×32 | |||
| Number of Slices | NA | 21-23 | 21-40 | NA | |||
| Bandwidth | 122 Hz/Px | 244 Hz/Px | 244 Hz/Px | 244 Hz/Px | 244 Hz/Px | 244 Hz/Px | 390 Hz/Px |
| RF phase increment | NA | NA | NA | 1.0° | NA | NA | 1.25° |
| Ψ1/Ψ2 | NA | NA | NA | −15°/30° | NA | NA | −15°/30° |
| Scan Time | 4:23 min | 4:17 min | 3:09 min | 3:32 min | 1:07-1:40 min | 1:00-2:24 min | 0:52-0:57 min |
Simulation
Three sets of Bloch equation simulations were performed to demonstrate image contrast dependency on θ, FA, and . The MR images of a digital brain phantom were calculated with varying θ (from 0.5° to 3.0° with FA = 20° and = 0°), FA (from 5° to 40° with θ = 1° and = 0°), and (from −30° to +30° with θ = 1° and FA = 20°) using Equations 1, 2, 9 and 10. TR of 6 ms was used. The digital phantom was downloaded from MRiLab project by Liu et al (18) comprising of anatomical representations of the brain with physiological T1 and T2 values mapped within the images. Using the digital phantom, Equations 1 and 2 were used to predict the GRE signal generated using RF phase modulated GRE imaging with variable RF phase increments and flip angles. In addition, a smoothly varying phase error was added to each acquisition in order to simulate background phase errors. The distribution of the phase error was determined using the linear combination of the polynomials defined as
| (11) |
where and are the linear combination coefficient, and are the coordinate of the image, and and are the image size along and . The values of and were determined randomly such that the peak-to-peak magnitude of the phase error was less than 6. Using the proposed two-pass strategy, phase subtraction was performed, and the real and imaginary components of the resulting signal difference were used to generate separable T1w and T2w images.
Phantom Experiments
A phantom consisting of a 4×4 matrix of 16 vials was constructed to create varying combinations of T1 and T2. T1 was modulated through increasing concentrations of MnCl2 ranging from (0.0,0.5,1.0, and 2.0mM), while T2 was modulated by adding increasing concentrations of agar with increasing concentrations from (0.5,1.0,2.0, and 4.0weight/volume%). Quantitative values for the vials are described in Supporting Information (Appendix S3).
Conventional T2w-FSE and T1w-SGRE imaging were also performed to serve as a qualitative reference standard to compare to the proposed 3D RF phase-modulated GRE method.
The signal intensity of the acquired signal was measured and normalized by the maximum signal in order to compare the measured T1w and T2w signal intensities to Bloch equation simulations. In addition, a similar comparison was made of normalized signal intensity with the proposed method and T1w-SGRE and T2w-FSE imaging. Linear regression was performed to assess the correlation and agreement between the measured, simulated and measured signals for T1w-SGRE and T2w-FSE imaging.
In vivo Experiments
Healthy volunteers were recruited from an Institutional Review Board (IRB) approved database of healthy volunteers available for MRI studies of the brain and knee. After providing informed written consent, subjects underwent non-contrast MRI to assess the feasibility of the proposed 3D RF phase-modulated GRE method. In addition, conventional T1w-FSE and T2w-FSE imaging were performed to serve as reference images.
Isotropic imaging was performed using conventional sequences and the proposed method. Specifically, T1w and T2w images were acquired in a healthy volunteer recruited from an IRB-approved database of volunteer for MRI studies, and after obtaining written informed consent. For the comparison of T1w images, MPRAGE and 3D T1w FSE were acquired, whereas 3D T2w FSE was performed to compare T2w contrast to the proposed method.
To demonstrate the feasibility of the proposed method for contrast enhanced imaging, pre- and post-contrast MRI scans of patients were performed using standard of care 2D FSE and the proposed method. After obtaining IRB approval, patients referred for imaging of brain tumor, and scheduled for clinically indicated contrast enhanced MRI of the brain were recruited. Post-contrast images were acquired at least 5 min after injection of 0.1 mmol/kg of gadobenate dimeglumine. Image quality of the images acquired using the proposed method was evaluated by two radiologists. The readers independently scored the T1/T2 contrast, and enhancement quality on a four-point scale as follows: 1 = poor (unacceptable for diagnostic use), 2 = acceptable, 3 = good, 4 = excellent (comparable to standard of care). Additionally, significance of motion artifacts was evaluated with a four-point scale as follows: 1 = severe apparent motion artifact in most/all images, essentially non-diagnostic, 2 = substantial apparent motion artifact, interfering with diagnostic image quality in approximately half of images, 3 = some apparent motion artifact, mild interference with diagnostic quality in some images, 4 = minimal to no apparent motion artifact.
Results
Simulation
Example images of the digital phantoms used to generate simulated 3D RF phase modulated GRE images are shown in Figure 4a. The original T1 and T2 maps of the digital phantom are shown in Supporting Information (Appendix S5). These figures explicitly demonstrate how the image contrast can be controlled by changing RF phase increment.
Figure 4.
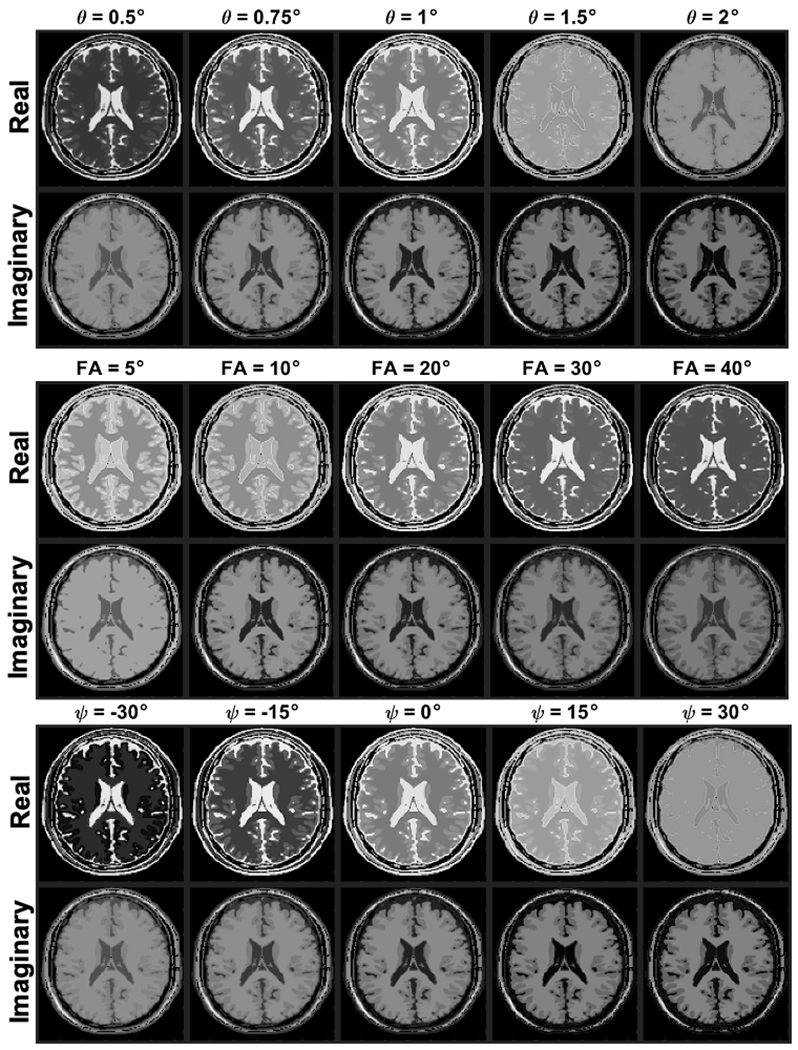
Real and imaginary components of the digital phantom calculated using the proposed method with variable RF phase increments, flip angles, and Ψ. These results indicate that all of them affect the contrast of the images. Strong T1 contrast in the imaginary component can be obtain with large RF phase increment while very small RF phase increment makes strong T2 contrast in the real component. As the flip angle increase, T2 contrast becomes stronger in the real components. Negative values of Ψ makes strong T2 contrast in the real component whereas stronger T1 contrast is possible with positive Ψ in the imaginary component.
Figure 4b shows the calculated images with varying flip angles and fixed RF phase increment of 1°, demonstrating the effects of flip angle on the contrast of both real and imaginary components. Subjectively, the proposed method demonstrates typical T1w and T2w contrast observed at small RF phase increments between white matter, gray matter, and cerebrospinal fluid.
Modulating also affects image contrasts, as shown in Figure 4c. Positive phase modulation weakens T2w contrast from the real component, whereas a negative phase provides stronger T2w. In contrast to the real component, T1w contrast becomes stronger as increases.
Phantom Experiments
Figure 5a plots the T1w and T2w signal intensities, in comparison to that predicted by Equations 1, 2, 9, and 10. Both acquired and simulated signal intensities were normalized by the vial with maximum signal intensity. Linear regression demonstrates high correlation for real (R2 =0.94) and imaginary (R2 =0.95) components with a slope of 0.97 (95% confidence interval (CI)=0.85-1.08) and intercept of 0.11 (95%CI=0.063-0.16) for the real component, and slope of 0.95 (95%CI=0.85-1.04.) and intercept of 0.01 (95%CI=−0.049-0.073) for the imaginary component, demonstrating excellent agreement. Spatially varying B1 sensitivity, which is not considered in the simulation, may contribute to small differences between measured and predicted results.
Figure 5.
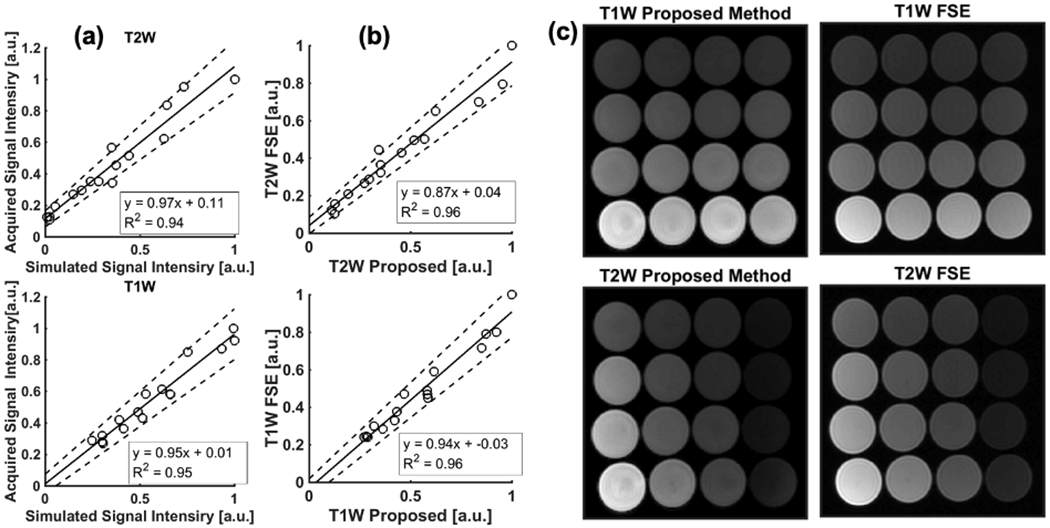
(a) Scatter plots of T1w and T2w parts of GRE signal comparing simulated and acquired signal intensities in phantoms. The intensities were agreed well for both real and imaginary parts with slope and intercept close to one and zero, respectively. B1 sensitivity of receiver coil may affect the correlation since the simulation does not consider and inhomogeneous B1 sensitivity distribution. Solid and dashed lines show regression line, and confidence interval, respectively. (b) Scatter plots of T1w and T2w parts of acquired images between GRE and FSE sequences demonstrate that normalized signal intensities of GRE with FA = 20° and RF phase increment of 1.25° agreed well with those acquired using FSE. (c) Phantom images acquired using the proposed 3D RF phase-modulated GRE, compared to 2D-FSE.
Figure 5 (b and c) shows phantom images acquired using the proposed method and FSE and plots of the normalized signal intensity of the real and imaginary components compared to T2w- and T1w-FSE, also demonstrating excellent correlation and agreement. The slopes of the linear regression for T1w- and T2w-MRI were 0.94 (95%CI=0.86-1.03) and 0.87 (95%CI=0.79-0.96) while the intercepts for them were −0.03 (95%CI=-−0.084-0.018) and 0.04 (95%CI=−0.0038-0.084), respectively.
In vivo Experiments
Figure 6a shows the T1w and T2w components of the phase corrected two-pass 3D RF phase-modulated images acquired using the proposed GRE method. Also shown are conventional 2D T1w- and T2w-FSE acquisitions, demonstrating excellent qualitative agreement between the two imaging methods. We note that the typical contrast observed between grey matter, white matter, and cerebrospinal fluid is observed with both the proposed GRE-based T1w- and T2w images. Excellent image quality was seen in all slices across the entire volume. For T1w-MRI, the relative gray-white matter contrast using the proposed method showed slightly weaker than that of FSE. Overall, excellent visualization of the anatomical structures within the brain were observed. However, we note some focal degradation of the signal in the cerebrospinal fluid within the lateral ventricles and some blurring of the caudate nucleus was also seen. In addition, the basal ganglia on the T2w images demonstrated slightly better contrast using conventional FSE. Interestingly, time of flight inflow effects were noted in cerebral arteries in the more inferior slices, using the proposed T1w (magnitude) component, as might be expected for 3D-GRE. Acquisition time for the proposed method was 1:28min without the use of any parallel imaging, while T1w- and T2w-FSE required a total of 2:24min.
Figure 6.
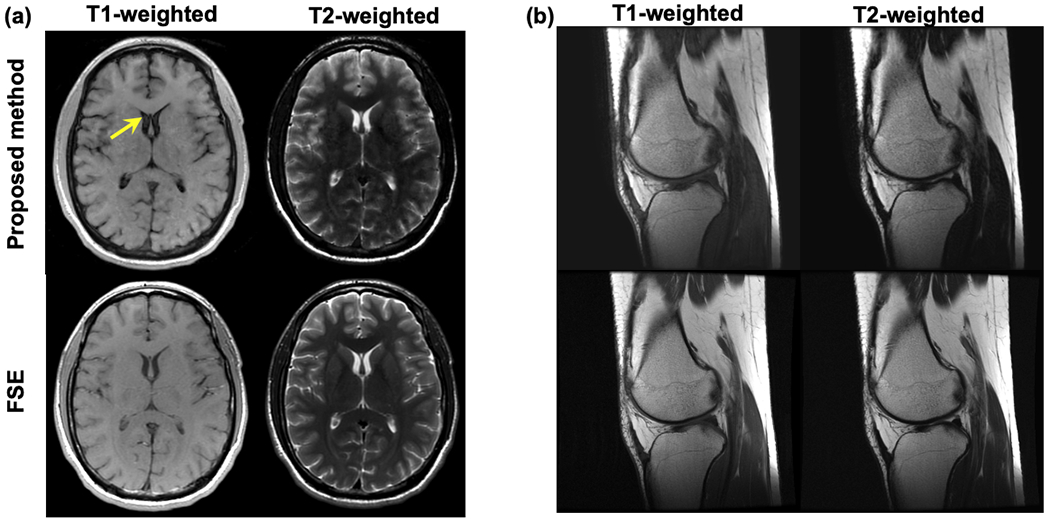
T1w and T2w images of (a) the brain and (b) knee produced using the proposed method, compared with T1w and T2w FSE. Both images using the proposed method had similar contrast to those using FSE imaging. The proposed method exhibited slightly weaker gray-white matter T1w contrast, and slightly weaker T2w contrast in the basal ganglia. Further optimization of the flip angle and RF phase increment may improve contrast. Mild flow related artifacts were also observed in the CSF (arrow).
Figure 6b shows T1 and T2w images using the FSE and proposed GRE methods in the knee of a healthy volunteer. Both images demonstrated good image quality. The cartilage signal in T1 and T2w images acquired using the proposed method agreed qualitatively with those using T1w and T2w FSE.
Isotropic T1w and T2w images acquired using 3D FSE, MPRAGE, and the proposed method are shown in Fig. 7. Both T1w and T2w images show similar contrast compared to conventional imaging methods, although a small amount of signal loss, possibly due to T2* decay, adjacent to the paranasal sinuses was observed. The axial and coronal cross-section images, which are reformatted from sagittal images, demonstrated that the proposed method can achieve high-resolution isotropic imaging in a relatively short acquisition time.
Figure 7.
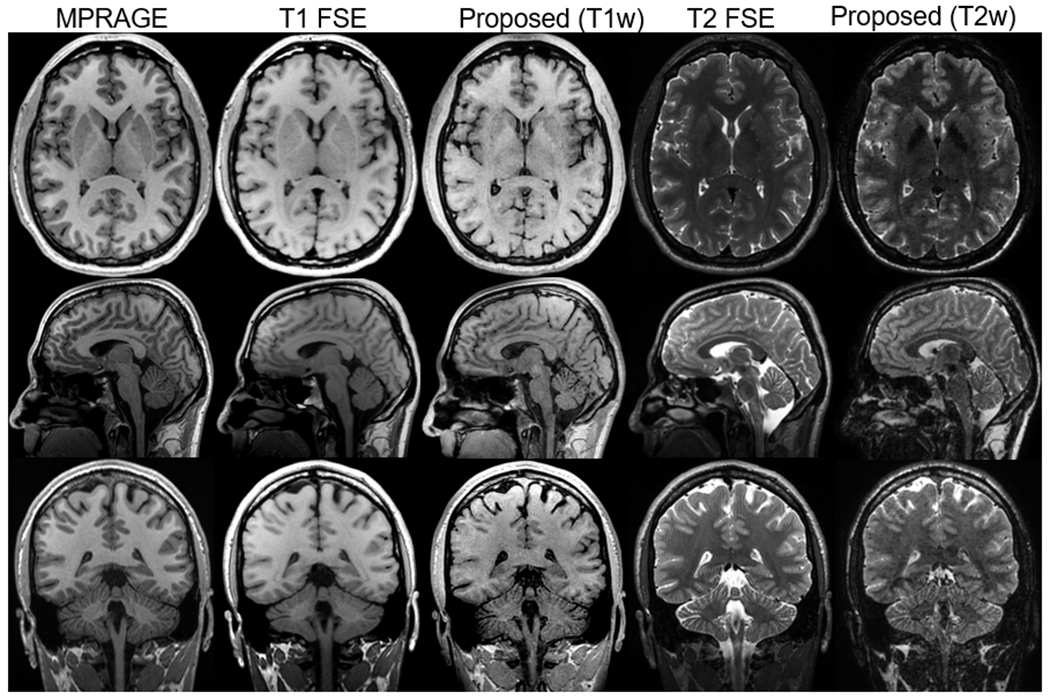
Isotropic T1w and T2w imaging of the brain using MPRAGE, 3D FSE, and the proposed method. Acquisitions were done with the sagittal plane. Axial and coronal images were reformatted from the sagittal images. The proposed method demonstrated comparable T1w and T2w contrast to 3D FSE, although SNR is slightly lower than other methods. The scan time for the proposed method was 3:32 min, which is half of the scan time of conventional T1/T2w imaging.
A total of 8 patients were successfully recruited for the patient evaluation. Figure 8 shows an example T1w and T2w images of a patient with a small meningioma before and after the injection of contrast, compared to standard of care FSE images. Representative GRE images for the remaining 7 patients are shown in Supporting Information (Appendix S6). The evaluation by the radiologist suggested the T1w and T2w contrasts (Reader 1: 3.0±0.0, Reader 2: 3.75±0.71) and enhancement quality (Reader 1: 3.6±0.53, Reader 2: 3.5±1.1) of the proposed method are good to excellent on average. Strong contrast enhancement effect in T1w images was observed while there was minimal to no effect on T2w image contrast after the injection of gadolinium. Importantly, only minor motion artifacts were observed in brains of patients in the clinical study (Reader 1: 2.6±0.52, Reader 2: 2.6±0.52); moderate artifacts due to ocular motion were observed in some patients. Importantly, there were no obvious artifacts caused by inter-pass motion, which we would expect to lead to bulk misregistration artifact. Very subtle high intensity signal on some cortical surfaces and periventricular white matter were observed in the pre-contrast T1w images of some patients, as well as minor ringing-like artifacts from CSF in T2w images.
Figure 8.
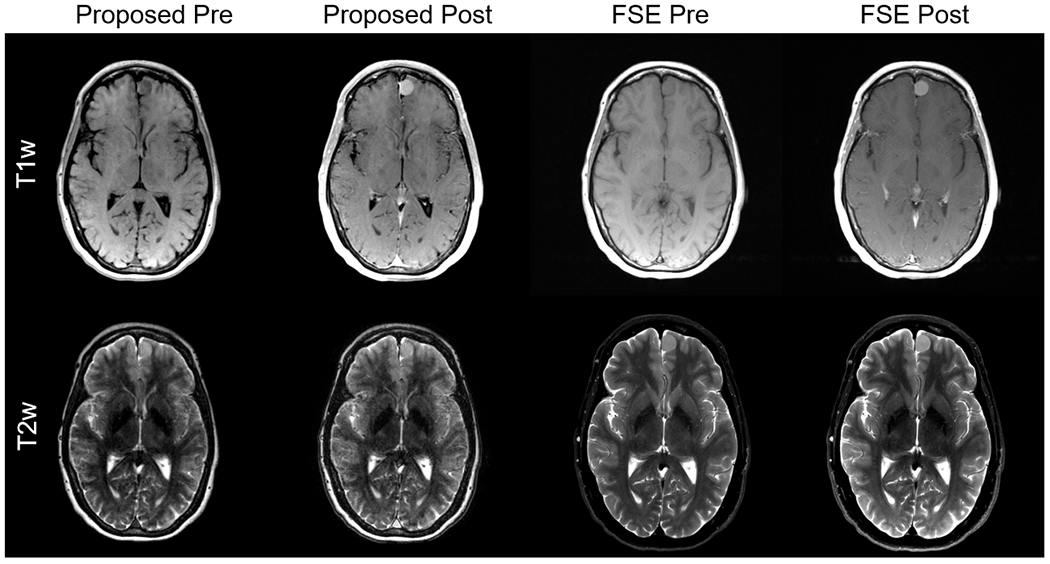
Example images of pre- and post-contrast acquisition using the proposed and FSE methods. The FSE images were acquired with PROPELLER technique, which is a standard clinical protocol in our institute. Image qualities of images from 7 patients were rated by two radiologists. The contrast and enhancement qualities were rated as good to excellent. Besides, there were no significant motion artifacts though moderate artifacts due to the eyeball motion were observed. The results of the evaluation suggested the proposed method is clinically acceptable.
Discussion
In this work, we have proposed and demonstrated the feasibility of a novel 3D RF phase-modulated GRE imaging technique to obtain simultaneous T1- and T2-weighted images using complex information of the acquired images. In this approach, we use an RF phase-modulated strategy that acquires 3D GRE images with a small RF phase increment. Both Bloch equation simulations and closed form equations demonstrate that the phase imparted into the signal results in separable T1w and T2w signals in the real and imaginary components of the complex signal. By performing a two-pass strategy with reversal of the RF phase increment, background phase shifts can be removed. We have successfully demonstrated the feasibility of this method in simulations and phantoms, demonstrating excellent agreement with both theory and conventional T1 and T2w imaging, as well as good qualitative agreement using both anatomical digital phantoms and in vivo in healthy volunteers.
The proposed strategy may offer an alternative approach to the acquisition of acquisition of sequentially acquired T1w and T2w imaging. Further, the short acquisition time may be advantageous for rapid or focused MRI protocols that require both contrast mechanisms as part of the standard examination. Past strategies with GRE imaging using partial RF-spoiling have been proposed to obtain various contrast mechanisms and quantitative maps. Ganter introduced a closed-form of steady-state of GRE with partial RF spoiling and demonstrated heavy T2 like contrast and CSF-suppressed imaging using magnitude information of the acquired signal(19). In contrast, the proposed method utilizes the complex RF-modulated signal to decompose the phase-corrected signal into T1- and T2-weighted images. Further, Bieri et al have also used partial RF spoiling strategies to perform T2 mapping, using the magnitude of the RF spoiled GRE acquisitions(20). T1w and T2w 3D FSE imaging are increasingly used in clinical MRI applications, although it is not widely used as an alternative to 2D FSE due to long scan times, lower spatial resolution, and limited T2 contrast due to the use of long echo trains and variable flip angle refocusing pulses. Further, emerging synthetic MRI methods can provide various contrast 2D images using multi-dynamic multi-echo(4) and IR-bSSFP(21) sequences, which enable synthetic MRI from multiple images acquired separately. Furthermore, the feasibility of 3D synthetic MRI using an interleaved Look-Locker acquisition with T2 preparation pulse(22–24) and multi-pathway multi-echo sequences(25) has been demonstrated though is not commercially available. Although it offers relatively faster multi-contrast imaging than conventional methods, it still requires several minutes of acquisition time, uses a fundamentally different acquisition strategy that does not perform true simultaneous T1 and T2 weighting as does the proposed method. MR fingerprinting(21), which utilizes non-steady-state signal evolution and dictionary-based reconstruction, also can be used for synthetic MRI. These methods are a fundamentally different approach, including the use of non-Cartesian acquisitions.
Unlike these past techniques however, our approach provides both T1w and T2w imaging in the same acquisition, potentially reducing the overall acquisition time as well as providing perfectly co-registered T1w and T2w images. In addition, the use of 3D acquisitions would facilitate 2D parallel imaging acceleration, potentially reducing overall scan time even further. Isotropic imaging, which could improve lesion detection and evaluation performance, is a potential application of our method. It is generally achieved by using 3D T2w FSE, T1w SGRE, and MPRAGE although these methods suffer from relatively longer scan time. On the other hand, the proposed method could enable high-resolution isotropic imaging in clinically acceptable scan time.
There are several limitations of this work that should be addressed in future studies. First, as the RF phase-modulated GRE acquisitions are obtained in the steady state, magnetization preparation strategies such as fat saturation pulses and inversion recovery pulses may not be compatible with this strategy. The use of multi-point Dixon strategies(26–28), however, should be fully compatible with this approach, and thus fat suppression should be attainable through such chemical shift encoded fat-water separation strategies. In addition, our proposed strategy requires two passes, in order to remove background phase effects, doubling the scan time compared to a single pass GRE acquisition. This also leads to the potential for misregistration artifacts related to motion. Although some minor motion artifacts were observed, none were clearly related to inter-pass motion in patient studies. Further clinical validation in larger patient cohorts will be needed to evaluate for possible motion-related artifacts. Should calibration scans that provide estimates of the background phase be available, the proposed strategy could be reduced to a single acquisition. As the two passes are identical in every regard, except for the sign of the RF phase increment, complications such as variations in signal intensity between the two passes should not impact this strategy in any negative manner.
One potential limitation is the presence of inter-pass motion, leading to potential misregistration of the two acquisitions, which could lead to inaccurate removal of the background phase, leading to corruption of the T1 and T2w components of the signal. Further work will be needed to determine the impact of this potential limitation. In our experience, this limitation was only observed in the CSF. Further work into the effects of motion from CSF, blood flow and other types of motion are needed, including strategies such as flow compensation or fractional readout. The use of small RF phase increments in combination with unbalanced gradients may lead to motion related phase errors (29). Further studies, investigating the sensitivity of the proposed method to motion and flow, and if needed the optimization of the spoiling gradient axis and moment or may be required.
Another potential limitation is the effect of signal components with very short T2*. In principle, the presence of very short T2* signal within the tissue could potentially impact the proposed separation of T1w and T2w signal components. So long as the signal has sufficient signal to noise ratio (SNR), the presence of T2* decay should not impact the phase measurement and thus in principle, the proposed method should be relatively insensitive to T2* signal decay. B1 inhomogeneities may also affect contrast of acquired images. Although these effects are probably small in the brain, they may be more significant in other regions of the body such as the abdomen, especially at 3T. Further evaluation, including simulations, experiments and clinical abdominal imaging studies would be needed to assess for this potential effect (30).
In addition to further clinical evaluation of the proposed method, further work is needed to consider additional optimization specific to particular applications. Variables to consider include the RF phase increment, flip angle and TR. Given that relaxation parameters are known to vary with field strength, optimization at different field strengths may also be needed, just as is needed with conventional T1w and T2w imaging. Optimization of the flip angle and RF phase increment can be used to adjust the relative degree of T1 and T2 weighting and further optimization is needed to determine optimal acquisition parameters, and likely depends on specific applications.
In addition, future validation in larger cohorts of patients with pathology in comparison to conventional T1w and T2w imaging will be needed. Implementation with other strategies aimed at reducing scan time such as parallel imaging, compressed sensing, as well as multi-point Dixon strategies(31) for fat-water separation will also enhance the potential utility of this approach. However, we note that the purpose of this work was to demonstrate the feasibility of the underlying signal mechanism and thus these potential augmentations of the technique are beyond the scope of this work. In addition, the effects of contrast administration resulting in shortening of both T1 and T2 should also be examined rigorously to determine the effects of contrast on the proposed method.
In conclusion, we have successfully developed an RF phase-modulated GRE method for simultaneous 3D T1w and T2w imaging with potential for use in rapid, focused MRI exams for perfectly co-registered and simultaneous T1w and T2w MRI.
Supplementary Material
Supporting Information Figure S2.1 The steady-state of GRE calculated using Equations 1–3 compared with Bloch equation simulations using the following parameters: TR =10 ms, flip angle = 25°, RF phase increment = 1.5°. Both real and imaginary parts of the steady-state signal calculated analytically and through Bloch equation simulations agreed well. The blackened area corresponds to non-physical combinations of T1 and T2 (T1 < T2).
Supporting Information Figure S3.1 T1 and T2 maps of the vials used in this study. The number written in the figure corresponds to those in Table S3.1.
Supporting Information Figure S4.1 Example of contrast change depends on and . As increase, T2-weighted contrast becomes heavy while dcreasing provides T1-weighted contrast.
Supporting Information Figure S5.1 T1 and T2 maps for digital brain phantom used in this study.
Supporting Information Figure S6.1 T1 and T2w GRE images of patients 1–7 There is no pathologic enhancement in the patients 1, 4, and 6.
Acknowledgements
The authors acknowledge support from UW ICTR through CTSA grant UL1TR002373 from NIH/NCATS. Further, the authors acknowledge GE Healthcare who provides research support to the University of Wisconsin-Madison. Finally, Dr. Reeder is a Romnes Faculty Fellow, and has received an award provided by the University of Wisconsin-Madison Office of the Vice Chancellor for Research and Graduate Education with funding from the Wisconsin Alumni Research Foundation.
Data Availability Statement
Phantom, human data, and Matlab code will be available upon request and adherence to data use and code sharing agreements with UW-Madison at https://radiology.wisc.edu/research/data/.
References
- 1.Pruessmann KP, Weiger M, Scheidegger MB, Boesiger P. SENSE: sensitivity encoding for fast MRI. Magnetic Resonance in Medicine: An Official Journal of the International Society for Magnetic Resonance in Medicine 1999;42(5):952–962. [PubMed] [Google Scholar]
- 2.Griswold MA, Jakob PM, Heidemann RM, Nittka M, Jellus V, Wang J, Kiefer B, Haase A. Generalized autocalibrating partially parallel acquisitions (GRAPPA). Magnetic Resonance in Medicine: An Official Journal of the International Society for Magnetic Resonance in Medicine 2002;47(6):1202–1210. [DOI] [PubMed] [Google Scholar]
- 3.Lustig M, Donoho D, Pauly JMJMRiMAOJotISfMRiM. Sparse MRI: The application of compressed sensing for rapid MR imaging. 2007;58(6):1182–1195. [DOI] [PubMed] [Google Scholar]
- 4.Warntjes J, Leinhard OD, West J, Lundberg P. Rapid magnetic resonance quantification on the brain: optimization for clinical usage. Magnetic Resonance in Medicine: An Official Journal of the International Society for Magnetic Resonance in Medicine 2008;60(2):320–329. [DOI] [PubMed] [Google Scholar]
- 5.Busse R, Brau A, Beatty P, Brittain J, Sun L, Hariharan H, Gold G, Rowley H, Sadowski E, Reeder S. Design of refocusing flip angle modulation for volumetric 3D-FSE imaging of brain, spine, knee, kidney and uterus. Signal 2007;900:80. [Google Scholar]
- 6.van Beek EJ, Kuhl C, Anzai Y, Desmond P, Ehman RL, Gong Q, Gold G, Gulani V, Hall-Craggs M, Leiner T. Value of MRI in medicine: More than just another test? Journal of Magnetic Resonance Imaging 2019;49(7):e14–e25. [DOI] [PMC free article] [PubMed] [Google Scholar]
- 7.Epstein FH, Mugler III JP, Brookeman JR. Spoiling of transverse magnetization in gradient-echo (GRE) imaging during the approach to steady state. Magnetic resonance in medicine 1996;35(2):237–245. [DOI] [PubMed] [Google Scholar]
- 8.Zur Y, Wood M, Neuringer L. Spoiling of transverse magnetization in steady-state sequences. Magnetic resonance in medicine 1991;21(2):251–263. [DOI] [PubMed] [Google Scholar]
- 9.Scheffler K, Lehnhardt S. Principles and applications of balanced SSFP techniques. European radiology 2003;13(11):2409–2418. [DOI] [PubMed] [Google Scholar]
- 10.Bruder H, Fischer H, Graumann R, Deimling M. A new steady-state imaging sequence for simultaneous acquisition of two MR images with clearly different contrasts. Magnetic resonance in medicine 1988;7(1):35–42. [DOI] [PubMed] [Google Scholar]
- 11.Wang X, Hernando D, Reeder SB. Phase-based T2 mapping with gradient echo imaging. Magnetic Resonance in Medicine 2019. [DOI] [PMC free article] [PubMed] [Google Scholar]
- 12.Sobol WT, Gauntt DM. On the stationary states in gradient echo imaging. Journal of Magnetic Resonance Imaging 1996;6(2):384–398. [DOI] [PubMed] [Google Scholar]
- 13.Hennig J Echoes—how to generate, recognize, use or avoid them in MR-imaging sequences. Part II: Echoes in imaging sequences. Concepts in Magnetic Resonance 1991;3(4):179–192. [Google Scholar]
- 14.Crawley AP, Wood ML, Henkelman RM. Elimination of transverse coherences in FLASH MRI. Magnetic resonance in medicine 1988;8(3):248–260. [DOI] [PubMed] [Google Scholar]
- 15.Wansapura JP, Holland SK, Dunn RS, Ball WS Jr. NMR relaxation times in the human brain at 3.0 tesla. Journal of Magnetic Resonance Imaging: An Official Journal of the International Society for Magnetic Resonance in Medicine 1999;9(4):531–538. [DOI] [PubMed] [Google Scholar]
- 16.Chen L, Bernstein M, Huston J, Fain S. Measurements of T1 relaxation times at 3.0 T: implications for clinical MRA. 2001. [Google Scholar]
- 17.Spijkerman JM, Petersen ET, Hendrikse J, Luijten P, Zwanenburg JJ. T 2 mapping of cerebrospinal fluid: 3 T versus 7 T. Magnetic Resonance Materials in Physics, Biology and Medicine 2018;31(3):415–424. [DOI] [PMC free article] [PubMed] [Google Scholar]
- 18.Liu F, Velikina JV, Block WF, Kijowski R, Samsonov AA. Fast realistic MRI simulations based on generalized multi-pool exchange tissue model. Ieee T Med Imaging 2016;36(2):527–537. [DOI] [PMC free article] [PubMed] [Google Scholar]
- 19.Ganter C Steady state of gradient echo sequences with radiofrequency phase cycling: Analytical solution, contrast enhancement with partial spoiling. Magnetic Resonance in Medicine 2006;55(1):98–107. [DOI] [PubMed] [Google Scholar]
- 20.Bieri O, Scheffler K, Welsch GH, Trattnig S, Mamisch TC, Ganter C. Quantitative Mapping of T-2 Using Partial Spoiling. Magnetic Resonance in Medicine 2011;66(2):410–418. [DOI] [PubMed] [Google Scholar]
- 21.Ji S, Yang D, Lee J, Choi SH, Kim H, Kang KM. Synthetic MRI: Technologies and Applications in Neuroradiology. J Magn Reson Imaging 2020. [DOI] [PubMed] [Google Scholar]
- 22.Brittain JH, Hu BS, Wright GA, Meyer CH, Macovski A, Nishimura DG. Coronary angiography with magnetization-prepared T2 contrast. Magnetic resonance in medicine 1995;33(5):689–696. [DOI] [PubMed] [Google Scholar]
- 23.Kvernby S, Warntjes MJB, Haraldsson H, Carlhäll C-J, Engvall J, Ebbers T. Simultaneous three-dimensional myocardial T1 and T2 mapping in one breath hold with 3D-QALAS. Journal of Cardiovascular Magnetic Resonance 2014;16(1):1–14. [DOI] [PMC free article] [PubMed] [Google Scholar]
- 24.Fujita S, Yokoyama K, Hagiwara A, Kato S, Andica C, Kamagata K, Hattori N, Abe O, Aoki S. 3D Quantitative Synthetic MRI in the Evaluation of Multiple Sclerosis Lesions. AJNR Am J Neuroradiol 2021;42(3):471–478. [DOI] [PMC free article] [PubMed] [Google Scholar]
- 25.Cheng CC, Preiswerk F, Madore B. Multi-pathway multi-echo acquisition and neural contrast translation to generate a variety of quantitative and qualitative image contrasts. Magn Reson Med 2020;83(6):2310–2321. [DOI] [PMC free article] [PubMed] [Google Scholar]
- 26.Glover G, Schneider E. Three-point Dixon technique for true water/fat decomposition with B0 inhomogeneity correction. Magnetic resonance in medicine 1991;18(2):371–383. [DOI] [PubMed] [Google Scholar]
- 27.Ma J Dixon techniques for water and fat imaging. Journal of Magnetic Resonance Imaging: An Official Journal of the International Society for Magnetic Resonance in Medicine 2008;28(3):543–558. [DOI] [PubMed] [Google Scholar]
- 28.Bley TA, Wieben O, François CJ, Brittain JH, Reeder SB. Fat and water magnetic resonance imaging. Journal of Magnetic Resonance Imaging 2010;31(1):4–18. [DOI] [PubMed] [Google Scholar]
- 29.Duyn JH. Steady state effects in fast gradient echo magnetic resonance imaging. Magnetic resonance in medicine 1997;37(4):559–568. [DOI] [PubMed] [Google Scholar]
- 30.Roberts NT, Hinshaw LA, Colgan TJ, Ii T, Hernando D, Reeder SB. B0 and B1 inhomogeneities in the liver at 1.5 T and 3.0 T. Magn Reson Med 2021;85(4):2212–2220. [DOI] [PMC free article] [PubMed] [Google Scholar]
- 31.Dixon WT. Simple proton spectroscopic imaging. Radiology 1984;153(1):189–194. [DOI] [PubMed] [Google Scholar]
Associated Data
This section collects any data citations, data availability statements, or supplementary materials included in this article.
Supplementary Materials
Supporting Information Figure S2.1 The steady-state of GRE calculated using Equations 1–3 compared with Bloch equation simulations using the following parameters: TR =10 ms, flip angle = 25°, RF phase increment = 1.5°. Both real and imaginary parts of the steady-state signal calculated analytically and through Bloch equation simulations agreed well. The blackened area corresponds to non-physical combinations of T1 and T2 (T1 < T2).
Supporting Information Figure S3.1 T1 and T2 maps of the vials used in this study. The number written in the figure corresponds to those in Table S3.1.
Supporting Information Figure S4.1 Example of contrast change depends on and . As increase, T2-weighted contrast becomes heavy while dcreasing provides T1-weighted contrast.
Supporting Information Figure S5.1 T1 and T2 maps for digital brain phantom used in this study.
Supporting Information Figure S6.1 T1 and T2w GRE images of patients 1–7 There is no pathologic enhancement in the patients 1, 4, and 6.
Data Availability Statement
Phantom, human data, and Matlab code will be available upon request and adherence to data use and code sharing agreements with UW-Madison at https://radiology.wisc.edu/research/data/.


