Abstract
The mammalian cerebral cortex has an unparalleled diversity of cell types, which are generated during development through a series of temporally orchestrated events that are under tight evolutionary constraint and are critical for proper cortical assembly and function1,2. However, the molecular logic that governs the establishment and organization of cortical cell types remains elusive, largely due to the large number of cell classes undergoing dynamic cell-state transitions over extended developmental timelines. Here, we have generated a comprehensive single-cell RNA-seq and single-cell ATAC-seq atlas of the developing mouse neocortex, sampled every day throughout embryonic corticogenesis and at early postnatal ages, complemented with a spatial transcriptomics time-course. We computationally reconstruct developmental trajectories across the diversity of cortical cell classes, and infer their spatial organization and the gene regulatory programs that accompany their lineage bifurcation decisions and differentiation trajectories. Finally, we demonstrate how this developmental map pinpoints the origin of lineage-specific developmental abnormalities linked to aberrant corticogenesis in mutant animals. The data provides a global picture of the regulatory mechanisms governing cellular diversification in the neocortex.
The development of the mammalian cerebral cortex has been Intensively studied over the past decades1,2. However, large gaps in knowledge remain: the global regulatory mechanisms governing cellular differentiation and diversification; when neuronal subtype identity is established; how lineage bifurcation decisions are controlled. These questions require a comprehensive view of the development of all cortical cells, across all developmental times, to define the molecular logic of cellular diversification of the neocortex.
Here, we built a comprehensive single-cell transcriptional and epigenetic atlas of the developing somatosensory cerebral cortex, capturing the development of all cell types throughout mouse corticogenesis. We identify longitudinal molecular dynamics that accompany lineage specification of individual cell types, defining a molecular map that enables mechanistic understanding of aberrant corticogenesis.
Comprehensive atlas of developing cortex
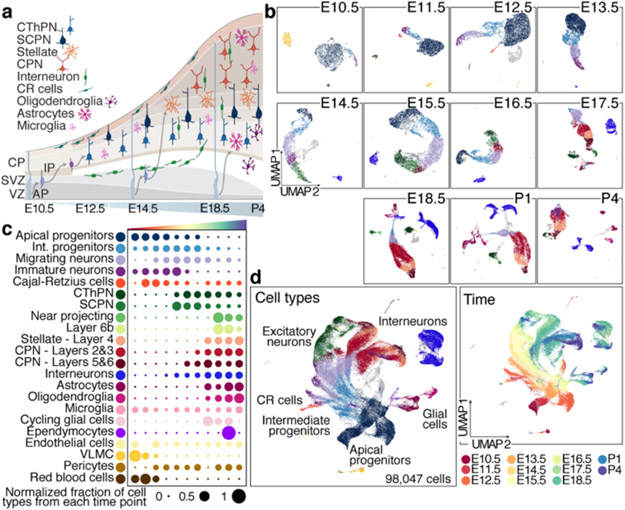
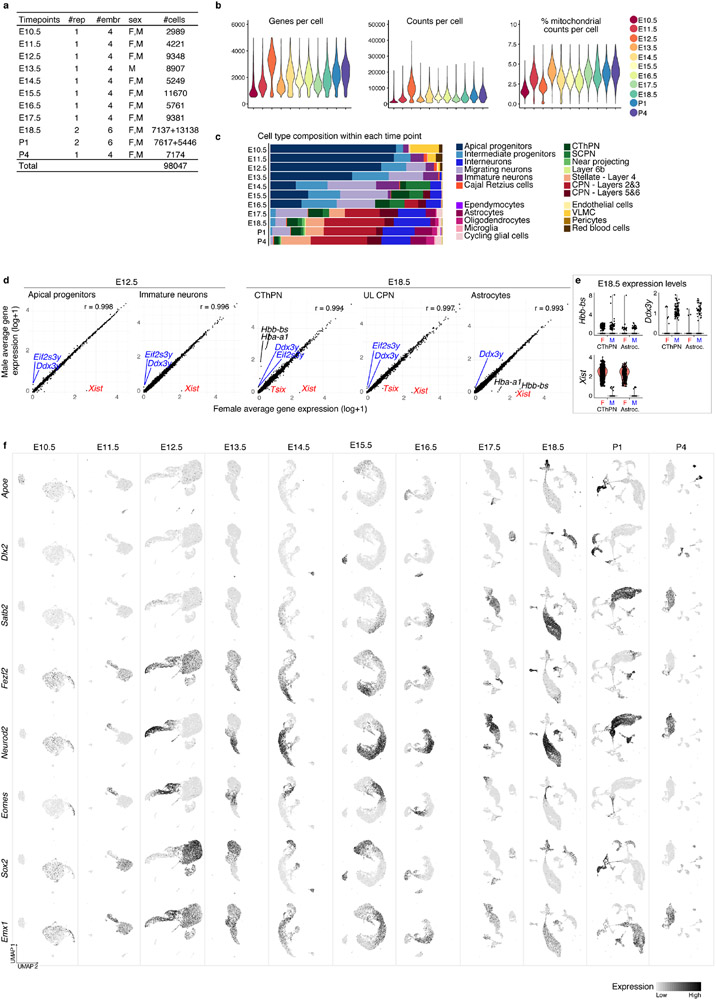
We profiled the mouse prospective somatosensory cortex by single cell RNA-seq (scRNA-seq) over the entire period of corticogenesis: E10.5 and E11.5 (symmetrically dividing neuroepithelial cells), E12.5 and E13.5 (birthdate of layer 6 and 5 excitatory neurons); E14.5 to E17.5 (birthdate of layer 4 and 2/3 excitatory neurons); and E18.5, P1, and P4 (gliogenesis) (Fig. 1a). Overall, we collected 98,047 scRNA-seq profiles, which included all known cell types of the developing cerebral cortex (Fig. 1b and Extended Data Fig. 1a-f, Methods).
Figure 1. Comprehensive atlas of murine cortical development.
a Cellular diversity and development of the neocortex.
b UMAP visualization of scRNA-seq data from Individual time points. Cells are colored by cell type assignement.
c Normalized contribution of each time point to each cell type present in the developing cortex. See also Extended Data Fig. 1.
d Combined time points visualized by age (left), or cell types (right), legend in c.
VZ: ventricular zone, SVZ: subventricular zone, CP: cortical plate, CR: Cajal-Retzius cells, AP: apical progenitors, IP: intermediate progenitors, CThPN: corticothalamic projection neurons, SCPN: subcerebal projection neurons, CPN: callosal projection neurons.
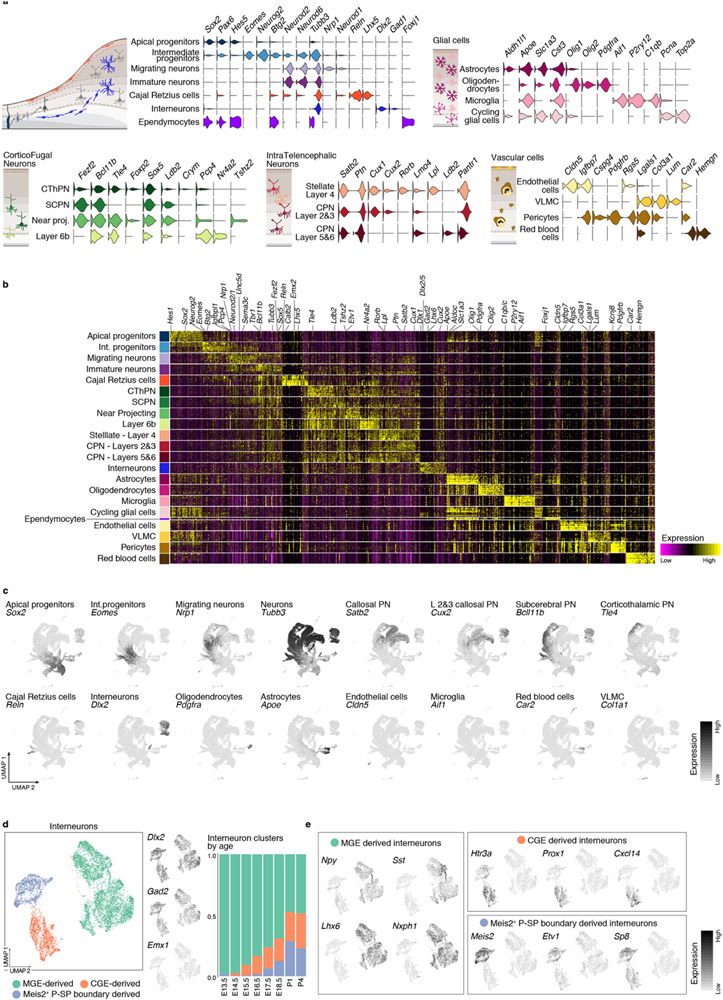
The earliest stages were primarily composed of apical (AP: Sox2, Pax6 and Hes5) and intermediate progenitors (IP: Eomes, Neurog2 and Btg2) (Fig. 1b, Extended Data Fig. 1c, f, and 2a, b). From E12.5, progenitors formed a continuous gradient with projection neurons (PN: Neurod2, Tubb3, Neurod6), including corticofugal (CFuPN) and different callosal projection neurons (CPN), consistent with prior studies3 (Fig. 1b, d, Extended Data Fig. 1c and 2a).
We detected ventrally-generated inhibitory interneurons starting at E13.5 (Dlx2, Gad1, Gad2; Fig. 1b-d, Extended Data Fig. 2a, and d): medial ganglionic eminence (MGE)-derived interneurons (Sst, Npy, Lhx6, Nxph1/2) at E13.5; and caudal ganglionic eminence (CGE)-derived interneurons (Pax6, Sp8, Cxcl14, Htr3a) at E15.5. At E18.5, we detected another population of Htr3a-positive interneurons (Meis2, Etv1, Sp8), putatively derived from the pallial-subpallial boundary4 (Extended Data Fig. 2d, e). This is in line with the sequential birthdate and invasion of the cortex by MGE- and CGE-derived interneurons5.
Oligodendrocyte precursor cells (OPC: Olig1, Olig2, Pdgfra) and astrocytes (Apoe, Aldh1l1, Slc1a3) were first observed at E17.5. We also identified microglia (Aif1, Tmem119), red blood cells (Hb-s, Car2, Hemgn), endothelial cells (Cldn5, Mcam), pericytes (Cspg4, Pdgfrb), and vascular and leptomeningeal cells (VLMC: Col1a1, Vtn, Lgals1) (Fig.1b, d and Extended Data Fig. 2a).
Merging all time points (Methods, Fig. 1c and Extended Data Fig. 2b, c) highlighted the main differentiation continuum from AP towards PN and glial cells. Cells of non-cortical origin were excluded from the main trajectories (interneurons, microglia, vasculature, and meninges). Cajal-Retzius cells were first detected at E11.5, as expected, emerging from Wnt8b-positive medial progenitors6 (Fig. 1c).
Spatial mapping of dynamic cell states
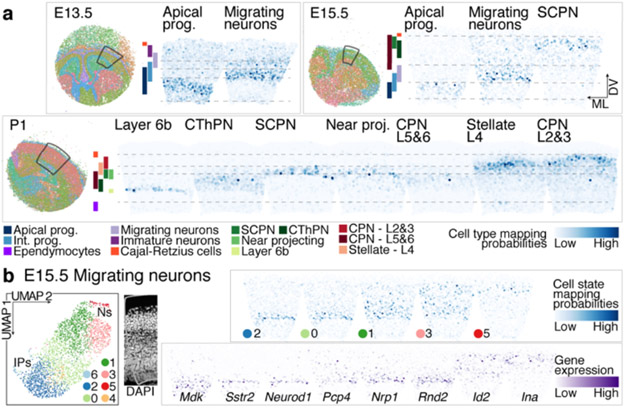
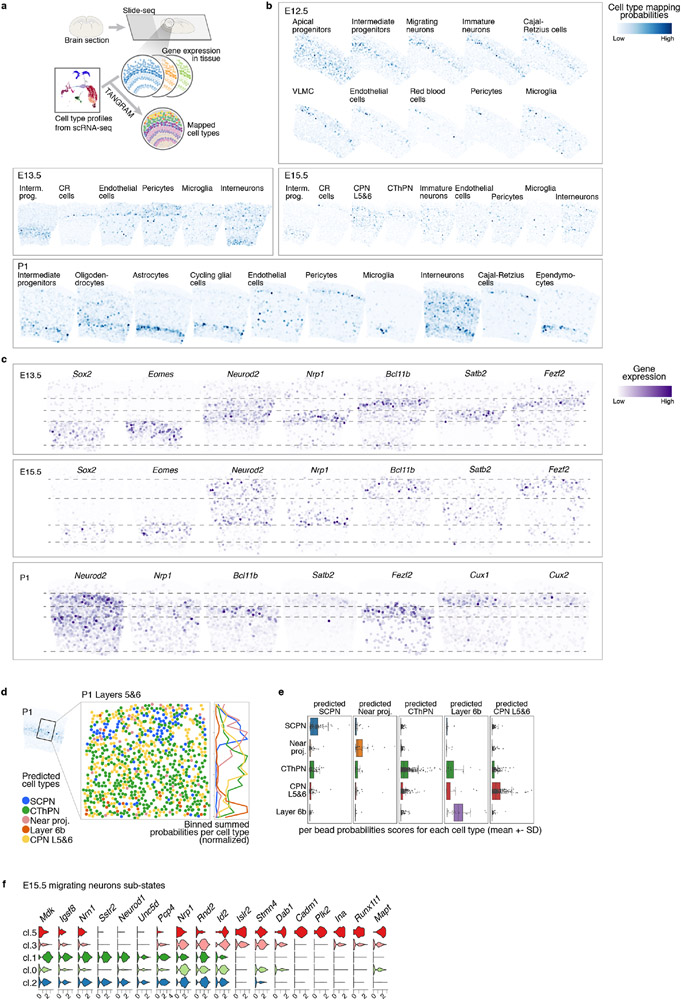
To associate cell identities with their topographic organization, we collected spatial transcriptomes by Slide-seq v27 from coronal brain sections at E12.5, E13.5, E15.5, and P1 (Methods). Cell identities from our scRNA-seq atlas were mapped to their location in age-matched tissue using Tangram8. The learned spatial distribution of each cell type was consistent with their expected positions (Fig. 2a, Extended Data Fig. 3a-c and Supplementary Information Table 1). For instance, our scRNA-seq atlas identified five subtypes of deep-layer neurons: corticothalamic and subcerebral PN (CThPN and SCPN), layer 5&6 CPN, layer 6b, and putative near-projecting Tshz2+ neurons. Tangram mapped each population to specific positions as early as P1, consistent with their locations at later ages9-11 (Extended Data Fig. 3d, e).
Figure 2. Spatial distribution of cell types in the developing cortex.
a Mapping probability of the main cell types from scRNA-seq onto a matching Slide-seq tissue section using Tangram (right). Left: whole puck with beads colored based on clustering. The area used for the mappings is highlighted. Colored bars represent cell type distribution. Dv, dorso-ventral; ml, medio-lateral.
b Re-clustering of sub-states of E15.5 migrating excitatory neurons. Mapping of sub-states onto E15.5 tissue indicates differential positioning across the radial axis of the cortex. DAPI staining of adjacent section for reference. Expression of genes associated with migrating neuron sub-states in E15.5 Slide-seq.
The Slide-seq data also located transient cell states, such as neurons migrating radially through the subventricular and intermediate zone. We re-clustered E15.5 excitatory migrating and immature neurons into five sub-states. Mapping to the Slide-seq data revealed sequential apical-to-distal positions (Fig. 2b and Extended Data Fig. 3f). An unsupervised dimensionality reduction of the single-cell profiles showed the same order (Fig. 2b, left), suggesting a spatio-temporal gradient encoded in gene expression.
Neocortical differentiation trajectories
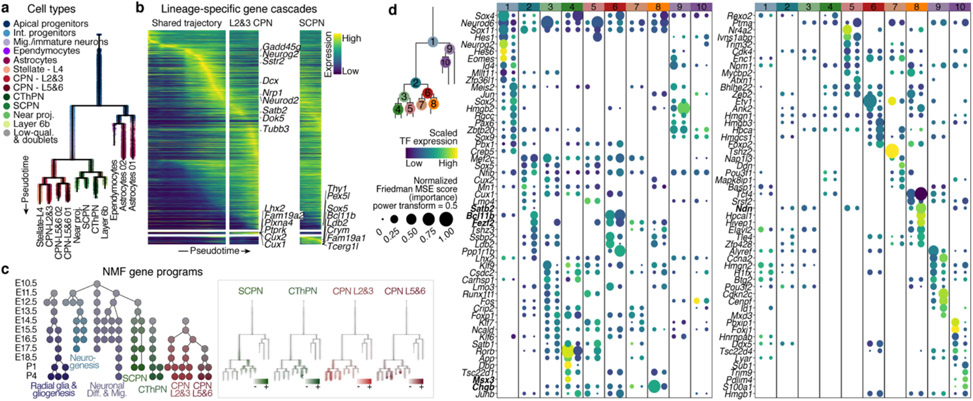
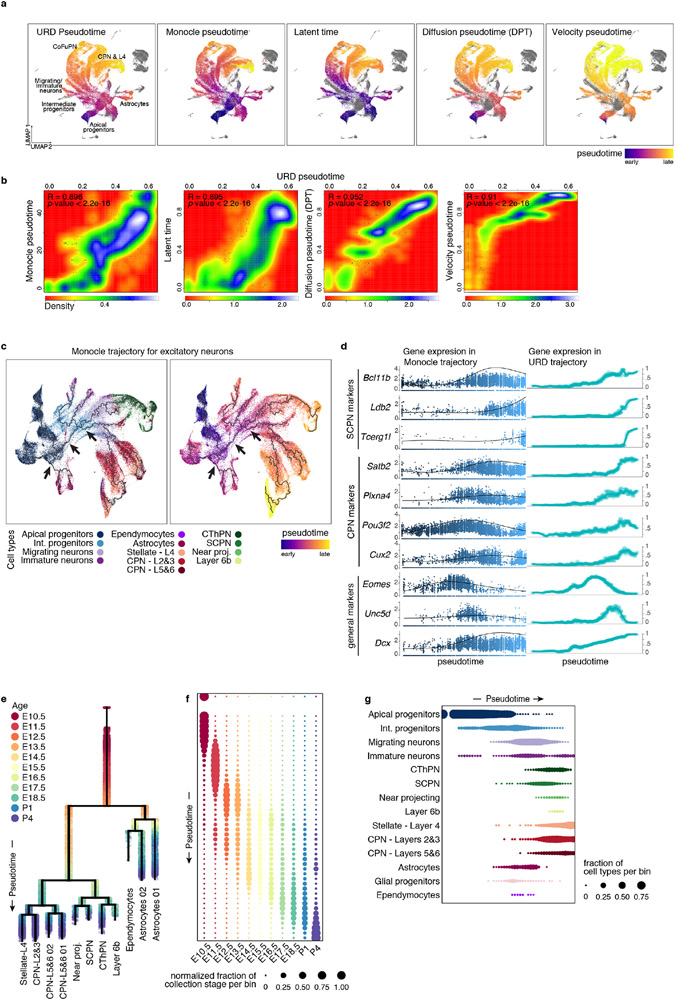
To study the differentiation continuum, we computationally Inferred differentiation trajectories from the scRNA-seq atlas, excluding cells of non-cortical origin. We used a diffusion pseudotime-based approach; alternate algorithms made similar inferences (Extended Data Fig. 4a, b, Methods). We applied URD12 trajectory inference to generate a branched trajectory tree based on the transcriptional similarity of pseudotime-ordered cells (Fig. 3a, Methods).
Figure 3. Molecular developmental trajectories of neocortical cell types.
a URD branching tree. Root is E10.5 earliest progenitors, tips are P4 terminal cell types. Cells colored by their identity.
b Smoothened heatmap of gene cascades for layers 2&3 CPN and SCPN. Gene expression in each row is scaled to maximum observed expression, and smoothened. Genes are ordered based on their onset and peak expression timings. Some marker genes are labeled. The cascade is divided into three segments: shared trajectory, layer 2&3 CPN-specific and SCPN-specific trajectories. Full cascades in Extended Data Fig. 7 and Supplementary Information Table 3.
c Gene programs of connected modules found by NMF. Left: circular nodes represent modules aligned by the age they were computed from. Right: scaled expression of lineage specific modules on the branching tree.
d Genes predicted to be involved in cell type divergence. Top 10 transcription factors per branch, ranked by their feature importance score for ability to distinguish between branches (Friedman MSE score, 0.5 power transformed, dot size), and their average expression in the corresponding cells (row-scaled, color). Color bar at the top indicates branch-points.
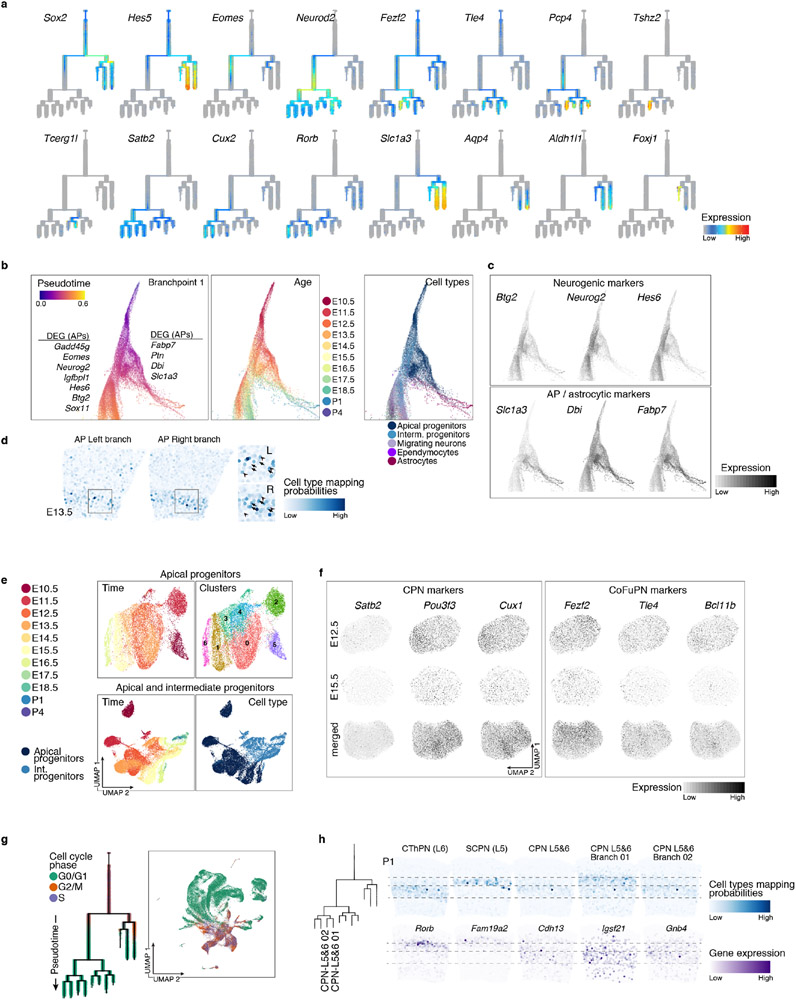
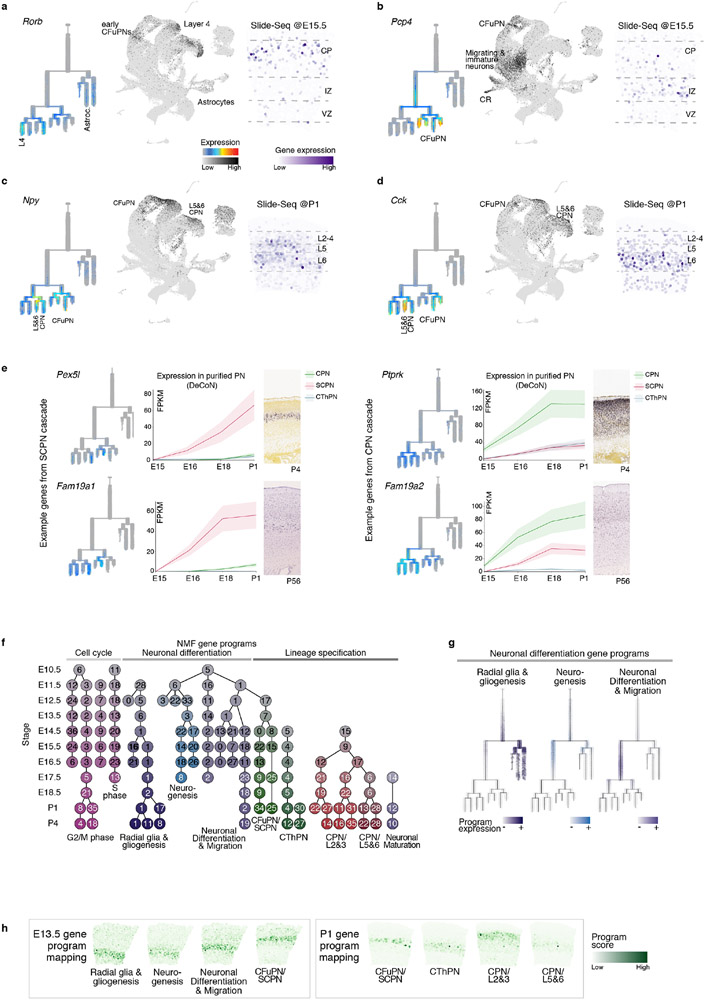
The resulting tree accurately reflected differentiation status, age, and expression of known markers (Fig. 3a, Extended Data Fig. 4e-g and 5a). Monocle3 produced a similar structure, but other trajectory-finding algorithms produced results less consistent with prior biological knowledge (Extended Data Fig. 4c, d). This tree uncovered unappreciated expression patterns of genes traditionally considered lineage-restricted (Extended Data Fig. 6a-d). For example, Pcp4, a marker for CFuPN13, was expressed in migratory neurons of both the CFuPN and CPN lineages, confirmed by Slide-seq. Neuropeptides Npy and Cck, typically found in interneurons, were also detected in PN lineages, validated by Slide-seq. This likely represents transient expression, as only layers 5 and 6 CPN retain Npy in adult mice11.
Notably, the tree showed progenitors diverging as early as E13.5 into glial and neuronal branches (Extended Data Fig. 4e). AP in the neuronal branch were enriched for Btg214, Neurog2, and Hes615, potentially representing a primed neurogenic state, while the glial branch contained “naïve” AP expressing higher levels of radial glia markers (Fabp7, Dbi, Slc1a3) and proliferation-associated genes (Extended Data Fig. 5b, c and Supplementary Information Table 2). Tangram mapping to the E13.5 Slide-seq data (Extended Data Fig. 5d) showed that these states coexist in the early ventricular zone3. In a force-directed layout embedding of the k-nearest neighbors graph, the branch point showed a continuum of cells between these states (Extended Data Fig. 5b). This suggests that the molecular identity of AP gradually becomes more similar to that of astrocytes16, while neurogenic cues still induce neuronal differentiation3.
PN diversify post-mitotically
While recent studies suggest that the transcriptional profile of APs change as they generate PN17, it remains debated whether fate-restricted progenitors exist18-21. In our tree, neuronal populations shared a molecular trajectory originating from one common progenitor branch. Clustering of AP (or AP and IP) from all time points revealed a continuum ordered by age, rather than distinct subtypes (Extended Data Fig. 5e); differentially expressed genes across clusters included a high proportion of housekeeping and proliferation-related genes, rather than PN subtype marker genes. Although they broadly expressed known markers of CFuPN (e.g., Fezf2, Tle4, Bcl11b) and CPN (e.g., Cux1, Pou3f3, Satb2)22, neither AP sub-clustering nor their UMAP embedding followed the expression of these markers (Extended Data Fig. 5f). This argues against strictly pre-committed progenitors. Within these broad expression patterns (including co-expression of Fezf2 and Pou3f3 in the same cells), some markers showed subtle gradients, possibly suggesting skewing towards different fates. Thus, our data suggest that AP continuously and gradually develop while generating distinct PN types3,17.
Our analysis indicated that neuronal diversification occurs post-mitotically. In both the low-dimensionality embedding and the cell-fate tree, neuronal progenies progressively separated at the level of post-mitotic neurons, rather than progenitors (Fig. 1c, 3a and Extended Data Fig. 5g). Monocle3 similarly inferred post-mitotic branching of CPN and CFuPN (Extended Data Fig. 4c, d).
Notably, CPN from layers 5 and 6 were partitioned into two clusters at P4, while the tree separated these lineages starting from P1. Mapping the P1 layer 5 and 6 CPN onto the P1 Slide-Seq data showed that branch 1 and 2 cells preferentially mapped to layer 5 and 6, respectively. Accordingly, at P1, adult layer 5- and layer 6-CPN markers11 were differentially expressed across layers by Slide-seq (Extended Data Fig. 5h). This suggests that CPN from layers 5 and 6 may become molecularly distinct at perinatal stages and continue to diverge postnatally.
Transcriptional programs of corticogenesis
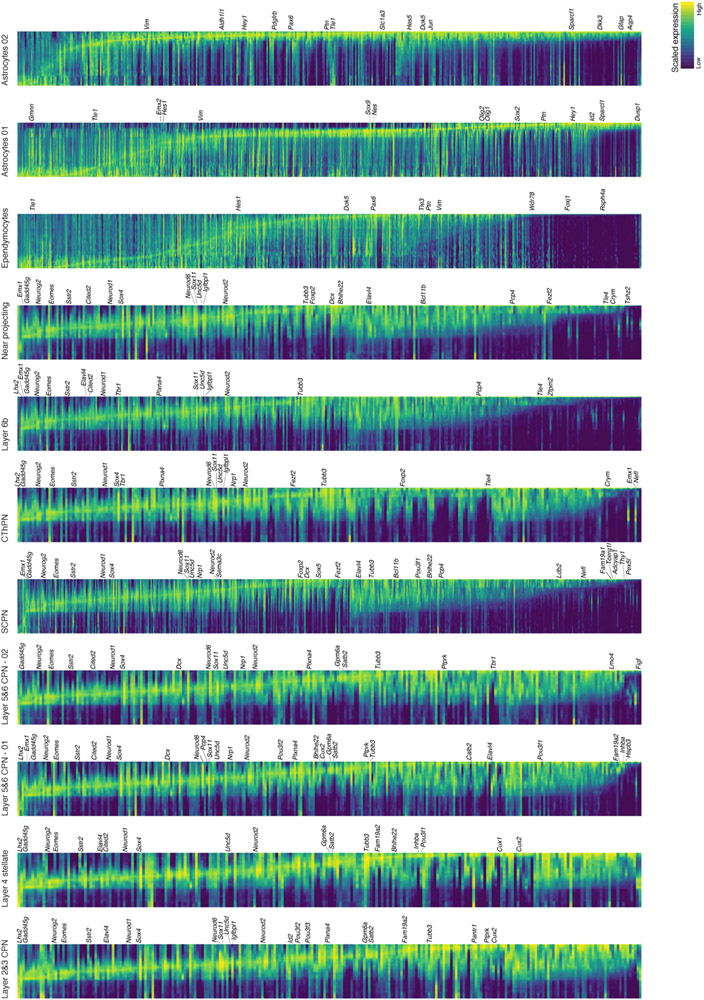
We used our reconstructed tree to map transcriptional changes over the full differentiation trajectory of neuronal and glial classes (Methods). The early shared portion of the neuronal trajectory showed downregulation of cell-cycle-related genes (Gadd45g), transient expression of neurogenesis- (Neurog2) and migration-associated genes (Sstr2, Neurod1), and upregulation of pan-neuronal genes (Neurod2, Tubb3) (Fig. 3b). Later cell type-specific programs included known lineage-specific genes (SCPN: Bcl11b, Sox5, Thy1, Ldb2; layer 2&3 CPN: Cux1, Satb2, Plxna4, Cux2) and novel lineage-restricted genes (SCPN: Pex5l, Fam19a1; CPN: Ptprk, Fam19a2), validated against other databases23,24. Astrocytes downregulated DNA replication genes (e.g., Gmnn), while upregulating astrocytic genes (Slc1a3, Gfap, Sparcl1). Ependymal cells showed upregulation of cilia-related genes (e.g., Foxj1, Wdr78), as well as novel markers like Rsph4a (Supplementary Information Table 3, Extended Data Fig. 6e, and 7).
Complex biological processes, such as diversification, can be more robustly described by the joint activity of gene programs (modules) than by individual genes12,25. Therefore, we identified gene modules across each time point by non-negative matrix factorization (NMF)12, annotated them using their top-ranked genes, and chained modules from consecutive time points12 to define “genetic programs” representing different aspects of corticogenesis (Extended Data Fig. 6f, g and Supplementary Information Table 4, Methods). While some programs were associated with broad developmental processes such as radial glia identity, neurogenesis, and neuronal migration, neuronal lineage-specific programs became distinguishable at E13.5, supporting a shared developmental trajectory that diverges post-mitotically (Fig. 3c). Radial glia modules were connected with astroglia modules, reinforcing that these cell types share highly similar transcriptional programs over time. Both pan-neuronal and lineage-specific programs were detected in the expected cortical layers by Slide-seq (Extended Data Fig. 6h).
Molecular codes of cellular divergence
The reconstructed tree offers an opportunity to Identify genes associated with lineage bifurcations. We examined differential gene expression among the parent and daughter branches at each branch-point, trained a gradient-boosting decision tree to assign an importance score to each gene, and selected the 10 highest-scoring genes for each daughter branch (Methods). For most branch-points, the highest-scoring genes were enriched for DNA binding proteins, but as differentiation progresses, cell adhesion and cytoskeleton-associated proteins became more prominent (Extended Data Fig. 8a, b), reflecting developmental morphological changes.
The top-ranked transcription factors (TFs) and DNA-binding proteins for each daughter branch included both TFs known to govern cell identity acquisition (e.g., Bcl11b, Fezf2, Satb2), and novel candidate regulators, such as Chgb for CThPN, Ndn for layer 6b, and Msx3 for layer 4 neurons (Fig. 3d and Extended Data Fig. 8c). Together, the data provide a first compendium of genes associated with identity divergence, candidates for future functional studies.
Congruence of epigenome and transcriptome
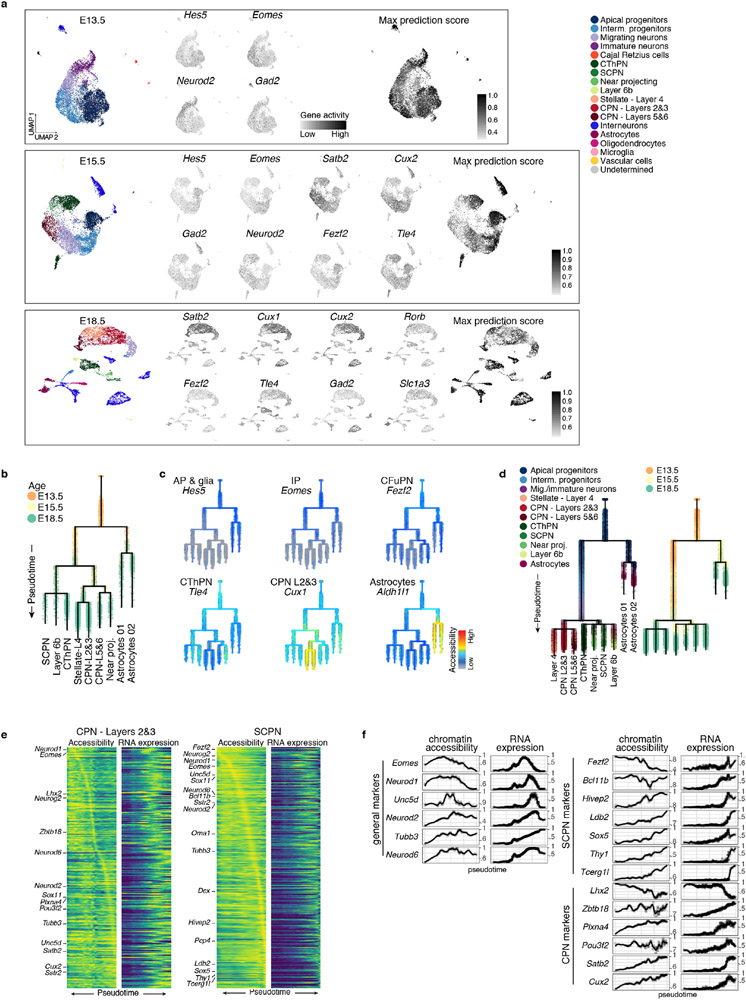
To investigate whether epigenetic regulation showed similar trajectories, we profiled single-cell chromatin accessibility using the assay for transposase-accessible chromatin using sequencing (scATAC-seq) at E13.5, E15.5, and E18.5. Inferred gene activities (summed accessibility from gene body and promoter) identified broad classes of cortical cells (Fig. 4a, Extended Data Fig. 9a), consistent with previous reports26. Co-embedding the scATAC-seq and scRNA-seq data in a shared UMAP space (Methods) closely interleaved both data modalities (Fig. 4a, bottom), indicating that chromatin accessibility captured the full cell-type spectra identified by gene expression.
Figure 4. scATAC-seq landscape of the developing neocortex.
a UMAP visualization of the scATAC-seq data for each time point. Cells are colored by the cell types predicted from integration with scRNA-seq datasets (top), and modality (bottom).
b-c URD chromatin accessibility trajectories. Root is E13.5 progenitors, tips are E18.5 final cell types (with identity-prediction score > 70%). Cells are colored by their predicted identity (b) or accessibility of marker genes (c).
d Transcription factor (TF) motifs enriched along the ATAC tree (e). Dot size shows fold enrichment, and color is average RNA expression in nearest cells in the integrated RNA and ATAC data. Motif enrichment was calculated for sequential segments of the tree, plot separation indicates the second branch-point (top). Only genes with detected expression in the corresponding scRNA-seq cells are shown. Motif enrichment for the tree tips in bottom panel.
e Accessible elements change through time. Dynamic elements that show differential accessibility across cell types were clustered within each time point (indicated with letters, insets show scaled accessibility) and connected through time. 62-85% of the common elements per cluster retained a similar pattern between E13.5 and E18.5. AP: apical progenitors, IP: intermediate progenitors, MN: migrating neurons, IN: immature neurons.
We used the scATAC-seq gene activities to build a developmental trajectory tree of cortical cells (Fig. 4b). In this tree, cells progressed in pseudotime according to both age and differentiation state (Fig. 4b, c and Extended Data Fig. 9b, c), with a comparable structure to a reduced scRNA-seq tree including the same three time points (Extended Data Fig. 9d). Notably, putative near-projecting neurons9,10 were the only population assigned to different branches in the trees (Fig. 4b vs. 3a), suggesting that these neurons may be molecularly related to both CFuPN and deep-layer CPN. Chromatin accessibility preceded gene expression for at least some genes (Extended Data Fig. 9e, f), suggesting epigenetic lineage priming27.
Cis-regulatory cascades of differentiation
To determine how individual cis-regulatory elements (CRE) change throughout corticogenesis, we generated pseudo-bulk samples for each cell type and time point (Methods). The fraction of dynamic elements (i.e., differentially accessible across cell types) increased with age (Extended Data Fig. 10a). We extracted the common CRE across time points, and clustered them at each age, identifying differentiation- and cell type-associated patterns (Fig. 4d, Methods). Many elements were accessible in consistent cell types through time. For example, 76% of the elements from an E13.5 cluster enriched in AP were included at E18.5 in a cluster associated with progenitors, early neurons, and astrocytes. This is consistent with AP constituting a continuum that shares a common molecular identity and gives rise to different classes of PN and astrocytes. Few of the CRE enriched in AP at E13.5 or E15.5 became neuronal-selective at the following timepoint (7% and 8.5%, respectively).
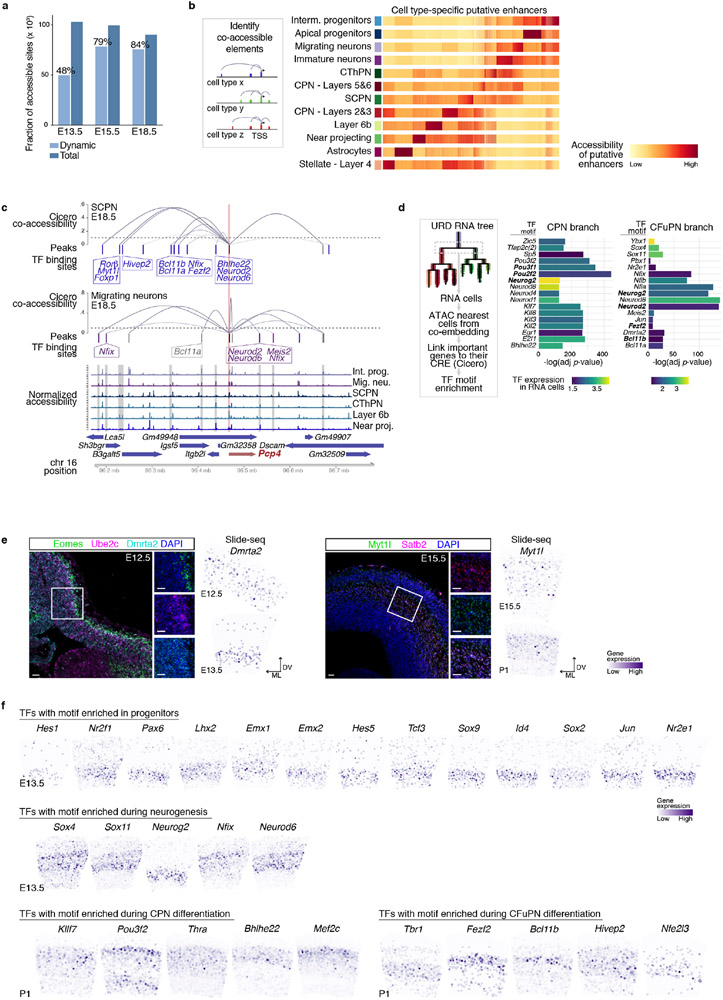
To identify putative distal regulatory elements of cell type-specific genes, we calculated co-accessible sites using Cicero (Extended Data Fig. 10b, Methods). As an example, we examined Pcp4, a marker of CFuPN13 that also ranked highly in the NMF gene program of migrating neurons. Distal elements that were differentially co-accessible with the Pcp4 gene between migrating neurons and CFuPN contained binding sites for TFs associated with neuronal differentiation and migration (Nfix, Neurod2), and the SCPN identity regulators Fezf2 and Bcl11b, respectively (Extended Data Fig. 10c), suggesting possible state-specific enhancers.
Lastly, we sought to identify TFs putatively acting in individual lineages and branch-points. We searched for known TF motifs over-represented in cell type-specific CRE, whose cognate TF was expressed in the corresponding cells in the scRNA-seq data. This identified both known and novel identity regulators at different ages (Fig. 4e). For instance, early segments of the cascade showed enrichment of Dmrta228 motifs in AP-associated enhancers, a TF expressed in murine E12.5 progenitors (Extended Data Fig. 10e). Subtype-specific enrichment emerged at later ages, including motifs for Cux1, Cux2, and Pou3f2 in layers 2&3 CPN29; Bcl11b, Tbr1 and Fezf2 in CFuPN, along with Nfe2l3, Nfia, Hivep2; and Hes5, Sox9, and Klf3 in astrocytes (Fig. 4f and Extended Data Fig. 10f).
We specifically examined the CPN vs. CFuPN branch-point in the RNA tree. The predicted CRE of the top 40 genes by importance score (Fig. 3d, Methods) were enriched for distinct TF binding sites: Fezf2 and Bcl11b for the CFuPN branch, and Pou3f2, Pou3f1 for the CPN branch (Extended Data Fig. 10d). Motifs for TF associated with neurogenesis and neuronal differentiation (e.g., Neurog2, Neurod2), were enriched in both lineages, supporting the idea that fates diverge during acquisition of post-mitotic neuronal identity.
Fezf2 controls CFuPN vs. CPN fate
We tested the utility of our developmental molecular atlas to elucidate phenotypic changes in loss-of-function models that affect corticogenesis. We chose Fezf2 mutants because absence of this gene causes a complete loss of SCPN30-33. The mechanisms behind SCPN loss, and the identity of the neurons produced in their place, remain poorly understood.
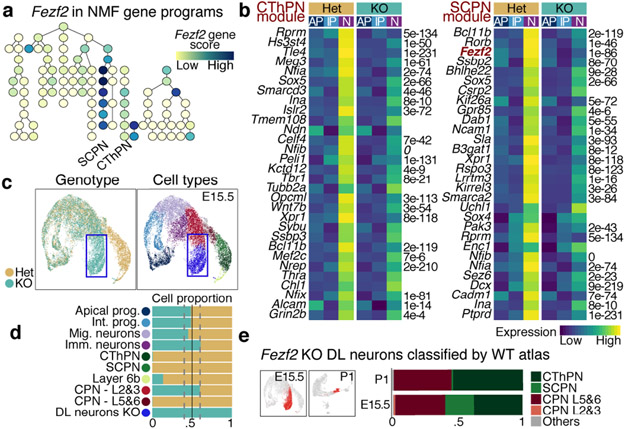
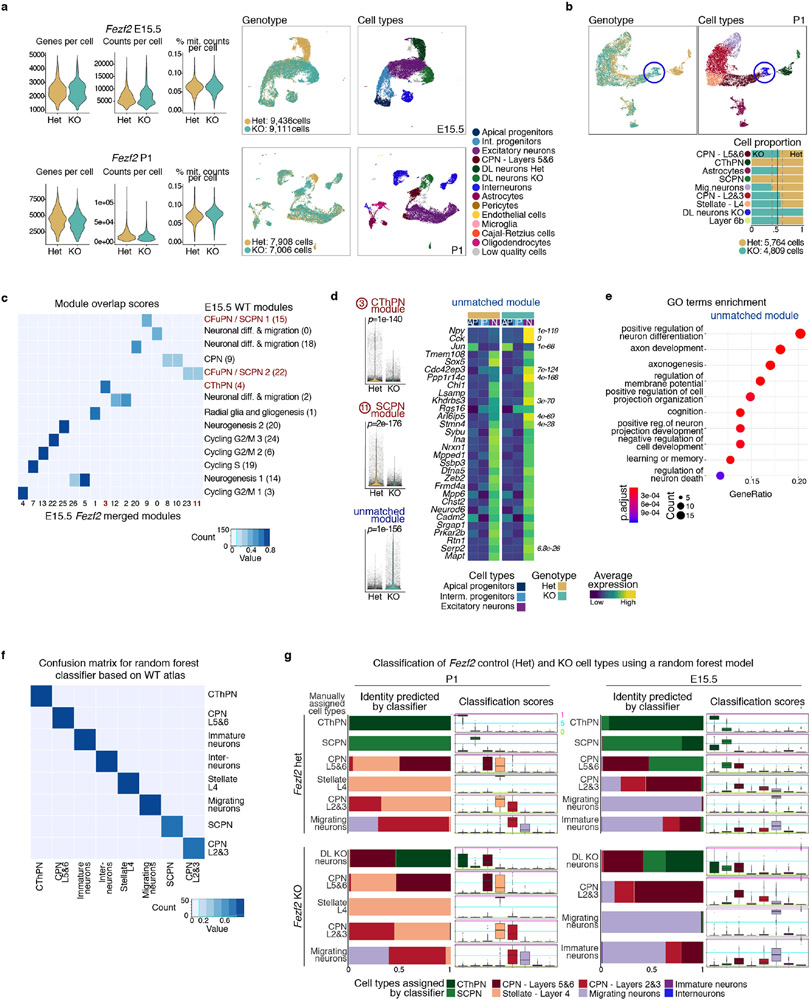
We profiled 17,344 control (Het - heterozygous) and 16,117 knock-out (KO) cells by scRNA-seq from E15.5 and P1 developing cortex of Fezf2 mutant mice34 (Extended Data Fig. 11a). We applied NMF gene module analysis to identify differences between genotypes in an unsupervised manner (Extended Data Fig. 11c, Methods). All of the modules in the original E15.5 wild-type (WT) analysis were present in the Fezf2 dataset. Modules corresponding to SCPN and CThPN specification, in which Fezf2 was a top-ranked gene (Fig. 5a), were specifically downregulated in KO cells, as were ~70% of the 100 top-ranked genes in these modules (Fig. 5b and Extended Data Fig. 11d). The only significantly upregulated module in the Fezf2 KO did not match any E15.5 WT module. This KO-specific module was enriched for axon development and guidance genes (Extended Data Fig. 11e), consistent with the mutant cells’ aberrant axonal projections33.
Figure 5. Fezf2 prevents acquisition of callosal identity in CFuPN.
a Gene programs of connected modules (as in Fig. 3c), colored by Fezf2 score.
b Expression of affected modules in Fezf2 KO E15.5 cortex. Average expression of the top 30 genes of the SCPN and CThPN modules, in AP, IP and excitatory neurons (N), by genotype. Differential expression between control (Het) and KO neurons (two-sided Wilcoxon Rank Sum test, Bonferroni correction).
c-d UMAP visualization of scRNA-seq from E15.5 control and KO cortices, by genotype (left) and cell type (right). Proportion of cell types by genotype (bottom).
e A classifier trained on the wild-type atlas, mostly assigned KO-specific clusters (red in UMAP insets) to CThPN and layer 5&6 CPN.
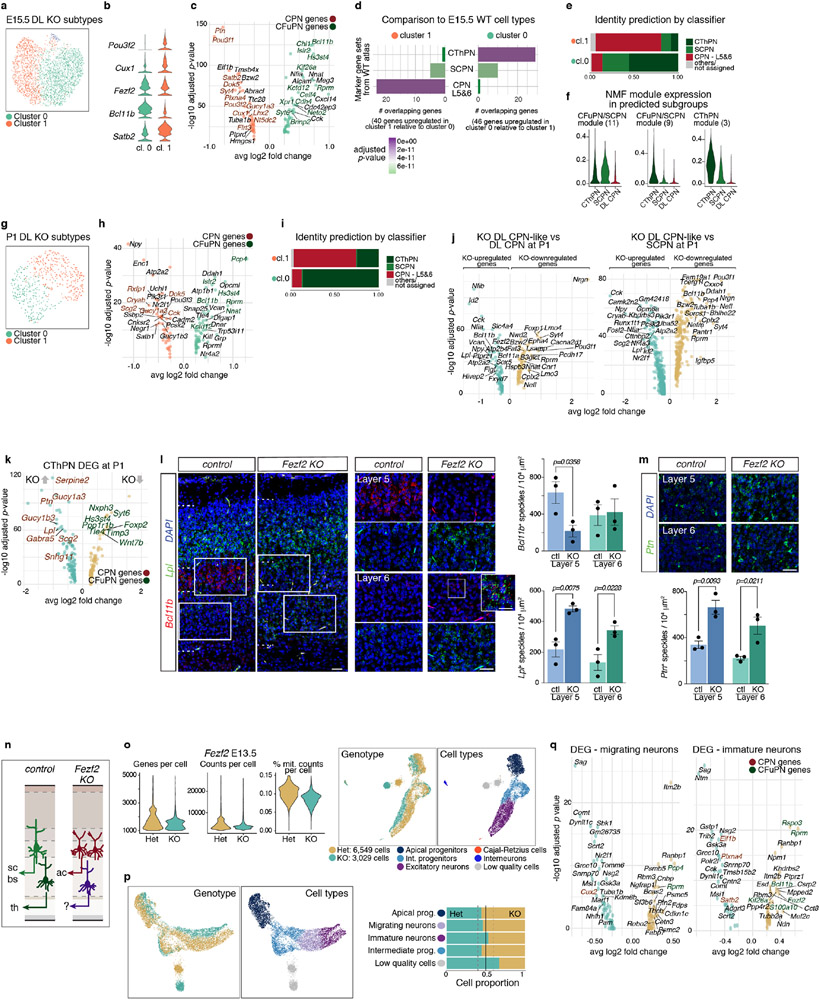
In the Fezf2 KO, the deep-layer neurons SCPN and CThPN are replaced by a KO-specific population (Fig. 5c, d and Extended Data Fig. 11b). To define the closest identity of these cells, we applied a multi-class Random Forest classifier trained on the WT cell types (Extended Data Fig. 11f). Most of the KO cells were assigned to CThPN or layer 5&6 CPN (Fig. 5e and Extended Data Fig. 11g). While 22% of the KO-specific cells were classified as SCPN at E15.5, only 1% were at P1, suggesting that a subset of cells transiently express a rudimentary CFuPN/SCPN program independent of Fezf2 (Extended Data Fig. 12f). The KO-specific CThPN-like cells had elevated expression of CPN genes (Extended Data Fig. 12k-m). The KO-specific CPN-like cells substantially diverged from both control deep-layer CPN and SCPN (Extended Data Fig. 12j). Sub-clustering the KO-specific deep-layer neurons alone identified two subpopulations, matching the assignments made by the classifier (Extended Data Fig. 12a-i).
Our analysis shows that loss of Fezf2 upregulates CPN genes in CThPN, and results in the replacement of SCPN with cells resembling, but distinct from, layer 5&6 CPN (Extended Data Fig. 12n). This suggests that Fezf2 suppresses CPN gene programs in developing CFuPN. The aberrant populations do not represent cells stalled at immature stages, but rather an identity that differs from endogenous cell types.
Lastly, profiling of E13.5 control and Fezf2 KO cortex did not show major differences in cell type composition. Only post-mitotic neurons presented transcriptional differences, with a phenotype similar to the later time points (Extended Data Fig. 12o-q). Thus, although Fezf2 is expressed in progenitors (Extended Data Fig. 5f)19, its role in SCPN specification appears to be primarily post-mitotic. This supports our finding that neuronal subtype identity becomes restricted post-mitotically.
Extensive studies over the last three decades have identified some of the key genes that control the development of some of the main neuronal populations of the neocortex1,2. However, the mechanistic principles by which the cerebral cortex generates its cellular diversity have remained elusive, because of the need to integrate all of its cell types3,17,35, across all developmental stages, within a single framework. This work provides a comprehensive collection of all the molecular states of each cortical lineage through time, and begins to identify candidate molecular effectors and regulatory elements underlying fate divergence. This type of data informs approaches for functional interrogation of candidate genes using scalable genetic assays, such as Perturb-seq25, and inspires the extension of this approach to interrogate broader regions of the mammalian brain.
METHODS
Animals
All animal experiments were conducted according to protocols approved by the Institutional Animal Care and Use Committee (IACUC) of Harvard University. We used wild-type C57Bl/6 mice (Charles River Laboratories) and the Fezf2-BGal mouse line34. Animals were housed in groups in standardized cages with a 12:12 h light:dark cycle with unrestricted access to food and water, 30-70% humidity and a temperature of 22°C±1. Fezf2 mice were genotyped by PCR using the following primers: mutant allele forward primer GGGTGTTGGGTCGTTTGTTCGGATCTGCTA, mutant allele reverse primer TCTGGGCGCTCACGGTGACAGGCTGGGATT, wild-type allele forward primer GGGTTAATGGGCGGTAATTT, wild-type allele reverse primer GCCACAGTTGGTTTTGCAC. Sex of Fezf2 embryos was not distinguished.
Tissue dissection
We set harem breeding cages and defined morning of plug detection as E0.5. On the desired day, we euthanized the pregnant females and obtained the embryos. Brain dissection was performed in Hybernate E (Brainbits). The tissue was then embedded in 3% low melting agarose at 35-37°C. Once the agarose solidified, the tissue was sectioned at 250 μm on a vibrating microtome in iced Hybernate E. Sections were transferred to a new plate and the prospective somatosensory cortex was dissected and meninges removed. For the earliest time points (E10.5, E11.5 and E12.5), the prospective somatosensory cortex (medio-lateral region) was dissected without prior sectioning. Tissue was kept in cold buffers and on ice at all times. RNAse-free technique was used for handling. Cortical tissue from 4 animals was pooled together for each time point.
For the Fezf2 experiments, samples were dissected from the cortex without sectioning and processed individually until after genotype confirmation, when samples from embryos with the same genotype were pooled. We genotyped embryos using PCR and qPCR on DNA extracted from tail clips (QuickExtract DNA Extraction Solution, Lucigen), and through B-galactosidase detection assays. For Slide-seq experiments, the tissue was immediately frozen in a dry ice ethanol bath after collection in OCT.
Cell isolation
For scRNA-seq, tissue pieces were processed to obtain a single-cell suspension using papain digestion (15-30 minutes according to embryo age) (Papain dissociation kit, Worthington), following the manufacturer’s protocol. After dissociation and concentration, cells were resuspended in BSA 0.04% in PBS, at a concentration of 800-1,200 cells/μl. Cells were counted in a hemocytometer chamber and immediately processed for single-cell GEM formation (10x Genomics, single cell RNA sequencing 3’, Chromium v2 for the developmental time course, or v3 for Fezf2 experiments).
Nuclei isolation
For scATAC-seq, tissue pieces were transferred to NbActiv1 (BrainBits) immediately after dissection, and nuclei were isolated following a protocol from 10x Genomics36. Briefly, tissue was dissociated with a 1 ml pipette, then centrifuged at 500 rcf at 4°C for 5 min and resuspended in 1 ml NbActiv1. Concentration was determined using a hemocytometer chamber. Cells were centrifuged at 500 rcf for 5min at 4°C and resuspended in 100 μl chilled diluted Lysis Buffer (Tris-HCl pH 7.4 1mM, NaCl 1mM, MgCl2 0.3mM, Tween-20 0.01%, Nonidet P40 Substitute 0.01%, Digitonin 0.001%, BSA 0.1%) and incubated for 5 min at 4°C. We then added 1 ml chilled Wash Buffer (Tris-HCl pH 7.4 10mM, NaCl 10mM, MgCl2 3mM, BSA 1%, Tween-20 0.1%) to the lysed cells and pipette mixed 5 times. Finally, we centrifuged at 500 rcf for 5 min at 4°C and resuspended in chilled 1:10 diluted Nuclei Buffer (10x Genomics) to a final concentration of 6000 nuclei/μl (based on previous concentration and assuming a loss of 50%). Final nuclei concentration was determined by hemocytometer before proceeding with the Chromium Single Cell ATAC assay.
scRNA-seq and scATAC-seq
For scRNA-seq, we loaded the 10x Genomics chips aiming to recover 7,000–10,000 cells. cDNA amplification and library construction were done following 10x Genomics protocols. For the complete wild-type developmental atlas, we generated Chromium v2 libraries, while Chromium v3 was used for all of the Fezf2 experiments. Libraries were quantified in BioAnalyzer and sequenced on an Illumina HiSeq or NovaSeq. Samples were sequenced to a depth of 40,000-70,000 reads per cell.
For scATAC-seq experiments, we loaded the chips aiming to recover 7,000 nuclei and proceeded according to the manufacturer’s protocols. Libraries were quantified using a BioAnalyzer and sequenced on an Illumina NextSeq.
scRNA-seq pre-processing, initial analysis and clustering
Raw sequencing data (bcl files) was first processed using the Cell Ranger pipeline (v.2.0.1, 10x Genomics), using mouse genome GRCm38.p4, cellranger reference 1.2.0, and ensembl v84 gene annotation (http://ftp.ensembl.org/pub/release-84/fasta/mus_musculus/). We used default parameters to align reads, count UMI, and filter high-quality cells in order to generate gene-by-cell count matrices. We assessed the individual time points for the extent of ambient RNA contamination using CellBender 0.2.0 (remove-background, default parameters37). As the count data before and after correction showed only minor differences (not shown) we proceeded with downstream analysis without any ambient RNA correction.
For the developmental wild-type time course, we used Seurat V3.2.2 to generate the sparse count matrix, as well as downstream analysis38. The percentage of counts originating from mitochondrial RNA per cell was calculated first. Cells were then filtered to retain only higher-quality cells (%mitochondrial reads < 7.5%, genes detected > 500). We checked Xist expression to assess sex representation, and all samples had both male and female individuals with the exception of E13.5, which only contained male individuals. Average gene expression per cell type was highly correlated among female (Xist+) and male (Xist−) cells (Extended Data Fig. 1d-e). As we did not find sex-based differences in the data at any time point and cells from both male and female embryos were equally intermixed in all clusters, we retained the E13.5 dataset. Standard processing for each time point consisted of normalization of the feature expression measurements for each cell by the total expression, multiplying this by a scale factor (10,000), and log+1-transformation of the result. This was followed by assignment of cell cycle scores to individual cells based on the expression of G2/M and S phase markers39. We next scaled expression values and identified the 3,000 most variable genes with FindVariableFeatures (selection.method="vst", nfeatures=3000). In the scaling step we regressed out the following variables: percentage of mitochondrial counts, number of counts and genes, and the difference between the G2M and S phase scores (vars.to.regress= c("nCount_RNA", "nFeature_RNA", "percent.mito", "CC.Difference"), do.center=TRUE, do.scale=TRUE). We performed PCA linear dimensionality reduction on the scaled data and clustered the cells with a graph-based clustering approach (RunPCA). We retained 50 PCs for the merged object and 10-15 for the individual objects, and constructed a k-nearest neighbors graph based on the Euclidean distance in PCA space, and then refined the edge weights between any two cells based on the shared overlap in their local neighborhoods (FindNeighbors, dims = 1:50). We then clustered the cells using the Louvain algorithm40 (within Seurat) to iteratively group cells together, while optimizing the standard modularity function (FindClusters, algorithm=1, method=”matrix”). Resolution for this step was set at 0.5 or 1 in order to get coarse and fine clusters, respectively. As an additional processing measure, we performed doublet prediction on the clustered data using Doublet Finder v241 (PCs=1:30; pN=0.25; pK=0.01) and Scrublet v0.142 (expected_doublet_rate=0.06; min_counts=2; min_cells=3; min_gene_variability_pctl=85, n_prin_comps=30). To annotate clusters, we determined differentially-expressed genes using FindAllMarkers from Seurat (Wilcoxon Rank Sum test with Bonferroni correction for multiple testing; adjusted P<0.05). We only tested genes that were detected in a minimum of 25% of the cells within the cluster and that showed, on average, at least a 0.25-fold difference (log-scale) between the cells in the cluster and all remaining cells. By reviewing the resulting markers as well as the expression of canonical marker genes (Extended Data Fig. 1 and 2), we assigned a cell type Identity to 85% to 98% of cells at each time point. The remaining cells had either poor-quality transcriptomes (as indicated by lower number of detected genes), were presumed doublets (as predicted by the overlapping assignment/intersection of both Scrublet and Doublet Finder), or remained unclassified. In order to combine the scRNA-seq data from all wild-type time points, we merged the individual Seurat objects and removed from the set of highly variable genes, transcripts encoding mitochondrial and ribosomal proteins, hemoglobins (likely ambient RNA), and Xist (highly expressed). The removed genes amounted to ~1% of variable genes (<30 out of 3,000).
For the Fezf2 KO and control experiments, cells were merged using the merge function; no data integration or batch correction was used.
Slide-seq
Slide-seq v2 was performed on 10μm thick cryostat sections of E12.5, E13.5, E15.5, and P1 brain sections as detailed in Stickels et al.7. Three sections were taken per time point: a medial section corresponding to the putative somatosensory cortex, a rostral section, and a caudal section. Briefly, pucks covered with barcoded beads were sequenced using a sequencing-by-ligation approach and imaged under a confocal microscope. Images were processed and base-called to generate a sequence string for the barcode in each bead. Tissue was sectioned on a cryostat to a thickness of 10 μm. One coronal brain section was positioned onto the puck, and the tissue was then melted by moving the puck off the cryostat stage. An adjacent section collected on a standard microscopy slide was counterstained with DAPI for reference. The puck was then placed into a 1.5 ml tube. For library preparation, RNA hybridization was performed at room temperature to allow RNA binding to oligos on the beads. Subsequently, first-strand synthesis was performed. Tissue was digested and library preparation proceeded with the synthesis of cDNA second strand, library amplification, cleanup, and Nextera tagmentation, as indicated in Stickels et al.7. Samples were cleaned with AMPURE XP (Beckman Coulter A63880) beads, according to the manufacturer’s instructions, and resuspended in 10 μl of water. Library quantification was performed using a Bioanalyzer. Samples were sequenced on an Illumina NovaSeq flowcell. The puck received approximately 200-400 million reads, corresponding to 3,000-5,000 reads per bead. Raw sequencing data was processed as indicated in Stickels et al.7. The Slide-seq tools (https://github.com/MacoskoLab/slideseq-tools) software was used to collect, demultiplex, and sort reads across barcodes. High-quality reads were trimmed and aligned to the reference genome using STAR 2.5.2a43. The data produced was sequenced to a depth of 712±40 features and 1194±116 UMIs per bead (mean±SD). Top cells were selected by the number of transcripts.
Mapping cell types from scRNA-seq onto Slide-seq with Tangram
We used the Tangram method8, to integrate scRNA-seq data with spatial Slide-seq v2 data. We used as input the scRNA-seq and spatial datasets collected from the same tissue type, and a subset of genes shared by the two datasets (training genes). Tangram searches for a spatial alignment of single cell profiles, so that the training gene expression of the mapped cell profiles is as close as possible to that of spatial data. The output of Tangram is a matrix M with dimensions ncells × nbeads, where ncells is the number of single cells in scRNA-seq data and nbeads is the number of spatial voxels in the spatial data. The matrix entry Mij ≥ 0 gives the probability of cell i to be mapped in voxel j. After aligning the scRNA-seq data onto space, Tangram transfers annotations, such as cell types or program usage, from the scRNA-seq data onto space.
Specifically, the pre-processed scRNA-seq data from each individual time point were mapped into the region of interest (ROI, selected as the lateral segmet of the cortex consistent with what was used for scRNA-seq) of the corresponding Slide-seq data collected at the same time point. Prior to mapping, we discarded spatial spots with less than 5 counts and single-cell profiles labeled as “low quality” (as defined above). As training genes, we used a subset of marker genes (computed from the scRNA-seq data), which were shared by both datasets, leading to a total of 458 genes (Supplementary Information Table 1). We then mapped by maximizing the standard Tangram score, which we trained for 2,000 epochs using a learning rate of 0.1. At the end of training, Tangram scores converged to values between 0.75 and 0.8, consistently across time points. Using these mappings, cell type annotations were transferred onto space, which we used to produce Fig. 2 and Extended Data Fig. 5. The same mappings were also used to transfer progenitor sub-states at E13.5 (Extended Data Fig. 7f), layer 5&6 CPN at P1 (Extended Data Fig. 8e), and gene programs (NMF modules) (Fig. 3d).
For Fig. 2c, at time point P1, we focused on a small ROI, which captures layers 5 and 6 cellular diversity, including SCPN, CThPN, CPN and near-projecting and layer 6b neurons. Then, we assigned a cell type to each spatial voxel, by selecting the cell type with highest probability. To verify that this deterministic assignment led to a unique choice, we computed the mean and the standard deviation of the probability scores of each cell type, separating the voxels according to the assigned identity (Extended Data Fig. 5c), and confirmed that for spots assigned to a given cell type, the probability of that cell type is significantly higher than other types. To assess the radial (laminar) distribution of cell types, we divided the area of the cortex into horizontal bins (i.e., perpendicular to the radial axis of the cortex), aggregated (summed) the probability of the mapped cells for each cell type in each bin, and plotted the normalized summed probabilities.
Inference of developmental trajectories
To reconstruct branching trajectory trees (from either scRNA-seq or scATAC-seq), we used URD12 (v1.1.0). First, we calculated a diffusion map using Destiny v2.14.044 implemented in the calcDM function from URD with knn=200 and sigma.use=10. As the root, we assigned a subset of apical progenitors at E10.5 for the full RNA tree, and at E13.5 for the ATAC and reduced RNA trees. Cells were then ordered in pseudotime by simulating diffusion from the root to calculate the distance of each cell from the root. For this, we used the floodPseudotime function with n=10 (number of simulations) and minimum.cells.flooded=2. In total, 200 simulations were performed. Post-mitotic neurons, astrocytes and ependymocytes at P4 were defined as tips for the RNA full tree, and E18.5 neurons and astrocytes were used as tips for the ATAC and reduced RNA trees. After excluding cells not derived from the dorsal neuroepithelium (Cajal-Retzius cells, oligodendrocytes, microglia, interneurons, endothelial cells, VLMC, pericytes, and red blood cells) and medial forebrain progenitors from the earliest time points expressing Wnt8b, Rspo1, and Zic1 that do not contribute to the somatosensory cortex, 79,108 cells were used for the complete RNA tree, 34,915 cells for the reduced RNA tree, and 23,557 cells for the ATAC tree. To apply URD12, we used pseudotimeWeightTransitionMatrix with parameters optimal.cells.forward=40 and max.cells.back=80 to determine the slope and inflection point of the logistic function used to bias the transition probabilities. We simulated random walks on the cell-cell graph from each tip to the root using connections in the biased transition matrix and processRandomWalks function from URD. In total, 350,000 random walks were performed per tip for the RNA full tree, and 200,000 random walks for the ATAC and reduced RNA trees. Finally, trees were built using buildTree function. Briefly, this function starts from each tip and joins trajectories that visited the same cells. It compares all predefined tips in a pair-wise manner. Cells visited by either tip are divided by a moving window through pseudotime. Next, we used “preference” test to assess whether the cells in each window were visited significantly differently by walks from the two tips. A putative branchpoint is determined when the test becomes significant. After comparing all tips, the latest branchpoint is chosen, and the two segments are combined upstream of the branchpoint into a new segment. This process is repeated iteratively until one trajectory remains and the dendrogram layouts are generated. We used the following parameters:
Full RNA-tree:
visit.threshold=0.7, minimum.visits=2, bins.per.pseudotime.window=8, cells.per.pseudotime.bin=80, divergence.method="preference", p.thresh=0.01
Reduced RNA-tree:
visit.threshold=0.9, bins.per.pseudotime.window=5, minimum.visits=1, cells.per.pseudotime.bin=50, divergence.method="preference", p.thresh=0.001
ATAC-tree:
visit.threshold=0.9, minimum.visits=1, bins.per.pseudotime.window= 8, cells.per.pseudotime.bin=50, divergence.method= "preference", p.thresh= 0.001
Force-directed layout embedding
Force-directed layout was constructed using treeForceDirectedLayout from the URD package. Briefly, a weighted k-nearest neighbor network was generated based on Euclidean distance in visitation space using the visitation frequency of each cell by biased random walks from different tips, and used it as input into a force-directed layout (powered by igraph). The following parameters were used to construct the layout: num.nn=80, method="fr".
Other pseudotime determinations
Several alternative methods were also tested for pseudotime calculations. Kallisto 0.46.1 and bustool 0.39.4 were used to obtain spliced and unspliced transcripts with mouse Ensembl annotation version 96. Scanpy 1.6.0 and scVelo 0.2.245 were used to process the Kallisto output with default parameters, based on UMAP coordinates obtained from Seurat. Diffusion pseudotime (DPT)46 and velocity pseudotime values were calculated using scvelo.tl.dpt and scvelo.tl.velocity_pseudotime with the same root cells we previously defined for building the trajectory using URD. Latent time was computed using the same root_cells as prior. 8,313 cells were excluded from velocity analysis due to filtering of cells with less than 500 spliced or unspliced features.
Monocle3 v0.2.147 was used to calculate pseudotime values and as an alternative method to infer trajectories. Cells were clustered using the cluster_cell function with default parameters based on the UMAP coordinates calculated with Seurat on the selected cells (see above). Monocle3 trajectory was built using learn_graph function with use_partition=FALSE to learn a single graph across all partitions. Next, pseudotime values were calculated using order_cell function with the same root cells we previously defined for building the trajectory using URD.
Gene-expression cascades and branch point-associated genes
To identify marker genes for each trajectory, we used the aucprTestAlongTree function in the URD package to work backward from the tip along the trajectory, making pairwise comparisons between the cells in each segment and the cells from each of that segment’s sibling and children (segments with equivalent or higher pseudotime values). Genes were considered as differentially expressed if they were expressed in at least 10% of the cells within the trajectory segment under consideration (frac.must.express=0.1), their minimum mean expression level was 1.5× higher compared to the sibling segment, and were 1.25× better classifiers than a random classifier for the population, determined by Area Under a Precision-Recall Curve (markersAUCPR). A gene was considered as member of the population’s cascade if, at any given branch point, it was differentially expressed against > 60% of the population’s siblings (must.beat.sibs=0.6), and was not upregulated in a different trajectory downstream of the branch point.
To determine the ‘on and off’ timing of expression, we used using geneSmoothFit from URD which takes a group of genes and cells, averages gene expression (using a moving window through pseudotime, moving.window=5, cells.per.window=25), and then uses smoothing algorithms (spline fitting) to describe the expression of each gene. Genes were then ordered by the pseudotime value at which they enter and then leave “peak” expression (expression 50% higher than minimum value), and start and then leave “expression” (expression 20% higher than minimum value), in that order.
In order to define branch point-associated genes, we selected cells adjacent to the branch points (0.04 pseudotime units before and after) and calculated differentially-expressed genes between parent and sibling branches (Seurat FindMarkers, min.pct=0.1, logfc=0.2, Wilcoxon rank sum test).
For each segment, we also used a multivariate linear regression model. To filter var.genes determined previously by FindVariableFeatures from Seurat, we first performed Lasso regression using cv.glmnet from the R package glmnet 3.0-2 to obtain a suitable lambda value, and then glmnet (family=”gaussian”, type.measure = "mse", nfolds = 10) to identify genes that are positively or negatively associated with pseudotime. To find the top distinguishing features/genes between cells in sibling and parent branches at a given branch point in the development trajectory, a Gradient Boosting Classifier was trained (using scikit-learn 0.23.1, https://scikit-learn.org/stable/modules/generated/sklearn.ensemble.GradientBoostingClassifier.html) to distinguish one class (branch) from the rest (other branch and parent), with the union of genes from the differential expression and regression analyses for each branch point as input, and then asked which features (genes) were more informative to the classifier for discriminating each class from the rest. A grid search was performed to optimize depth (3, 4, 5 trees) and number of estimators (25, 50, 75, 100), and the best depth (max_depth=4) and number of estimators (n_estimators=100) were picked to train with 10-fold cross-validation. Feature importance score was calculated based on maximal estimated improvement by splitting on the feature under consideration against not-splitting (measured in terms of squared error or MSE), using the default option in sklearn, “friedman_mse”. The expected amount of improvement is summed over all internal nodes (where splitting occurs) of a single tree, and then summed over all trees in the gradient boosted tree model to get a single number per gene.
We selected the top 20 genes (Extended Data Fig. 13a) or TFs (Fig. 3e) by importance scores per branching point. For these, we plotted their scaled expression across branch points and their Friedman MSE score (power transform 0.5). TFs were defined from the cis-bs (http://cisbp.ccbr.utoronto.ca) and JASPAR2018_CORE_vertebrates_non-redundant databases (http://jaspar2018.genereg.net).
NMF modules and connected programs
To identify metagenes (gene modules) in the scRNA-seq data, we performed non-negative matrix factorization (NMF) using a previously published NMF framework (https://github.com/YiqunW/NMF)12. The analysis was performed on log-normalized read count data for a set of variable genes using the run_nmf.py With the following parameters: -rep 5 -scl “median” -miter 10000 -run_perm True -tol 1e-7 -a 2 -init “nndsvd”. Each NMF analysis was repeated 5 times using different randomly initialized conditions, enabling us to evaluate reproducibility. The optimal number of NMF metagenes for each time point and the integrated dataset was determined empirically by performing NMF analysis over a broad range of K values (typically from 10 to 100 by steps of 2). Results from various K values were integrated, and we selected a K value that had the highest number of informative metagenes, i.e., a point at which increasing K no longer increased the number of informative metagenes and became saturated. Informative metagenes were defined as having more than 10 genes on average, and a cluster reproducibility score > 0.6. Cluster reproducibility score is a statistic used previously in the URD package to evaluate the robustness of the metagene-based clustering, indicating the average proportion of cells that are clustered together in all replicates (a highly reproducible metagene would have a score close to 1). The final chosen K values for different time points/datasets were as follows: E10.5 (K=15), E11.5 (K=33), E12.5 (K=41), E13.5 (K=23), E14.5 (K=37), E15.5 (K=37), E16.5 (K=35), E18.5_S1 (K=29), E18.5_S2 (K=53), P1_S1 (K=41), P1_S2 (K=41), P4 (K=45), Fezf2merged_E15 (K=41). Modules from each time point were annotated based on the identity of the top ranked genes and cell type specificity as determined by UMAP visualizations. The top 25 genes in each module were used to calculate the weighted overlap between pairs of gene modules in adjacent stages. Modules that had <20% overlap with every module in two respective adjacent stages were removed. To generate continuous module lineages and avoid potential disconnections due to sparsity of sampling and sequencing, we allowed modules to connect to modules two stages apart, when connection to an immediate neighboring stage was not found, by calculating overlap between modules in every other stage. To record the final connections between modules, we started from the latest time point (P4) and connected each module to one from an immediate earlier stage with the highest level of overlap. All the below cutoff values are similar to the module tree reconstruction as previously described12 (https://github.com/YiqunW/NMF): When gene overlap among top 25 ranked genes was lower than 35%, we directly connected the module to one present two stages earlier as long as overlap was > 50%. Only the paths with >40% average weighted overlap were kept. NMF modules were also determined for the Fezf2 scRNA-seq data. We determined an overlapping score between modules found in the Fezf2 E15.5 and E15.5 wild-type data from the developmental time course. For modules with overlap higher than 40%, the module label was transferred. Differential expression of modules between KO and control Fezf2 samples was determined via Wilcoxon Rank Sum test with Bonferroni correction, Fezf2 E15.5 modules 3 and 11 (Extended Data Fig. 11d) showed significantly downregulated expression.
scATAC-seq data analysis
Cell Ranger ATAC was used to process Chromium Single Cell ATAC-seq data. Peak/cell matrix was Imported into Signac version 1.1.0 (https://satijalab.org/signac/), an extension of Seurat, for downstream analysis. Briefly, we kept those cells that passed the following QC metrics: peak_region_fragments > 3000 & peak_region_fragments < 100000; pct_reads_in_peaks > 40; blacklist_ratio < 0.025 ; nucleosome_signal < 4; TSS.enrichment > 2. After quality control and filtering, a dataset from three time points comprising 217,923 peaks from 23,557 single cells was analyzed. Gene activities for each gene in each cell were calculated using the GeneActivity() function by summing the peak counts in the gene body + 2 kb upstream48. Data were then normalized using term frequency inverse document frequency (TF-IDF) normalization (RunTFIDF), followed by dimensionality reduction using Singular Value Decomposition (RunSVD). K-nearest neighbors were calculated using FindNeighbors(reduction=”lsi”, dims=2:30). Finally, cell clusters were identified by a shared nearest neighbor (SNN) modularity optimization-based clustering algorithm FindClusters(algorithm=3, resolution=2). UMAP was generated using RunUMAP function with reduction=”lsi” and dims=2:30.
scRNA-seq and scATAC-seq data integration and transfer of cell type annotations
To help interpret the scATAC-seq data, we classified cells based on cell labels in the corresponding scRNA-seq experiments (same sample type, same age of collection). We performed cross-modality integration and label transfer with Seurat38 using FindTransferAnchors(reduction = 'cca') and TransferData(weight.reduction=’lsi’) functions, and shared correlation patterns in the gene activity matrix and scRNA-seq datasets were used to match biological cell types across the two modalities. This analysis returned a classification (cell type prediction) score for each cell. Cells were assigned the identity linked to their highest prediction score, with cells that displayed a value score lower than 0.5 filtered out.
Determination of dynamic sites through time
We used R package SCDC (0.0.0.9000)49 with nbulk=3 to create pseudobulk ATAC samples from scATAC-seq by randomly sampling single cells from each of the cell types of interest without replacement. For each time point, data were normalized using the R package DESeq2 and then pair-wise comparisons were performed (fold change 2, adjusted p-adjvalue < 0.05 in at least in any condition) to determine the differentially accessible peaks per cell type. The results from all possible pairwise comparisons within each time point were pooled and merged to define the dynamic set of enriched regions. To find different patterns over dynamic cis-elements, we applied K-means clustering (with optimal number of clusters per each dataset) to the dynamic datasets as described above.
Co-accessibility and cell type-specific enhancer prediction and motif enrichment
For each time point, we used Cicero v1.3.4.8 (https://cole-trapnell-lab.github.io/cicero-release/docs/) with default parameters to calculate co-accessible sites (coaccess_cutoff=0.1). By overlapping peaks with promoters (± 2 kb from the TSS), we partitioned peaks into gene promoters and distal elements and linked the distal regulatory elements to each putative promoter within a distance of ±100kb from the TSS. To find cell type and population specific distal elements along the ATAC tree, we first performed differential gene activity analysis (as a proxy for differentially expressed genes) in each cell type vs. other cell types in the tree, using FindMarkers() function with test.use = 'LR' and latent.vars = 'nCount_peaks' from Signac version 1.1.0. Next, we determined differentially accessible regions (DAR) for each cell type. Finally, for each cell type, those differential distal elements linked to the genes with differential gene activity were used for motif enrichment analysis. To find overrepresented motifs, we scanned a given set of differentially accessible peaks for all the DNA-binding motifs in the cis-bs (http://cisbp.ccbr.utoronto.ca) and JASPAR2018_CORE_vertebrates_non-redundant databases (http://jaspar2018.genereg.net). Using FindMotifs(), we then computed the number of features containing the motif (observed) compared to the total number of features containing the motif (background) using the hypergeometric test (with Bonferroni correction for multiple testing). Background peaks were randomly sampled from all scATAC-seq peaks and matched for GC content using MatchRegionStats in Signac48. Enriched motifs were further filtered based on average gene expression from matched scRNA-seq cells previously co-embedded with scATAC-seq cells.
Cell type assignment based on wild-type scRNA-seq atlas
We used the SingleCellNet v0.1.0 method50 to train a multi-class Random Forest classifier on the cell types of our developmental atlas based on 2,000 trees using the top 25 most discriminating gene-pairs. First, we balanced the number of cells per cluster (all between 2.2-3.6K cells). Next, 1,000 cells per cluster were used for training and the rest were used as hold-out data to assess the performance of the classifier, obtaining an average AUPR of 0.88. The classifier was then applied to the Fezf2 datasets, to explore the KO-specific cells from the E15.5 or P1 data.
Gene Ontology analysis
We used the clusterProfiler51 R package to find enriched biological processes or molecular functions in gene sets, with the enrichGO and compareCluster when more than one gene set was analyzed (Extended Data Fig. 8b). simplify was used to remove redundant GO terms, (cutoff=0.7).
In situ hybridization
Fluorescent multiplex RNA in situ hybridization was performed using the RNAscope Fluorescent Multiplex Reagent Kit (Advanced Cell Diagnostics) following the instructions by the manufacturer. The probes used are: Mm-Ptn (486381), Mm-Lpl-C3 (402791-C3), Mm-Bcl11b (413051), Mm-Satb2-C2 (413261-C2), Mm-Myt1l (483401), Mm-Ube2c-C2 (552191-C2), Mm-Dmrta2-C3 (584881-C3), Mm-Eomes (429641) (Advanced Cell Diagnostics).
Microscopy and image analysis
DAPI images from Slide-seq adjacent sections were obtained with a Zeiss Axio Imager.Z2 and processed with Zen Blue. Confocal images were obtained with an LSM 700 inverted confocal microscope (Zeiss) and analyzed with the Zen Black image-processing software and ImageJ. RNA scope images were quantified using a modified CellProfiler pipeline for speckles detection.
Data reporting
No statistical methods were used to predetermine sample size. The experiments were not randomized and the investigators were not blinded during experiments.
Extended Data
Extended Data Figure 1 (related to Figure 1). Classification of cell types in scRNA-seq data from individual time points.
a Number of replicates, total number of embryos, sex of animals and number of cells analyzed per time point. b Number of genes, number of mRNA molecules (counts), and percentage of mitochondrial counts per cell in each time point. c Proportion of cells corresponding to the different cell types present in each time point. 85 to 98% of cells were successfully identified for each time point. The earliest stages were primarily composed of apical and intermediate progenitors: AP+IP = 77% at E10.5, 80% at E11.5, 69% at E12.5, 66% at E13.5). d Correlation between male (M, Xist expression <1) and female (F, Xist expression >1) cells at E12.5 and E18.5 in selected cell types. Pearson correlation coefficients are indicated. Distinct genes include X-chromosome genes Xist and Tsix and Y-chromosome genes Ddx3y and Eif2s3y. Some hemoglobin genes also appear distinct, but, as shown in e they constitute few outlier cells. e Normalized expression levels of some of distinct genes between male and female cells at E18.5. Only two cell types are shown for clarity. f UMAP visualization of cells collected at each time point, showing expression levels (normalized) of marker genes for dorsal derivatives (Emx1), apical progenitors (Sox2), intermediate progenitors (Eomes), excitatory neurons (Neurod2), inhibitory interneurons (Dlx2), and glial cells (Apoe).
Extended Data Figure 2 (related to Figure 1). Molecular signatures and interneuron heterogeneity in the developing cerebral cortex.
a Selective expression (normalized) of marker genes per cell type in the combined scRNA-seq dataset. Cell types are grouped based on their identity and shared marker genes. b Gene signatures for all cell types identified in the combined time points. Top 20 differentially expressed genes for each cell type are presented. Cells were down-sampled to a maximum of 500 cells per cell type. b Expression of canonical marker genes for selected cell types in the UMAP visualization of the combined scRNA-seq time course. c Different subtypes of interneurons integrate into the developing cortex through time. From left to right: clustering of interneurons collected at all time points, visualized via UMAP. Interneuron UMAP plots show the expression of the inhibitory markers Dlx2 and Gad2, as well as a marker of dorsally-derived cell types (Emx1), not expressed by interneurons. Proportion of cells corresponding to each cluster in each time point. d Expression of genes characteristic of interneurons of different embryonic origins. Medial ganglionic eminence (MGE)-derived interneurons express Npy, Sst, Lhx6 and Nxph1. Interneurons originating in the CGE (caudal ganglionic eminence) are positive for Htr3a, Prox1, Cxcl14 and Sp8. A second population of Htr3a+ interneurons express Meis2, Etv1 and Sp8, putatively from the pallial-subpallial (P-SP) boundary.
Extended Data Figure 3 (related to Figure 2). Spatial mappings of cell types in the developing cerebral cortex.
a Mapping of extended cell types from the scRNA-seq data onto the matching Slide-seq section. Beads are colored according to the probability of the cell type being mapped in that position. b Gene expression of characteristic genes validating cell types matched for each time point. c Mapping probabilities for the deep layer cell types grouped by the cell type assigned (cell type with highest probability) corresponding to b. In box plots the middle line is the median, the lower and upper hinges correspond to the 25% and 75% quantiles, the upper whisker corresponds to the largest value no larger than 1.5×IQR from the hinge (where IQR is the inter-quartile range) and the lower whisker corresponds to the smallest value at most 1.5×IQR of the lower hinge. Total number of beads= 812. d Gene expression in E15.5 scRNA-seq data of genes associated with the migrating neuron sub-states identified in Figure 2d.
Extended Data Figure 4 (related to Figure 3). Consistent ordering of cells in developmental trajectories and characterization of branching tree of cortical development.
a UMAP visualizations of the scRNA-seq data from combined time points, with cells colored by pseudotime inferred by different methods. Left to right: URD pseudotime, Monocle3 pseudotime47, Latent time from sc-Velo45, Diffusion pseudotime (DPT)46, and Velocity pseudotime45. Purple represents earlier cells in the trajectory, while yellow labels later cells. Grey: cells that were excluded from the trajectory. b Correlation (red low and white high) for all cells between URD pseudotime values and pseudotime calculated by the specified method. R coefficient and p-value of the Pearson correlation is stated. c UMAP visualization of the cells used for trajectory building (same as cells used for Fig. 3a and related figures) colored by cell type (left) and pseudotime (right), on which a developmental trajectory was calculated using Monocle3. A similar branching structure was found. While it did not allow for finer segregation of the terminal neuronal types, Monocle3 ascribed a unique trajectory going from progenitors to all classes of neurons, with a post-mitotic branching into CPN and CFuPN branches (arrows, similar to URD). d Gene expression along trajectories calculated with URD (right) or Monocle3 (left).
e URD trajectory branching tree of the developing cortex. Cells are colored according to their developmental time of collection. f-g Normalized fraction of cells corresponding to each time point of collection (f) and to each cell type (g) across binned pseudotime, showing that pseudotime is aligned with age and cell type (compare to Fig.1c).
Extended Data Figure 5 (related to Figure 3). Neuronal cell types diverge post-mitotically.
a Branching trees showing the expression of marker genes of apical progenitors (Sox2, Hes5), intermediate progenitors (Eomes) and excitatory neurons (Neurod2), as well as genes characteristic of the dorsally-derived cortical cell types, including callosal neurons (Satb2, Cux2), layer 4 stellate neurons (Rorb), corticofugal neurons (Fezf2, Tle4, Pcp4, Tcerg1l), putative near-projecting neurons (Tshz2), astrocytes (Slc1a3, Aqp4, Aldh1l1), and ependymocytes (Foxj1). There is a sequential progression of apical progenitors, intermediate progenitors and excitatory neurons, followed by neuronal subtypes, astrocytes and ependymocytes.
b-c Force-directed layout embedding representation of the developmental branching tree, showing the initial part of the tree. Cells are colored according to their pseudotime value (left), age of collection (middle), or cell type (right). Differentially expressed genes between AP in each branch are highlighted and their expression levels are shown in c (see also Supplementary Information Table 2). d Tangram mapping probabilities of E13.5 AP from each branch onto matching Slide-seq section show that both states coexist in the ventricular zone. Arrowheads and arrows in the inset show probabilities in individual beads. AP corresponding to the astrocytic and neuronal branches form a continuum of cells.
e Top: Apical progenitors from different ages form a continuum of cells and do not segregate into distinct clusters. AP from all time points were sub-clustered separately, colored by age and clusters identified by Seurat. Bottom: Similar effect is observed when both apical and intermediate progenitors were sub-clustered, cells first separate mostly by cell type, and then continuously by time point. f Expression of CPN markers (Satb2, Pou3f3 and Cux1, left), and CFuPN markers (Fezf2, Tle4 and Bcl11b, right) in both early (E12.5) and late (E15.5) AP, as well as in the combined AP populations (all time points), when AP were co-embedded using the top 100 differentially expressed genes between CFuPN and CPN as input for principal component analysis and downstream clustering and visualization. Cell-type marker genes are expressed in progenitors but do not drive clustering of the cells.
g Separation in different classes of neurons occurs post-mitotically. Branching tree and UMAP representation of the full developmental atlas colored by cell-cycle phase, as predicted by gene expression.
h Tangram mapping of layer 5&6 CPN on P1 Slide-seq section. P1 cells allocated to each of the two terminal branches broadly labeled as layer 5&6 CPN were mapped onto the Slide-seq P1 section to find their distribution in the developing cortex. Mapping probabilities (top) indicated that cells from branch 1 were more likely to be mapped to layer 5, while cells from branch 2 mapped with enrichment to layer 6. Genes differentially expressed between both populations, layer 5- (Rorb, Fam19a2) and layer 6-CPN markers (Cdh13, Igsf21, Gnb4) show matching distribution (bottom).
Extended Data Figure 6 (related to Figure 3). Novel expression pattern of selected genes and NMF gene modules.
a-d Novel expression patterns emerging from the inferred tree. Expression levels overlaid on the tree (left), UMAP of full scRNA-seq developmental data (middle), and Slide-seq counts on an E15.5 or P1 section of cortex (right) for each gene. Rorb is expressed in developing CFuPN, astrocytes and layer 4 stellate neurons and present in the deep cortical plate (CP) (a). Pcp4 is expressed in migrating and immature neurons that contribute to both CPN and CFuPN, as well as in SCPN, layer 6b, NP and Cajal-Retzius cells (CR), and is found in the intermediate zone (IZ) and CP (b). Npy is expressed in CFuPN and highly in CPN of layers 5&6. Positive Npy signal is evident in the deep CP through Slide-seq (c). Cck was also detected in CFuPN and at higher levels in CPN of layers 5&6. Low levels of expression in the CP were detected via Slide-seq (d). VZ: ventricular zone. e Validation of expression of novel cell type-specific genes emerging from the cascade analysis. Expression levels overlaid on the tree (left), time course expression on purified subtypes of PN from DeCoN transcriptomic resource24,52 (middle), and in situ hybridization from the Allen Developing Mouse Brain Atlas23,53 (right, age indicated in figure).
f Complete set of gene programs of connected modules found by NMF. Each circular node represents a module. Modules are horizontally aligned to the developmental stage the module was computed from, and colored by the annotated function (see also Supplementary Information Table 3). g Scaled expression overlaid on branching tree of modules corresponding to broad neuronal differentiation programs, colored according to program identity. h Selected NMF modules expression from scRNA-seq data mapped onto time-matched Slide-seq section using tangram (Methods).
Extended Data Figure 7 (related to Figure 3). Genetic cascades accompanying development of cortical cell types.
Gene cascades for projection neuron subtypes, astrocytes and ependymocytes differentiaton. The x axis represents pseudotime across the tree. Each row is a gene where gene expression is scaled to the maximum observed expression and then smoothened. Genes are ordered by the pseudotime value at which they enter and then leave “peak” expression (expression 50% higher than minimum value), and start and then leave “expression” (expression 20% higher than minimum value), in that order. Smoothening of expression values was performed using spline fitting from URD for expression dynamics (Methods). Known marker genes for the cell type are labelled; see Supplementary Information Table 3 for the full list of genes.
Extended Data Figure 8 (related to Figure 3). Extended analysis of genes distinguishing between branches in URD tree.
a Feature importance (0.5 power transformed – dot size) and average expression of genes predicted to be involved in cell types divergence (row-scaled – color). Top 10 genes per branch, ranked by their Friedman MSE score (importance) for distinguishing between cells in one branch versus cells in sibling and parent branch. Color bar at top indicates branch-points marked on the tree to the left. Arrows indicate daughter branches. Genes in red correspond to transcription factors. Expression in parent branch not shown. b Gene Ontology analysis showing molecular function enrichment among genes involved in branch-points as determined in panel a. c Simplified URD branching trees on which average gene expression within a segment and a pseudotime bin is overlaid on the tree structure, showing restricted expression patterns of genes identified in a.
Extended Data Figure 9 (related to Figure 4). Characterization of scATAC-seq atlas and developmental trajectories of accessible elements through of cortical development.
a scATAC-seq data per time point. UMAP visualization of the single cells colored by their predicted identity from integration with scRNA-seq datasets (left). Gene accessibility of selected markers for main cell types present in each time point (middle). Maximum prediction score for each cell based on labels transferred from scRNA-seq data (right). b URD chromatin accessibility trajectories during cortical development. Cells are colored according to their age of collection. c ATAC trees highlighting the accessibility of marker genes characteristic of the different cortical cell types, including apical and intermediate progenitors, astrocytes, callosal and corticofugal neurons. d RNA-based tree generated from only the E13.5, E15.5 and E18.5 time points, corresponding to the scATAC-seq data. Trees are colored by cell type (left) and time of collection (right). e Chromatin accessibility and gene expression cascades for layers 2&3 CPN and SCPN. Same genes are plotted for both modalities, in the same order. f Chromatin accessibility and gene expression across pseudotime for illustrative genes from the SCPN cascade, CPN markers, or general neuronal markers plotted on the SCPN cascade. In many cases accessibility rises before gene expression.
Extended Data Figure 10 (related to Figure 4). Transcription factors with binding sites enriched along cortical development.
a Total number of accessible sites identified per time point and fraction that is dynamic across cell types (i.e., is enriched in at least one cell type). b Left: schematic of the approach used to identify candidate cell type-specific enhancers. Differential expression analysis identified cell type-specific genes, for which we calculated co-accessibility (correlation higher than 25%) between distal elements (within a 250 kb region) and target gene promoters using Cicero, within each cell type. c Distal elements co-accessible with the Pcp4 promoter region in E18.5 SCPN and migrating neurons. Cicero co-accessibility is shown in blue curves, detected peaks in each cell type are shown as colored bars. Black bars correspond to promoter peak, blue bars are peaks selectively co-accessible in CFuPN, and purple bars are peaks only co-accessible in migrating neurons. Boxes indicate transcription factors whose motifs are present in indicated peaks. Peaks are aligned to coverage plots (bottom) showing combined ATAC reads for the indicated cell types. Chromosome coordinates and genes are indicated at bottom. d TF binding sites enrichment on accessible sites of cells in the CPN vs CFuPN branch point (see Fig. 3d) shows significant enrichment of some of the TF detected in Fig. 3d, suggesting an actual role in this step. e Left: In situ hybridization against Eomes (IP marker), Ube2c (mitotic marker) and Dmrta2 showing expression of the latter in the dorsal ventricular zone (VZ) of a E12.5 developing cortex. Right: In situ hybridization against Satb2 and Myt1l showing expression of the latter in newborn neurons, co-expressed with Satb2. Slide-seq gene expression at the indicated ages show similar expression patterns. Scale bars are 30 μm. Representative images from in situ hybridizations repeated in 2 different embryos. ML and DV indicate dorso-ventral and medio-lateral orientations. f Slide-seq gene expression of several transcription factors (TFs) whose binding sites were found to be enriched within the accessible regions of the indicated trajectories (or portion of). Confirmation of gene expression in target cell type supports TF activity.
Extended Data Figure 11 (related to Figure 5). CFuPN acquire CThPN-like and layers 5&6 CPN-like identities in the absence of Fezf2.
a Violin plots of number of genes (left), number of mRNA molecules (counts; middle), and percentage of mitochondrial counts (right) per cell in control (Het) and KO Fezf2, and UMAP visualizations of merged scRNA-seq data sets at E15.5 (top) and P1 (bottom). UMAP visualizations are colored by genotype or assigned cell type. b UMAP visualization of single-cell transcriptomes from the excitatory lineage of control and KO cortices at P1 (as shown in Fig. 5c for E15.5), colored by genotype (left) and cell type (right). Proportion of cells of each cell type by genotype (bottom). c Heatmap showing the overlapping scores between NMF modules identified in the E15.5 Fezf2 datasets and the original E15.5 wild-type modules. All modules were identified with an overlapping score of 40% or higher. d Left: scaled module expression of significant modules in all cells (two-sided Wilcoxon Sum Rank test, Bonferroni correction). Right: average expression of the top 30 genes from selected modules, in apical and intermediate progenitors, and excitatory neurons, by genotype. Differential expression between control (Fezf2 Het) and KO neurons, at the single cell level (two-sided Wilcoxon Rank Sum test, Bonferroni correction). e Gene ontology terms enriched in the Fezf2 KO-specific module.
f Confusion matrix for random forest classifier calculated using 1,000 cells per cluster of the WT developmental atlas. The remaining held-out cells were used to test accuracy. g Classification of control (Fezf2 het) and Fezf2 KO excitatory neurons by the classifier presented in f, for P1 (left) or E15.5 (right) datasets. Cells are grouped according to their manually assigned identity based on the expression of marker genes. Box plots to the right show the corresponding classification scores where the middle line is the median, the lower and upper hinges correspond to the 25% and 75% quantiles, the upper whisker corresponds to the largest value no larger than 1.5×IQR from the hinge (where IQR is the inter-quartile range) and the lower whisker corresponds to the smallest value at most 1.5±IQR of the lower hinge. Lines in magenta, cyan, and green indicate 1, 0.5, and 0 values, respectively. Total number of cells: Fezf2 Het E15.5 = 6,092, Fezf2 KO E15.5 = 6,110, Fezf2 Het P1 = 5,101, Fezf2 KO P1 = 4,235.
Extended Data Figure 12 (related to Figure 5). CFuPN acquire CThPN-like and layers 5&6 CPN-like identities in the absence of Fezf2.
a-f Two subtypes of deep-layers KO cells were Identified at E15.5. Sub-clustering of deep-layers KO-exclusive cells alone at E15.5 (a) shows a Satb2LOW, Bcl11bHIGH cluster (cluster 0), and a Satb2HIGH cluster expressing also CPN markers Cux1 and Pou3f2 (cluster 1), as indicated in the violin plots (b). Differential expression analysis between both subtypes indicates enrichment of CFuPN genes in cluster 0 and CPN genes in cluster 1 (c). d Comparison to neurons in E15.5 wild-type data showing overlap between differentially expressed genes and markers from E15.5 neuronal subtypes. Bars indicate number of overlapping genes and are colored by the adjusted p-value calculated by hypergeometric test for significant enrichment. e Classification of cells from both E15.5 KO-specific clusters according to random forest classifier shows good agreement between both annotations. f NMF module expression (as in Fig. 5b) in the KO-specific cells, grouped according to the cell type assigned by the random forest classifier. g-i Sub-clustering (g) and differential expression analysis (h) of deep-layers KO-exclusive cells alone at P1 reveals two subpopulations that correspond to CThPN-like and layers 5&6 CPN-like populations. i Classification of cells from both P1 KO-specific clusters according to random forest classifier shows good agreement between both annotations.
j-k Differential expression analysis of the aberrant layer 5&6 CPN-like cells from the KO-exclusive populations at P1 compared to layers 5&6 CPN (j) or SCPN (k) populations in the control.
l-m In situ hybridization against Bcl11b and Lpl (a) or Ptn (b), in P1 control (wild type) and Fezf2 KO coronal sections, showing higher levels of expression of Lpl and Ptn on layers 5 and 6 and reduced Bcl11b in layer 5 (insets to the right correspond to boxes in left panels). Note cells expressing both Bcl11b and Lpl in magnification from layer 6, reflecting an aberrant CThPN identity. Number of positive speckles per 104 μm2. Quantification was calculated with a modified pipeline from CellProfiler from an area of ~200 by 150 μm or ~200 by 100 μm centered in layers 6 or 5, respectively. Data correspond to mean±sem, from n = 3 mice, > 3 sections each. Unpaired t test, exact p-values indicated. Scale bars are 30 μm, except in higher magnification in l, 15 μm.
n Violin plots of number of genes (left) and mRNA molecules (counts; middle), and percentage of mitochondrial counts (right) per cell in control and KO Fezf2 E13.5 single cell transcriptomes, and UMAP visualizations of combined control and KO complete data sets, colored by genotype or assigned cell type. o Dorsally-derived cells in Fezf2 control and KO E13.5 scRNA-seq, visualized via UMAP and colored by genotype (left) or cell types (right). Proportion of cells in each cell type, according to their genotype. p Differential expression analysis between control and KO migrating or immature neurons shows upregulation of a subset of CPN marker genes and downregulation of CFuPN-specific genes.
Supplementary Material
AKNOWLEDGEMENTS
We thank former and present members of the Arlotta and Regev laboratories for insightful discussions and editing of the manuscript. This work was supported by grants from the Stanley Center for Psychiatric Research (6910149-550000753), the Broad Institute of MIT and Harvard, the P50 Conte Center: (5P50MH094271 Developmental origins of mental illness: evolution and reversibility) to P.A., the National Institutes of Health (5U19MH114821, 5R01NS103758 to P.A. and DP5OD024583 to F.C.), and The Klarman Cell Observatory, HHMI and an NHGRI Center for Cell Circuits CEGS grant to A.R. D.J.D was supported by the Pew Latin American Postdoctoral Fellowship.
Footnotes
COMPETING INTERESTS
P.A. is a SAB member for System 1 Biosciences and Foresite Labs and is a co-founder of Serquet Therapeutics. A.R. is a co-founder of and equity holder in Celsius Therapeutics, equity holder in Immunitas, and until July 31, 2020 was a SAB member of ThermoFisher Scientific, Syros Pharmaceuticals, Asimov, and Neogene Therapeutics. From August 1, 2020, A.R. is an employee of Genentech/Roche. From February 1, 2021, T.B. is an employee of Genentech. From January 1, 2021, G.S. is an employee of Roche.
CODE AVAILABILITY STATEMENT
R markdown scripts enabling the main steps of analysis is available on a GitHub repository https://github.com/ehsanhabibi/MolecularLogicMouseNeoCortex.
All sequencing data are present in the NCBI GEO SuperSeries GSE153164.
DATA AVAILABILITY STATEMENT
The datasets generated during the current study are available in the Gene Expression Omnibus (GEO SuperSeries GSE153164) and at the Single Cell Portal, https://singlecell.broadinstitute.org/single_cell/study/SCP1290/molecular-logic-of-cellular-diversification-in-the-mammalian-cerebral-cortex.
REFERENCES
- 1.Lodato S & Arlotta P Generating neuronal diversity in the mammalian cerebral cortex. Annu Rev Cell Dev Biol 31, 699–720, doi: 10.1146/annurev-cellbio-100814-125353 (2015). [DOI] [PMC free article] [PubMed] [Google Scholar]
- 2.Greig LC, Woodworth MB, Galazo MJ, Padmanabhan H & Macklis JD Molecular logic of neocortical projection neuron specification, development and diversity. Nat Rev Neurosci 14, 755–769, doi: 10.1038/nrn3586 (2013). [DOI] [PMC free article] [PubMed] [Google Scholar]
- 3.Yuzwa SA et al. Developmental Emergence of Adult Neural Stem Cells as Revealed by Single-Cell Transcriptional Profiling. Cell Rep 21, 3970–3986, doi: 10.1016/j.celrep.2017.12.017 (2017). [DOI] [PubMed] [Google Scholar]
- 4.Frazer S et al. Transcriptomic and anatomic parcellation of 5-HT3AR expressing cortical interneuron subtypes revealed by single-cell RNA sequencing. Nat Commun 8, 14219, doi: 10.1038/ncomms14219 (2017). [DOI] [PMC free article] [PubMed] [Google Scholar]
- 5.Mayer C et al. Developmental diversification of cortical inhibitory interneurons. Nature 555, 457–462, doi: 10.1038/nature25999 (2018). [DOI] [PMC free article] [PubMed] [Google Scholar]
- 6.Bielle F et al. Multiple origins of Cajal-Retzius cells at the borders of the developing pallium. Nat Neurosci 8, 1002–1012, doi: 10.1038/nn1511 (2005). [DOI] [PubMed] [Google Scholar]
- 7.Stickels RR et al. Highly sensitive spatial transcriptomics at near-cellular resolution with Slide-seqV2. Nat Biotechnol, doi: 10.1038/s41587-020-0739-1 (2020). [DOI] [PMC free article] [PubMed] [Google Scholar]
- 8.Biancalani T et al. Deep learning and alignment of spatially-resolved whole transcriptomes of single cells in the mouse brain with Tangram. 2020.2008.2029.272831, doi: 10.1101/2020.08.29.272831 %J bioRxiv (2020). [DOI] [Google Scholar]
- 9.Kim EJ, Juavinett AL, Kyubwa EM, Jacobs MW & Callaway EM Three Types of Cortical Layer 5 Neurons That Differ in Brain-wide Connectivity and Function. Neuron 88, 1253–1267, doi: 10.1016/j.neuron.2015.11.002 (2015). [DOI] [PMC free article] [PubMed] [Google Scholar]
- 10.Tasic B et al. Shared and distinct transcriptomic cell types across neocortical areas. Nature 563, 72–78, doi: 10.1038/s41586-018-0654-5 (2018). [DOI] [PMC free article] [PubMed] [Google Scholar]
- 11.Allen Cell Types Database, <http://celltypes.brain-map.org/rnaseq/mousectx-hipsmart-seq> (2015).
- 12.Farrell JA et al. Single-cell reconstruction of developmental trajectories during zebrafish embryogenesis. Science 360, doi: 10.1126/science.aar3131 (2018). [DOI] [PMC free article] [PubMed] [Google Scholar]
- 13.Arlotta P et al. Neuronal subtype-specific genes that control corticospinal motor neuron development in vivo. Neuron 45, 207–221, doi: 10.1016/j.neuron.2004.12.036 (2005). [DOI] [PubMed] [Google Scholar]
- 14.Florio M & Huttner WB Neural progenitors, neurogenesis and the evolution of the neocortex. Development 141, 2182–2194, doi: 10.1242/dev.090571 (2014). [DOI] [PubMed] [Google Scholar]
- 15.Jhas S et al. Hes6 inhibits astrocyte differentiation and promotes neurogenesis through different mechanisms. J Neurosci 26, 11061–11071, doi: 10.1523/JNEUROSCI.1358-06.2006 (2006). [DOI] [PMC free article] [PubMed] [Google Scholar]
- 16.Malatesta P & Gotz M Radial glia - from boring cables to stem cell stars. Development 140, 483–486, doi: 10.1242/dev.085852 (2013). [DOI] [PubMed] [Google Scholar]
- 17.Telley L et al. Temporal patterning of apical progenitors and their daughter neurons in the developing neocortex. Science 364, doi: 10.1126/science.aav2522 (2019). [DOI] [PubMed] [Google Scholar]
- 18.Llorca A et al. A stochastic framework of neurogenesis underlies the assembly of neocortical cytoarchitecture. Elife 8, doi: 10.7554/eLife.51381 (2019). [DOI] [PMC free article] [PubMed] [Google Scholar]
- 19.Guo C et al. Fezf2 expression identifies a multipotent progenitor for neocortical projection neurons, astrocytes, and oligodendrocytes. Neuron 80, 1167–1174, doi: 10.1016/j.neuron.2013.09.037 (2013). [DOI] [PMC free article] [PubMed] [Google Scholar]
- 20.Gao P et al. Deterministic progenitor behavior and unitary production of neurons in the neocortex. Cell 159, 775–788, doi: 10.1016/j.cell.2014.10.027 (2014). [DOI] [PMC free article] [PubMed] [Google Scholar]
- 21.Franco SJ et al. Fate-restricted neural progenitors in the mammalian cerebral cortex. Science 337, 746–749, doi: 10.1126/science.1223616 (2012). [DOI] [PMC free article] [PubMed] [Google Scholar]
- 22.Zahr SK et al. A Translational Repression Complex in Developing Mammalian Neural Stem Cells that Regulates Neuronal Specification. Neuron 97, 520–537 e526, doi: 10.1016/j.neuron.2017.12.045 (2018). [DOI] [PubMed] [Google Scholar]
- 23.Thompson CL et al. A high-resolution spatiotemporal atlas of gene expression of the developing mouse brain. Neuron 83, 309–323, doi: 10.1016/j.neuron.2014.05.033 (2014). [DOI] [PMC free article] [PubMed] [Google Scholar]
- 24.Molyneaux BJ et al. DeCoN: genome-wide analysis of in vivo transcriptional dynamics during pyramidal neuron fate selection in neocortex. Neuron 85, 275–288, doi: 10.1016/j.neuron.2014.12.024 (2015). [DOI] [PMC free article] [PubMed] [Google Scholar]
- 25.Dixit A et al. Perturb-Seq: Dissecting Molecular Circuits with Scalable Single-Cell RNA Profiling of Pooled Genetic Screens. Cell 167, 1853–1866 e1817, doi: 10.1016/j.cell.2016.11.038 (2016). [DOI] [PMC free article] [PubMed] [Google Scholar]
- 26.Preissl S et al. Single-nucleus analysis of accessible chromatin in developing mouse forebrain reveals cell-type-specific transcriptional regulation. Nat Neurosci 21, 432–439, doi: 10.1038/s41593-018-0079-3 (2018). [DOI] [PMC free article] [PubMed] [Google Scholar]
- 27.Ma S et al. Chromatin Potential Identified by Shared Single-Cell Profiling of RNA and Chromatin. Cell 183, 1103–1116 e1120, doi: 10.1016/j.cell.2020.09.056 (2020). [DOI] [PMC free article] [PubMed] [Google Scholar]
- 28.Urquhart JE et al. DMRTA2 (DMRT5) is mutated in a novel cortical brain malformation. Clin Genet 89, 724–727, doi: 10.1111/cge.12734 (2016). [DOI] [PubMed] [Google Scholar]
- 29.Cubelos B et al. Cux1 and Cux2 regulate dendritic branching, spine morphology, and synapses of the upper layer neurons of the cortex. Neuron 66, 523–535, doi: 10.1016/j.neuron.2010.04.038 (2010). [DOI] [PMC free article] [PubMed] [Google Scholar]
- 30.Lodato S et al. Excitatory projection neuron subtypes control the distribution of local inhibitory interneurons in the cerebral cortex. Neuron 69, 763–779, doi: 10.1016/j.neuron.2011.01.015 (2011). [DOI] [PMC free article] [PubMed] [Google Scholar]
- 31.Molyneaux BJ, Arlotta P, Hirata T, Hibi M & Macklis JD Fezl is required for the birth and specification of corticospinal motor neurons. Neuron 47, 817–831, doi: 10.1016/j.neuron.2005.08.030 (2005). [DOI] [PubMed] [Google Scholar]
- 32.Chen B, Schaevitz LR & McConnell SK Fezl regulates the differentiation and axon targeting of layer 5 subcortical projection neurons in cerebral cortex. Proc Natl Acad Sci U S A 102, 17184–17189, doi: 10.1073/pnas.0508732102 (2005). [DOI] [PMC free article] [PubMed] [Google Scholar]
- 33.Lodato S et al. Gene co-regulation by Fezf2 selects neurotransmitter identity and connectivity of corticospinal neurons. Nat Neurosci 17, 1046–1054, doi: 10.1038/nn.3757 (2014). [DOI] [PMC free article] [PubMed] [Google Scholar]
- 34.Hirata T et al. Zinc finger gene fez-like functions in the formation of subplate neurons and thalamocortical axons. Dev Dyn 230, 546–556, doi: 10.1002/dvdy.20068 (2004). [DOI] [PubMed] [Google Scholar]
- 35.Loo L et al. Single-cell transcriptomic analysis of mouse neocortical development. Nat Commun 10, 134, doi: 10.1038/s41467-018-08079-9 (2019). [DOI] [PMC free article] [PubMed] [Google Scholar]
- 36.Demonstrated protocol - Nuclei Isolation for Single Cell ATAC Sequencing. (2019).
- 37.Fleming SJ, Marioni JC & Babadi M CellBender remove-background: a deep generative model for unsupervised removal of background noise from scRNA-seq datasets. 791699, doi: 10.1101/791699 %J bioRxiv (2019). [DOI] [Google Scholar]
- 38.Stuart T et al. Comprehensive Integration of Single-Cell Data. Cell 177, 1888–1902 e1821, doi: 10.1016/j.cell.2019.05.031 (2019). [DOI] [PMC free article] [PubMed] [Google Scholar]
- 39.Kowalczyk MS et al. Single-cell RNA-seq reveals changes in cell cycle and differentiation programs upon aging of hematopoietic stem cells. Genome Res 25, 1860–1872, doi: 10.1101/gr.192237.115 (2015). [DOI] [PMC free article] [PubMed] [Google Scholar]
- 40.Blondel VD, Guillaume J-L, Lambiotte R, Lefebvre E J. J. o. s. m. t. & experiment. Fast unfolding of communities in large networks. 2008, P10008 (2008). [Google Scholar]
- 41.McGinnis CS, Murrow LM & Gartner ZJ DoubletFinder: Doublet Detection in Single-Cell RNA Sequencing Data Using Artificial Nearest Neighbors. Cell Syst 8, 329–337 e324, doi: 10.1016/j.cels.2019.03.003 (2019). [DOI] [PMC free article] [PubMed] [Google Scholar]
- 42.Wolock SL, Lopez R & Klein AM Scrublet: Computational Identification of Cell Doublets in Single-Cell Transcriptomic Data. Cell Syst 8, 281–291 e289, doi: 10.1016/j.cels.2018.11.005 (2019). [DOI] [PMC free article] [PubMed] [Google Scholar]
- 43.Dobin A et al. STAR: ultrafast universal RNA-seq aligner. Bioinformatics 29, 15–21, doi: 10.1093/bioinformatics/bts635 (2013). [DOI] [PMC free article] [PubMed] [Google Scholar]
- 44.Angerer P et al. destiny: diffusion maps for large-scale single-cell data in R. Bioinformatics 32, 1241–1243, doi: 10.1093/bioinformatics/btv715 (2016). [DOI] [PubMed] [Google Scholar]
- 45.Bergen V, Lange M, Peidli S, Wolf FA & Theis FJ Generalizing RNA velocity to transient cell states through dynamical modeling. Nat Biotechnol 38, 1408–1414, doi: 10.1038/s41587-020-0591-3 (2020). [DOI] [PubMed] [Google Scholar]
- 46.Haghverdi L, Buttner M, Wolf FA, Buettner F & Theis FJ Diffusion pseudotime robustly reconstructs lineage branching. Nat Methods 13, 845–848, doi: 10.1038/nmeth.3971 (2016). [DOI] [PubMed] [Google Scholar]
- 47.Cao J et al. The single-cell transcriptional landscape of mammalian organogenesis. Nature 566, 496–502, doi: 10.1038/s41586-019-0969-x (2019). [DOI] [PMC free article] [PubMed] [Google Scholar]
- 48.Stuart T, Srivastava A, Lareau C & Satija R Multimodal single-cell chromatin analysis with Signac. 2020.2011.2009.373613, doi: 10.1101/2020.11.09.373613 %J bioRxiv (2020). [DOI] [Google Scholar]
- 49.Dong M et al. SCDC: bulk gene expression deconvolution by multiple single-cell RNA sequencing references. Brief Bioinform 22, 416–427, doi: 10.1093/bib/bbz166 (2021). [DOI] [PMC free article] [PubMed] [Google Scholar]
- 50.Tan Y & Cahan P SingleCellNet: A Computational Tool to Classify Single Cell RNA-Seq Data Across Platforms and Across Species. Cell Syst 9, 207–213 e202, doi: 10.1016/j.cels.2019.06.004 (2019). [DOI] [PMC free article] [PubMed] [Google Scholar]
- 51.Yu G, Wang LG, Han Y & He QY clusterProfiler: an R package for comparing biological themes among gene clusters. OMICS 16, 284–287, doi: 10.1089/omi.2011.0118 (2012). [DOI] [PMC free article] [PubMed] [Google Scholar]
- 52.DeCoN, <http://decon.fas.harvard.edu/pyramidal/> (2014).
- 53.Allen Developing Mouse Brain Atlas <http://developingmouse.brain-map.org/> (2008).
Associated Data
This section collects any data citations, data availability statements, or supplementary materials included in this article.
Supplementary Materials
Data Availability Statement
The datasets generated during the current study are available in the Gene Expression Omnibus (GEO SuperSeries GSE153164) and at the Single Cell Portal, https://singlecell.broadinstitute.org/single_cell/study/SCP1290/molecular-logic-of-cellular-diversification-in-the-mammalian-cerebral-cortex.


