. 2022 Feb 25;11:e74595. doi: 10.7554/eLife.74595

Figure 1. Loss of Kdm6b in cranial neural crest (CNC)-derived cells results in cleft palate.

(A, B) Whole-mount oral view shows complete cleft palate phenotype in Wnt1Cre;Kdm6bfl/fl mice. Arrowhead in (B) indicates the cleft palate. Scale bar: 2 mm. (C, D) CT imaging reveals that the palatine process of the maxilla and palatine bone (PB) is missing in Wnt1Cre;Kdm6bfl/fl mice. White arrowheads in (C) indicate the palatine process of maxilla (PPM) in control mice, and red arrows indicate the PB. White asterisk in (D) indicates the missing PPM in Wnt1Cre;Kdm6bfl/fl mice, and red asterisk in (D) indicates the missing PB in Kdm6b mutant mice. Scale bars: 1 mm. (E, F) Sagittal views of CT images demonstrate the locations of HE sections in (G–R). Red lines indicate the locations of sections. Yellow arrow in (E) indicates palatal shelf, and yellow asterisk in (F) indicates cleft. Scale bars: 1 mm. (G–R) Histological analysis of control and Wnt1Cre;Kdm6bfl/fl mice. (H, J, L, N, P, R) are magnified images of boxes in (G, I, K, M, O, Q), respectively. Asterisks in (M, O, Q) indicate cleft in Kdm6b mutant mice. Scale bar: 200 µm. Mes: mesenchyme.

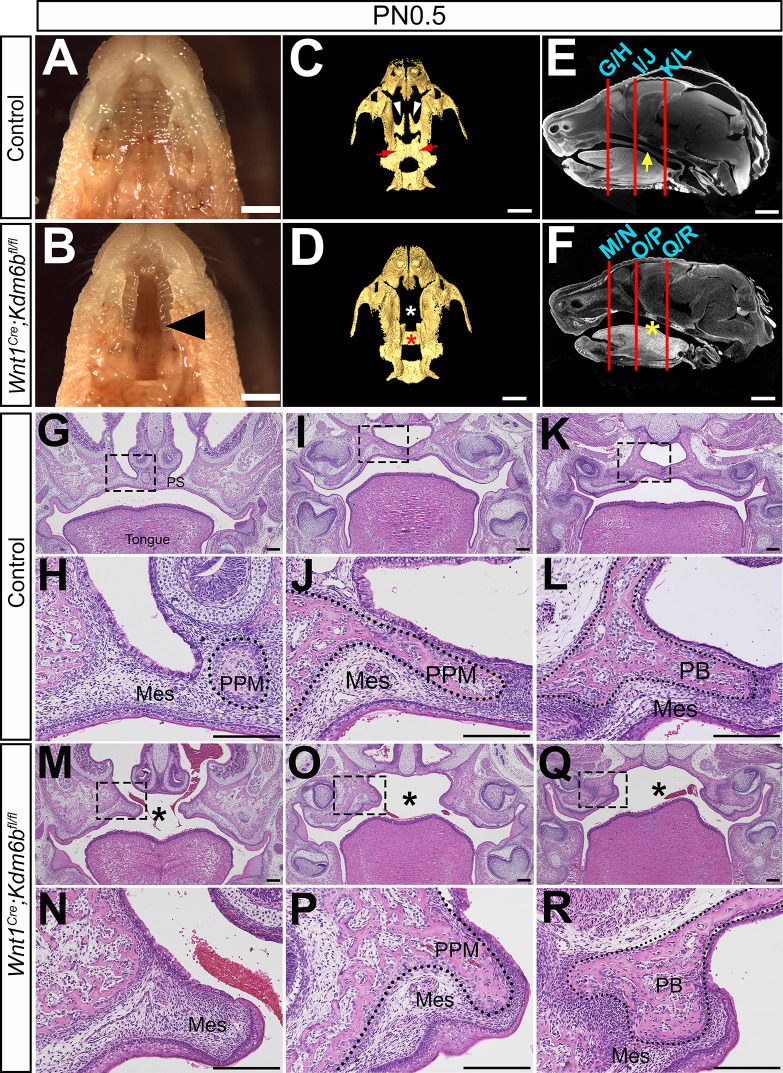
Figure 1.

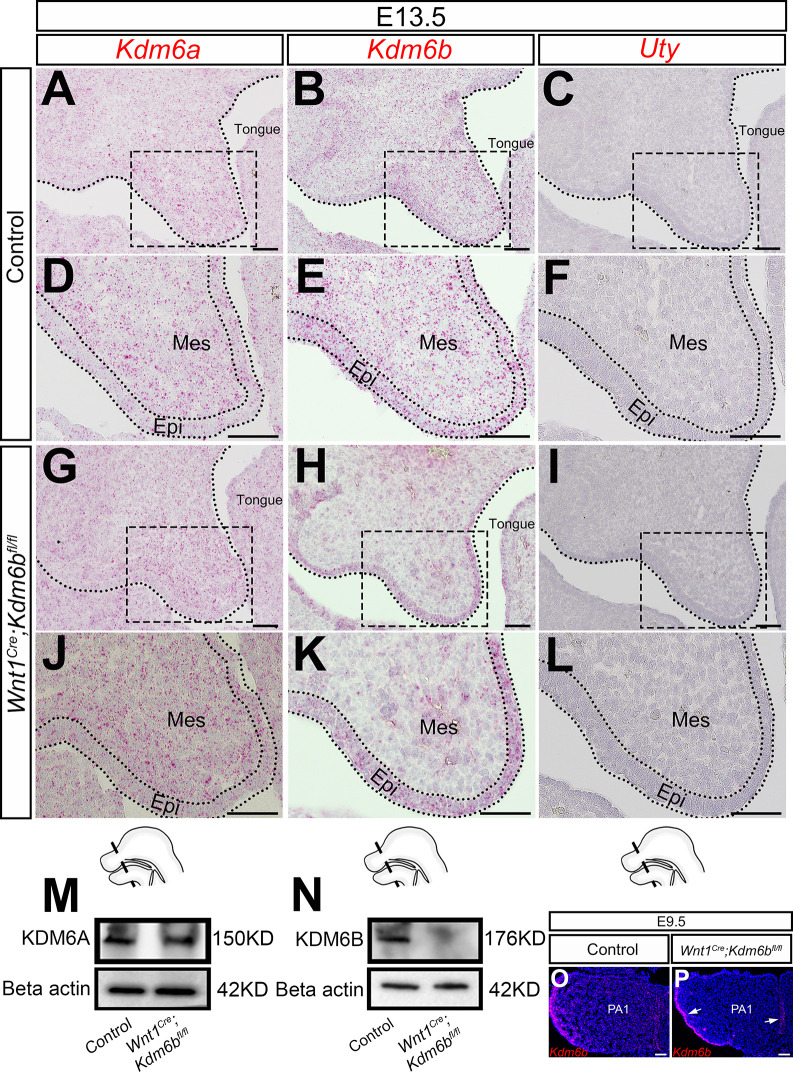
Figure 1—figure supplement 1. Expression of KDM6 family.

Figure 1—figure supplement 1.

(A–L) Expression of KDM6 family genes in the palatal region at E13.5 using RNAscope in situ hybridization. (DF, JL) are magnified images of boxes in (A–C, G–I), respectively. Dotted lines in (A–C, G–I) indicate region of palatal shelf (PS). Dotted lines in (D–F, J–L) indicate epithelium (Epi). Schematic drawing at the bottom of the figure indicates the location of the presented section. Scale bar: 50 µm. Mes: mesenchyme. (M, N) Protein quantification of KDM6A and KDM6B in control and Kdm6b mutant palatal region at E13.5 using Western blot. (O, P) Expression of Kdm6b in the first pharyngeal arch (PA1) at E9.5 assessed using RNAscope in situ hybridization. Arrows in (P) indicate expression of Kdm6b at epithelium. Scale bar: 50 µm.
Figure 1—figure supplement 1—source data 1. Source data for Figure 1—figure supplement 1M.
Figure 1—figure supplement 1—source data 2. Source data for Figure 1—figure supplement 1N.
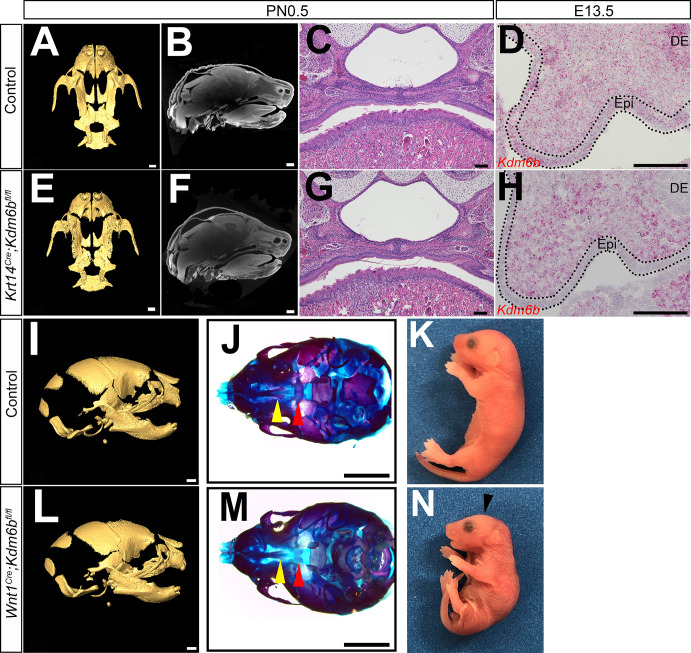
Figure 1—figure supplement 2. Loss of Kdm6b in epithelium (Epi) and cranial neural crest (CNC)-derived cells.

Figure 1—figure supplement 2.

(A–C, E–G) CT images and histological analysis of Krt14Cre;Kdm6bfl/fl mice at PN0.5. Scale bars in (A, E): 0.4 mm; Scale bars in (B, F): 0.6 mm; scale bars in (C, G): 100 µm. (D, H) Expression of Kdm6b assessed using RNAscope in situ hybridization at E13.5. Kdm6b is efficiently knocked out from Epi in Krt14Cre;Kdm6bfl/fl mice. Dotted lines in (D, H) indicate Epi. Scale bar: 100 µm. DE: dental epithelium. (I–N) No obvious phenotype was observed in skull bones or mandible in Wnt1Cre;Kdm6bfl/fl mice at PN0.5. Yellow triangles in (J, M) indicate the location of palatine process of maxilla, and red triangle indicates the location of palatine bone. Arrowhead in (N) indicates flattened skull observed in Wnt1Cre;Kdm6bfl/fl mice. Scale bars in (I, L): 0.6 mm; scale bars in (J, M): 1 mm.
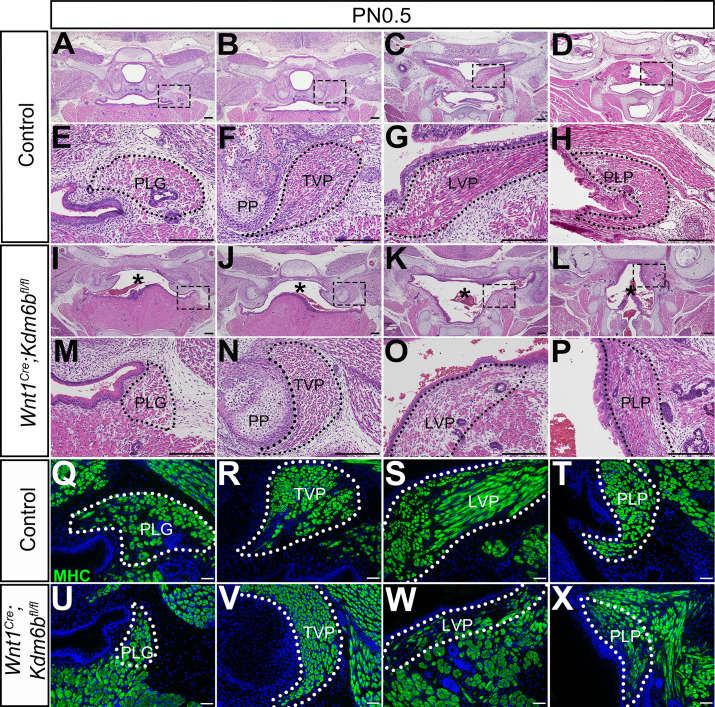
Figure 1—figure supplement 3. Loss of Kdm6b in cranial neural crest (CNC)-derived cells results in soft palate muscle defects.

Figure 1—figure supplement 3.

(A–P) Histological analysis of soft palate muscles at PN0.5. Boxes in (A–D, I–L) are shown magnified in (E–H, M–P), respectively. Dotted lines outline each muscle. Asterisks in (I–L) indicate cleft palate observed in Wnt1Cre;Kdm6bfl/fl mice. PP: pterygoid plate; PLG: palatoglossus; TVP: tensor veli palatini; LVP: levator veli palatini; PLP: palatopharyngeus. Scale bar: 100 µm. Asterisks in (I–L) indicate cleft in Wnt1Cre;Kdm6bfl/fl mice. (Q–X) Immunostaining of MHC at PN0.5. Dotted lines outline each muscle. Scale bar: 50 µm.