. 2022 Feb 25;11:e74595. doi: 10.7554/eLife.74595

Figure 4. Altered Trp53 expression is responsible for the developmental defects in Wnt1Cre;Kdm6bfl/fl mice.

(A–C) Cells collected from E13.5 palatal tissue are transfected with siRNA to knock down expression of Trp53. Cell proliferation is evaluated using EdU labeling 3 days after transfection. (A, B) show proliferation of cells assessed by EdU labeling. Difference in EdU+ cells between mock- and siRNA-transfected groups is quantified in (C). Scale bar: 100 µm. *p<0.05. (D–F) Cells collected from E13.5 palatal tissue are transfected with siRNA to knock down expression of Trp53. DNA damage is evaluated using γH2AX 3 days after transfection. (D, E) show γH2AX+ cells. Difference in γH2AX+ cells between mock- and siRNA-transfected groups is quantified in (F). Scale bar: 100 µm. *p<0.05. (G–R) Histological analysis of control and Wnt1Cre;Kdm6bfl/fl mice treated with Nutlin-3. (J–L, P–R) are magnified images of boxes in (G–I, M–O), respectively. Scale bar: 200 µm. Mes: mesenchyme; PPM: palatine process of maxilla; PB: palatine bone.

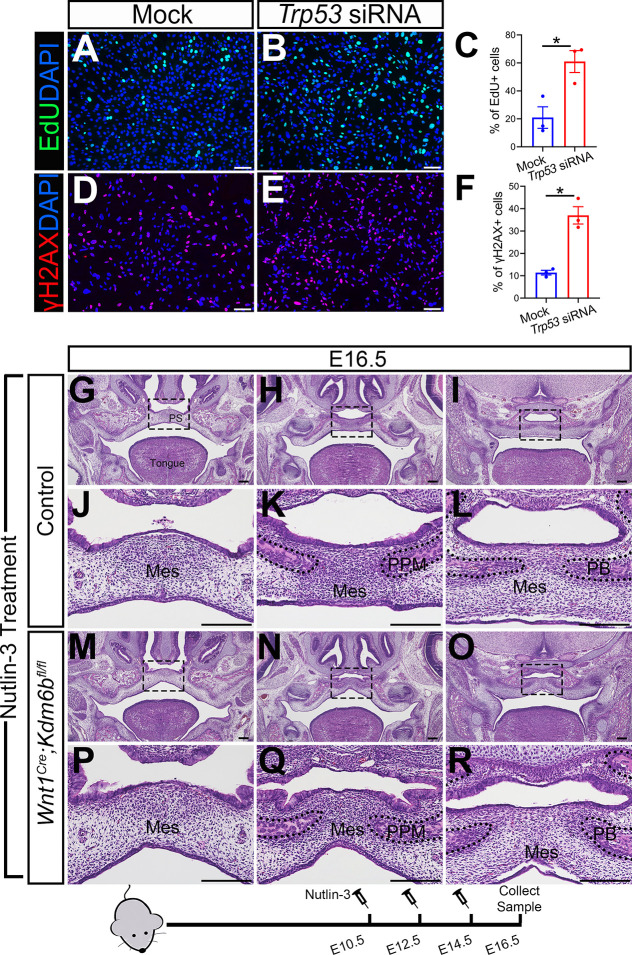
Figure 4—source data 1. Source data for Figure 4C.
Figure 4—source data 2. Source data for Figure 4F.

Figure 4.

Figure 4—figure supplement 1. Trp53 plays a critical role in regulating palatogenesis.

Figure 4—figure supplement 1.

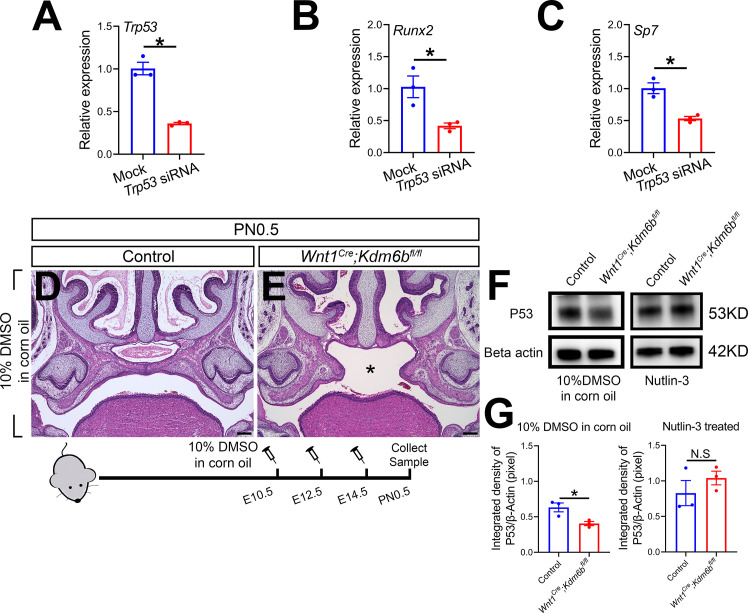
(A–C) RT-qPCR analysis of Trp53, Runx2, and Sp7 expression in cells isolated from the palatal region of control mice 3 days after transfection with Trp53 siRNA. *p<0.05. (D, E) Histological analysis of samples treated with 10% DMSO in corn oil at E10.5, E12.5, and E14.5. Asterisk in (E) indicates cleft palate observed in Wnt1Cre;Kdm6bfl/fl mouse. Scale bar: 200 µm. (F) P53 protein in the palatal region quantified using Western blot. (G) Quantification of Western blot represented in (F). *p<0.05. N.S: not significant.
Figure 4—figure supplement 1—source data 1. Source data for Figure 4—figure supplement 1A.
Figure 4—figure supplement 1—source data 2. Source data for Figure 4—figure supplement 1B.
Figure 4—figure supplement 1—source data 3. Source data for Figure 4—figure supplement 1C.
Figure 4—figure supplement 1—source data 4. Source data for Figure 4—figure supplement 1F.
Figure 4—figure supplement 1—source data 5. Source data for Figure 4—figure supplement 1G.