. 2022 Feb 25;11:e74595. doi: 10.7554/eLife.74595

Figure 8. Kdm6b regulates expression of Trp53 through H3K27me3 and interacts with transcription factor TFDP1 in the activation of Trp53.

(A) ChIP-qPCR shows H3K27me3 deposition at the promoter region of Trp53 in palatal tissues of control, Kdm6b mutant, and Ezh2 haploinsufficient mice. ANOVA is used for statistical analysis. *p<0.05. N.S: not significant. (B–G) Expression of Trp53 in the palatal region at E13.5 using RNAscope in situ hybridization. Dotted lines in (B–D) indicate palatal shelf. (E–G) are magnified images of boxes in (B–D), respectively. Asterisk in (F) indicates decreased expression of Trp53 observed in Wnt1Cre;Kdm6bfl/fl mice. Scale bar: 50 µm. (H) RT-qPCR analysis of Trp53 expression in the palatal region of control, Kdm6b mutant, and Ezh2 haploinsufficient mice. ANOVA is used for statistical analysis. *p<0.05. N.S: not significant. (I) ChIP-qPCR shows KDM6B deposition at the promoter region of Trp53 in the palatal tissue of control mice. *p<0.05. (J, K) RT-qPCR analysis of Trp53 expression in palatal mesenchymal cells transfected with Kdm6b- or Kdm6a-overexpressing plasmids. *p<0.05. N.S: not significant. (L) ATAC-seq analysis indicates that the promoter region of Trp53 is accessible for transcription factor TFDP1. (M) ChIP-qPCR using palatal tissue shows that binding of TFDP1 to the promoter of Trp53 decreases in the Kdm6b mutant mice. *p<0.05. N.S: not significant. (N, O) Co-localization of TFDP1, Kdm6b, and Trp53 at E13.5 using immunostaining and RNAscope in situ hybridization. Dotted lines in (N) indicate palatal shelf. (O) is a magnified image of the box in (N). Arrowheads in (O) indicate representative cells that are positive for TFDP1, Kdm6b, and Trp53. Scale bar: 50 µm in (N) and 5 µm in (O). (P) RT-qPCR quantification shows the expression of Tfdp1 in samples collected at E13.5. N.S: not significant. (Q) RT-qPCR analysis of Trp53 expression in palatal mesenchymal cells after Tfdp1 siRNA transfection. *p<0.05. (R, S) RT-qPCR analysis of Trp53 expression in palatal mesenchymal cells transfected with Tfdp1 overexpressing plasmid. (R) *p<0.05. N.S: not significant. (T) Co-immunoprecipitation (Co-IP) experiment using protein extract from palatal tissues indicates that KDM6B and TFDP1 are present in the same complex. Anti-KDM6B antibody was used for immunoprecipitation (IP). IgG served as negative control. IB: immunoblotting.

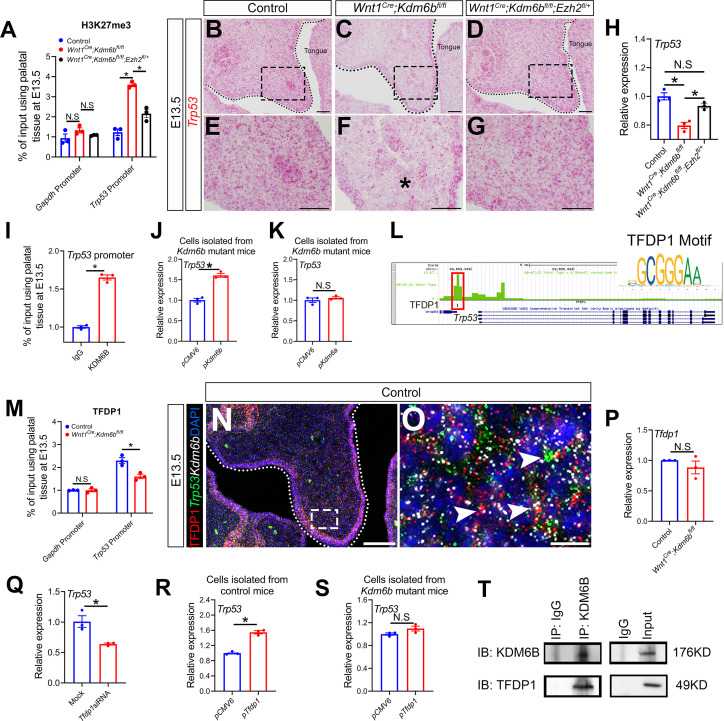
Figure 8—source data 1. Source data for Figure 8A.
Figure 8—source data 2. Source data for Figure 8H.
Figure 8—source data 3. Source data for Figure 8I.
Figure 8—source data 4. Source data for Figure 8J.
Figure 8—source data 5. Source data for Figure 8K.
Figure 8—source data 6. Source data for Figure 8M.
Figure 8—source data 7. Source data for Figure 8P.
Figure 8—source data 8. Source data for Figure 8Q.
Figure 8—source data 9. Source data for Figure 8R.
Figure 8—source data 10. Source data for Figure 8S.
Figure 8—source data 11. Source data for Figure 8T.

Figure 8.

Figure 8—figure supplement 1. KDM6B and transcription factors are involved in regulating Trp53.

Figure 8—figure supplement 1.

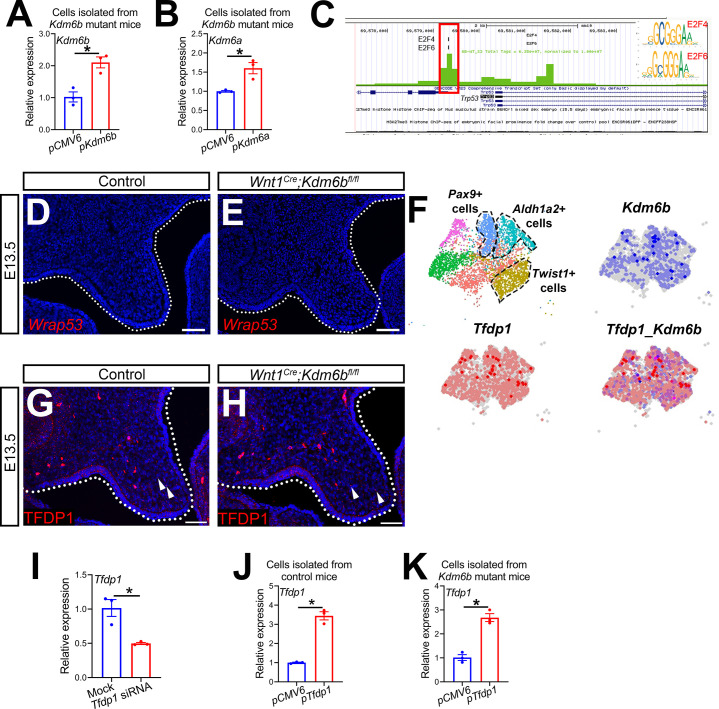
(A, B) RT-qPCR analysis of Kdm6a and Kdm6b expression in palatal mesenchymal cells isolated from Wnt1Cre;Kdm6bfl/fl mice after transfection with Kdm6a- or Kdm6b- overexpressing plasmids. *p<0.05. (C) ATAC-seq analysis suggests that the promoter of Trp53 is accessible to transcription factors E2F4 and E2F6. (D, E) Expression of Wrap53 in the palatal region at E13.5 using RNAscope in situ hybridization. Dotted lines in (D, E) indicate palatal shelf. Scale bar: 50 µm. (F) Co-expression of Kdm6b and Tfdp1 in the palate region at E13.5 using published scRNA-seq analysis (GEO: GSE155928). (G, H) Immunostaining of TFDP1 in the palatal region of control and Kdm6b mutant mice. Arrows indicate representative TFDP1+ cells. Scale bar: 50 µm. (I) RT-qPCR analysis of Tfdp1 expression in cells isolated from the palatal region of control mice 3 days after transfection with Tfdp1 siRNA. *p<0.05. (J, K) RT-qPCR analysis of Tfdp1 expression in palatal mesenchymal cells isolated from control and Kdm6b mutant mice after transfection with Tfdp1-overexpressing plasmid. (J) represents the result using cells isolated from control mice, and (K) represents the result using cells isolated from Wnt1Cre;Kdm6bfl/fl mice. *p<0.05.
Figure 8—figure supplement 1—source data 1. Source data for Figure 8—figure supplement 1A.
Figure 8—figure supplement 1—source data 2. Source data for Figure 8—figure supplement 1B.
Figure 8—figure supplement 1—source data 3. Source data for Figure 8—figure supplement 1I.
Figure 8—figure supplement 1—source data 4. Source data for Figure 8—figure supplement 1J.
Figure 8—figure supplement 1—source data 5. Source data for Figure 8—figure supplement 1K.