Abstract
Attention-deficit/hyperactivity disorder (ADHD) is a prevalent neurodevelopmental disorder in children, usually categorized as three predominant subtypes, persistent inattention (ADHD-I), hyperactivity-impulsivity (ADHD-HI) and a combination of both (ADHD-C). Identifying reliable features to distinguish different subtypes is significant for clinical individualized treatment. In this work, we conducted a two-stage electroencephalogram (EEG) microstate analysis on 54 healthy controls and 107 ADHD children, including 54 ADHD-Is and 53 ADHD-Cs, aiming to examine the dynamic temporal alterations in ADHDs compared to healthy controls (HCs), as well as different EEG signatures between ADHD subtypes. Results demonstrated that the dynamics of resting-state EEG microstates, particularly centering on salience (state C) and frontal-parietal network (state D), were significantly aberrant in ADHDs. Specifically, the occurrence and coverage of state C were decreased in ADHDs (p=0.002; p=0.0015), while the duration and contribution of state D were observably increased (p=0.0016; p=0.0001) compared to HCs. Moreover, the transition probability between state A and C was significantly decreased (p=9.85e-7; p=2.33e-7) in ADHDs, but otherwise increased between state B and D (p=1.02e-7; p=1.07e-6). By contrast, remarkable subtype differences were found primarily on the visual network (state B) between ADHD-Is and ADHD-Cs. Specifically, ADHD-Cs have higher occurrence and coverage of state B than ADHD-Is (p=9.35e-5; p=1.51e-8), suggesting these patients more impulsively aimed to open their eyes when asked to keep eyes closed during the data collection. In summary, this work carefully leveraged EEG temporal dynamics to investigate the aberrant microstate features in ADHDs and provided a new window to look into the subtle differences between ADHD subtypes, which may help to assist precision diagnosis in future.
Clinical Relevance—
This work established the use of EEG microstate features to investigate ADHD dysfunction and its subtypes, providing a new window for better diagnosis of ADHD.
I. Introduction
Attention-deficit/hyperactivity disorder (ADHD) is a common neurodevelopmental disorder characterized by age-inappropriate inattention, hyperactivity, and impulsivity, with an estimated prevalence about 5-6% in children [1]. According to the different clinical symptoms via DSM-IV, ADHD can be categorized as persistent inattention (ADHD-I), predominant hyperactivity-impulsivity (ADHD-H) and a combination of both (ADHD-C).
Children with ADHD showed multimodal structural and functional impairments in default mode network [2], salient network [3] and frontal-parietal network [2], as well as disrupt connectivity among the triple-network model of pathophysiology [4, 5]. Compared to magnetic resonance imaging (MRI) studies, electroencephalogram (EEG) is readily accessible and inexpensive, which measures electrical activity with millisecond temporal resolution produced by cortical neurons [6]. Most studies of continuous EEG data have adopted frequency transformation, which allows to measure brain states varying over seconds [7]. The most robust EEG features associated with ADHD are elevated power of slow waves and decreased power of fast wave, which are sometimes combined and quantified by the theta/beta ratio (TBR) [8]. Compared to healthy controls, ADHD-C subtype is featured with markedly increased TBR with a global decrease in beta power, while ADHD-I subtype presents increased TBR with a widespread increase in theta power [9]. However, some recent studies have failed to replicate the TBR differences between ADHDs and non-ADHDs [10]. Thus, researchers still struggle to identify stable and sensitive biomarkers for ADHDs and subtypes as well.
In parallel, microstates are global patterns of scalp potential topographies that remain quasi-stable for around 60-120ms before turning to another quasi-stable map, which may be considered to reflect global functional states [11]. Koening et al. presented four-states normative microstate maps for resting-state EEG data obtained from a database of 496 subjects between 6 and 80 years old [11], which are highly reproducible and widely used in various pioneering work [12, 13]. Britz et al. extended to explore the relationship between the EEG-defined microstates and the fMRI-defined resting states, which indicated that the typical four EEG topographies were spatially correlated with four of the resting-state networks located in bilateral superior and middle temporal gyri, bilateral inferior occipital, salience network and frontal-parietal network [14]. Microstates have been widely used in schizophrenia studies [13, 15]. however, to our knowledge, no study to date has used microstates to investigate abnormal temporal dynamics on ADHDs, as well as their subtypes in children.
The objectives of the present study were adopting EEG microstates to 1) uncover the distinct temporal dynamics between all ADHDs and HCs and 2) investigate unique temporal variations for each subtype. To achieve these goals, we conducted a two-level (group and subtype) EEG microstates analysis on 161 subjects and compared group differences for each microstate parameter through a variety of statistical methods.
II. Materials and methods
A. Participants
A total of 161 participants, 8-15 years of age, were recruited in the study (123 males, 38 females). The children with ADHD (n=107) were enrolled from the clinics of Peking University Sixth Hospital. 54 healthy controls (HC) matched for sex and age were recruited from communities in Beijing. All the subjects were interviewed and underwent diagnosis to ADHD using DSM-IV criterion by a qualified psychiatrist. Kiddie Schedule for Affective Disorders and Schizophrenia for School-Age Children (K-SADS) was used to confirm the diagnosis of ADHDs and the subtypes. Considering the small sample size of hyperactivity subtype, only inattentive subtype (ADHD-I: n=54) and combined subtype (ADHD-C: n=53) were included in the present study. To exclude the potential effects of medication on the results, all patients were drug-naïve or stopped taking drugs for >1 week. All participants met the following criteria: (a) no history of head trauma with a loss of consciousness, neurological illness or other severe disease, and (b) no current diagnosis of schizophrenia, severe emotional disorder, or pervasive developmental disorders and (c) a full-scale IQ above 80. Written informed consents were obtained from all children and their parents. Moreover, no significant group differences were observed in terms of gender (X2(1) = 0.729, p =0.393) and age (t = −1.357, p = 0.176) between ADHDs and HCs. The ADHD-C subtypes also matched well with ADHD-I subtypes in gender (X2(1) = 0.343, p =0.558) and age (t = −0.05, p = 0.957). This study was approved by the Medical Ethics Committee of Peking University Sixth Hospital/Institute of Mental Health.
B. Data acquisition and preprocessing
EEG data was recorded by EGI-128 HydroCel Geodesic Sensor Net (Electrical Geodesics, Inc., Eugene, OR), with Cz as the online reference, 0.01–400 Hz bandpass filter and 1000 Hz sampling rate. Participants were instructed to maintain a steady state with closed eyes for 6 minutes. The electrodes impedance was kept below 50 kΩ during the data acquisition.
Offline EEG processing were conducted using EEGLAB toolbox(https://sccn.ucsd.edu/eeglab/index.php). Thirty-eight lateral electrodes were excluded because of their susceptibility to movement interference. The resampling frequency was 250 Hz, and the bandpass filter band was 1–45 Hz. The signals were then re-referenced to the average reference. Electrodes containing excessive artifacts were manually checked and interpolated. The time series were subsequently inspected and rejected before an independent component analysis (ICA) decomposition. The components related to vertical and horizontal eye movements were visually inspected and removed. The trimmed data were segmented into contiguous 2-s windows and any segments with voltages exceeding ± 100 μV were rejected, free of artifacts data were concatenated and the first 2 minutes were extracted for following analysis.
C. Computing microstates features
The microstate analysis was performed using an Matlab plugin for the EEGlab toolbox (http://www.thomaskoenig.ch/index.php/software/microstates-in-eeglab/). Global field power (GFP) of the preprocessed resting-state EEG data was first computed at each time point for each subject. GFP is a measure of potential variance across the set of electrodes at a given time point as defined below:
| (1) |
where, i is the electrode, n represents the number of electrodes, V represents measured voltage, t is the time point.
Since scalp topographies remain quasi-stable around GFP peaks and present the highest signal-to-noise ratio, only EEG maps at the peaks were used for the subsequent clustering analysis. K-means clustering was then conducted on the peak GFP data to identify the most dominant topographies as microstates [13]. To further compare and interpret our results with previous studies, we assembled to select the number of clusters as four and labeled them A-D according to their similarities to Koening et al.’s four-states normative microstate [16]. The final maps were then quantified using global explained variance (GEV), which measures how well the spatial maps could explain the variance of the whole data. To reduce the influence of randomly selected initial template maps, we repeated the clustering procedure for hundreds of times and selected the microstates with the highest GEV [17].
The clustering analysis was first conducted at the individual level and then across subjects in each group. For cross-group comparison, we subsequent computed mean microstate topographies cross different groups and reoriented each group-level map according to these group-mean topographies. The group-level spatial maps were further served as a reference map to back fitting for each subject, where topographies at each time point were spatially correlated with each group-level map and labeled based on the most correlated map. At last, four microstate parameters for each subject were calculated: mean duration, time coverage, occurrence and transition probabilities [18]. The mean duration (in ms) is the average length of time a given microstate remains stable when it appears (yielding 4 features). The frequency of occurrence is the average number of times per second that the microstate becomes dominant during the whole recording time (yielding 4 features). The coverage (in %) is the percentage of the total recording period that the microstate is dominant (yielding 4 features). The transition probability quantifies the transformation from one state to another state (yielding 12 features). Altogether, a total of 24 features were achieved for subsequent analysis.
D. Two-level statistical analysis
To investigate whether the computed microstate parameters reflect variations between ADHDs and HCs, as well as between different ADHD subtypes, we divided the analysis into two parts. At the first stage, we conducted group-level clustering analysis across all the ADHD patients and heathy controls, followed by calculating microstates parameters for each group. A two-way ANOVA with group and microstates as factors was then performed for each of the four computed microstate parameters to identify the significant discriminate microstate features, followed by two-sample t-tests between ADHDs and HCs for each significant microstate feature. At the second stage, group-level clustering was conducted respectively for ADHD-Cs and ADHD-Is subtype. We adopted the new topographies for back fitting and computed microstates parameters for each subtype participant. Then, we compared the group difference between ADHD-Cs and ADHD-Is for each of the computed microstate parameters using ANOVA and two sample t-test. Note that pairwise group comparison for all microstate parameters in each stage were corrected for multiple comparisons with Bonferroni-correction with p<0.05/24.
III. Results
A. Microstates between ADHDs and HCs
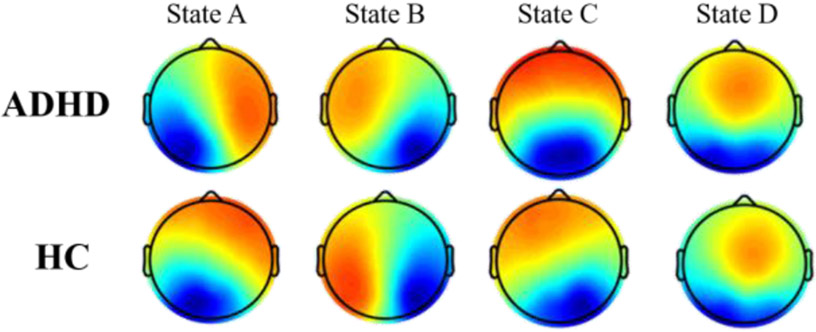
The four microstates for patients and controls are presented in Fig. 1. In both groups, the four microstate maps consistently resembled those identified in the previous literature[11]: State A and state B with diagonal axis orientations of the topographic map filed, state C with anterior-posterior orientation and state D with a front-central location. The four microstates across participants explained 80.67% and 80.89% of the global variance in the patients and controls respectively. The subsequent Kruskal-Wallis test showed non-significant group difference between ADHDs and HCs for each topography maps (p(A)=0.99, p(B)=0.98. p(C)=0.93, p(D)=0.99).
Figure 1. The spatial maps of the four microstates for ADHD patients and controls.
Red color indicates positive values and blue color represents negative values.
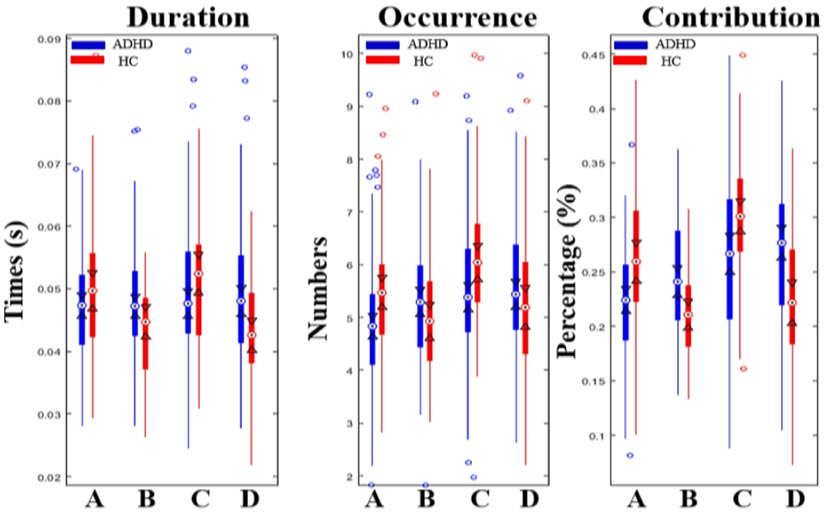
Based on the identified four microstates, we computed four parameters for each subject: mean duration, time coverage, frequency of occurrence and transition probabilities. Two-way ANOVA analysis show significant microstate × group interaction effects for mean duration (F=8.54, p=1.56e-5), time of coverage (F=13.86, p=1.10e-8), occurrence (F=11.78, p<1e-12) and transition probabilities (F=12.07, p<1e-12). Post-hoc pairwise comparisons based on the two variance-equal groups revealed that the occurrence and coverage of state A (p=0.005: p=3.39e-5) and state C (p=0.002: p=0.0015) were markedly decreased in ADHDs, while the duration and contribution of state B (p=0.003: p=0.0002) and state D (p=0.0016; p=0.0001) were significantly increased in ADHDs compared to controls (Fig. 2, Table 1). These results are in keeping with the triple-network model of pathophysiology associated with ADHD [4], including aberrant salience-processing (state C) and fronto-parietal network (state D). Moreover, the transition probability between state A and state C (p=9.85e-7; p=2.33e-7) was significantly decreased in patients, whereas increased between state B and D (p=1.02e-7: p=1.07e-6) in patients with ADHD compared to healthy controls.
Figure 2. Results of the microstate analysis for ADHDs vs HCs.
Table 1.
Two sample t-test for each feature between ADHDs and HCs
| Parameters | p value | TP | p value |
|---|---|---|---|
| D (A) | 0.07 | A→B | 0.85 |
| D (B) | 2.93E-03 | A→C | 9.85E-07 * |
| D (C) | 0.59 | A→D | 0.71 |
| D (D) | 1.57E-03 * | B→A | 0.97 |
| O (A) | 5.46E-03 * | B→C | 0.34 |
| O (B) | 0.31 | B→D | 1.02E-07 * |
| O (C) | 2.75E-03 | C→A | 2.33E-07 * |
| O (D) | 0.12 | C→B | 0.52 |
| C (A) | 3.39E-05 * | C→D | 0.95 |
| C (B) | 2.07E-04 * | D→A | 0.42 |
| C (C) | 1.46E-03 * | D→B | 1.07E-6 * |
| C (D) | 1.26E-04 * | D→C | 0.96 |
Note: D = Duration, O = Occurrence, C = Contribution, TP = Transition probability
represents the p value was Bonferroni corrected with p<0.05/24.
B. Microstate patterns for ADHD-Cs and ADHD-Is
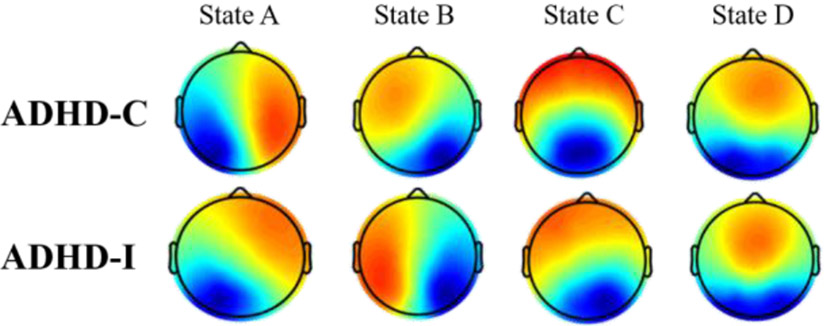
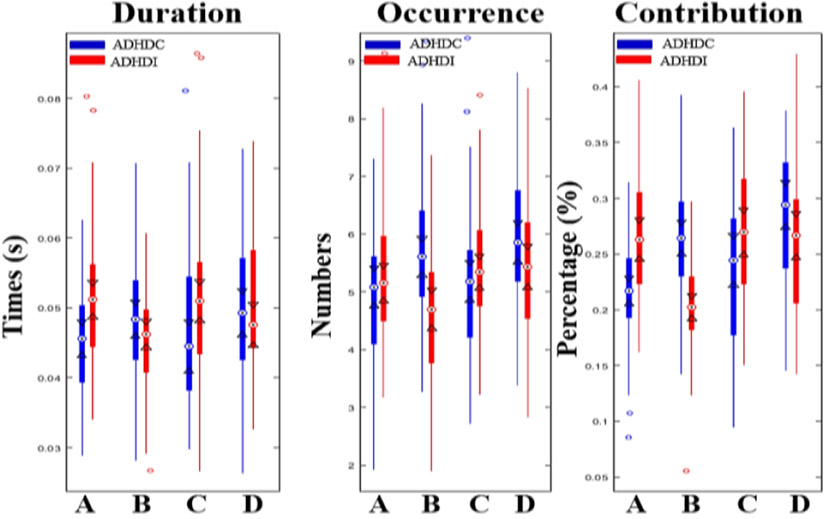
The four microstates for ADHD-Cs and ADHD-Is are shown in Fig. 3. In both sub-groups, the four microstate maps also resembled previously identified ones[11]. The four microstates across participants explained 80.06% and 80.31% of the global variance for ADHD-Cs and ADHD-Is. The subsequent Kruskal-Wallis test showed non-significant group difference between two subtypes for each topography maps (p(A)=0.99, p(B)=0.95, p(C)=0.95, p(D)=0.99). Two-way ANOVA analysis based on the calculated four microstate parameters demonstrated significant microstate × group interaction effects for mean duration (F=4.24, p=0.0059), time of coverage (F=8.77, p=1.32e-5), occurrence (F=6.47, p=0.0003) and transition probabilities (F=8.2, p<1e-12). Not surprisingly, we found no significant differences in the general properties of microstates C and D between the two variance-equal subtypes (Fig. 4, Table 2), as the common inattention characteristic featured by salience and fronto-parietal network disruption is shared between two subtypes. Instead, the occurrence and coverage of state B (associated with visual network) were remarkably increased in ADHD-Cs, while the duration and contribution of state A (associated with temporal network) were observably decreased in ADHD-Cs compared to ADHD-Is. Furthermore, the transition probability between state A and state C (p=9.25e-8; p=1.78e-8) was evidently decreased in ADHD-Cs, whereas increased from state B to state D (p=9.86e-9; p=2.54e-7) in patients with ADHD-Cs compared to ADHD-Is.
Figure 3. The spatial maps of the four microstates for ADHD-Cs and ADHD-Is.
Red color indicates positive values and blue color represents negative values.
Figure 4. Results of the microstate analysis for ADHD-Cs vs ADHD-Is.
Table 2.
Two sample t-test for each feature between two subtypes
| Parameters | p value | TP | p value |
|---|---|---|---|
| D (A) | 3.89E-04 * | A→B | 0.27 |
| D (B) | 0.03 | A→C | 9.25E-08* |
| D (C) | 0.07 | A→D | 0.15 |
| D (D) | 0.79 | B→A | 0.19 |
| O (A) | 0.24 | B→C | 0.25 |
| O (B) | 9.35E-05 * | B→D | 9.86E-09 * |
| O (C) | 0.25 | C→A | 1.78E-08 * |
| O (D) | 0.06 | C→B | 0.08 |
| C (A) | 1.70E-05 * | C→D | 0.07 |
| C (B) | 1.51E-08 * | D→A | 0.14 |
| C (C) | 0.01 | D→B | 2.54E-07 * |
| C (D) | 0.18 | D→C | 0.12 |
Note: D = Duration, O = Occurrence, C = Contribution, TP = Transition probability
represents the p value was Bonferroni corrected.
IV. Conclusion
Results from this study suggest that the temporal dynamics of resting-state EEG microstates, particularly state C and D, centering on salience network and a frontal-parietal network, show promise as potential biomarkers for ADHD. While the ADHD-C is more activated on state B (visual network) compared to ADHD-I. This study highlights EEG microstate features potentially as a sensitive measurement to detect the disruptions for ADHD and the subtypes, which may be an interesting direction to develop machine learning models based on these features in the future.
Acknowledgments
This work was supported by the National Natural Sciences Foundation of China (L.S., 81971284, 81771479; J.S., 82022035, 61773380; N.L., 82001450), China Postdoctoral Science Foundation (N.L., BX20200364); the National Institute of Health (R01MH117107, R01EB005846) and Beijing Municipal Science and Technology Commission (No. Z181100001518005).
Contributor Information
Na Luo, Brainnetome Center and National Laboratory of Pattern Recognition, Institute of Automation, Chinese Academy of Sciences and University of Chinese Academy of Sciences, Beijing 100190, China..
Xiangsheng Luo, Peking University Sixth Hospital & Peking University Institute of Mental Health, China; NHC Key Laboratory of Mental Health (Peking University) & National Clinical Research Center for Mental Disorders (Peking University Sixth Hospital), Beijing, China.
Dongren Yao, Department of Otolaryngology–Head and Neck Surgery, Massachusetts Eye and Ear Infirmary, Boston, MA 02114, USA; Department of Otolaryngology–Head and Neck Surgery, Harvard Medical School, Boston, MA 02114, USA.
Vince D. Calhoun, tri-institutional center for TRanslational Research in Neuroimaging and Data Science (TReNDS): Georgia State University, Georgia Institute of Technology, and Emory University, Atlanta, GA 30303, USA..
Li Sun, Peking University Sixth Hospital & Peking University Institute of Mental Health, China; NHC Key Laboratory of Mental Health (Peking University) & National Clinical Research Center for Mental Disorders (Peking University Sixth Hospital), Beijing, China.
Jing Sui, State Key Laboratory of Cognitive Neuroscience and Learning, Beijing Normal University, Beijing 100875, China; tri-institutional center for TRanslational Research in Neuroimaging and Data Science (TReNDS): Georgia State University, Georgia Institute of Technology, and Emory University, Atlanta, GA 30303, USA..
References
- [1].Asherson P, Buitelaar J, Faraone SV, and Rohde LA, "Adult attention-deficit hyperactivity disorder: key conceptual issues," Lancet Psychiatry, vol. 3, no. 6, pp. 568–78, Jun 2016. [DOI] [PubMed] [Google Scholar]
- [2].Guo X et al. , "Shared and distinct resting functional connectivity in children and adults with attention-deficit/hyperactivity disorder," Transl Psychiatry, vol. 10, no. 1, p. 65, Feb 12 2020. [DOI] [PMC free article] [PubMed] [Google Scholar]
- [3].Norman LJ et al. , "Structural and Functional Brain Abnormalities in Attention-Deficit/Hyperactivity Disorder and Obsessive-Compulsive Disorder: A Comparative Meta-analysis," JAMA Psychiatry, vol. 73, no. 8, pp. 815–825, Aug 1 2016. [DOI] [PubMed] [Google Scholar]
- [4].Gao Y et al. , "Impairments of large-scale functional networks in attention-deficit/hyperactivity disorder:a meta-analysis of resting-state functional connectivity," Psychol Med, vol. 49, no. 15, pp. 2475–2485. Nov 2019. [DOI] [PubMed] [Google Scholar]
- [5].Li F et al. , "Intrinsic brain abnormalities in attention deficit hyperactivity disorder: a resting-state functional MR imaging study," Radiology, vol. 272, no. 2, pp. 514–23, Aug 2014. [DOI] [PubMed] [Google Scholar]
- [6].Lenartowicz A and Loo SK, "Use of EEG to diagnose ADHD," (in eng), Curr Psychiatry Rep, vol. 16, no. 11, p. 498, Nov 2014. [DOI] [PMC free article] [PubMed] [Google Scholar]
- [7].Lenartowicz A and Loo SK, "Use of EEG to Diagnose ADHD," (in English), Current Psychiatry Reports, vol. 16, no. 11, Nov 2014. [DOI] [PMC free article] [PubMed] [Google Scholar]
- [8].Barry RJ, Clarke AR, and Johnstone SJ, "A review of electrophysiology in attention-deficit/hyperactivity disorder: I. Qualitative and quantitative electroencephalography," Clin Neurophysiol, vol. 114, no. 2, pp. 171–83, Feb 2003. [DOI] [PubMed] [Google Scholar]
- [9].Ahmadi M et al. , "Cortical source analysis of resting state EEG data in children with attention deficit hyperactivity disorder," Clin Neurophysiol, vol. 131, no. 9, pp. 2115–2130, Sep 2020. [DOI] [PubMed] [Google Scholar]
- [10].Arns M, Conners CK, and Kraemer HC, "A decade of EEG Theta/Beta Ratio Research in ADHD: a meta-analysis," J Atten Disord, vol. 17, no. 5, pp. 374–83, Jul 2013. [DOI] [PubMed] [Google Scholar]
- [11].Koenig T et al. , "Millisecond by millisecond, year by year: normative EEG microstates and developmental stages," Neuroimage, vol. 16, no. 1, pp. 41–8, May 2002. [DOI] [PubMed] [Google Scholar]
- [12].Murphy M, Stickgold R, and Ongur D, "Electroencephalogram Microstate Abnormalities in Early-Course Psychosis," Biol Psychiatry Cogn Neurosci Neuroimaging, vol. 5, no. 1, pp. 35–44, Jan 2020. [DOI] [PMC free article] [PubMed] [Google Scholar]
- [13].da Craz JR et al. , "EEG microstates are a candidate endophenotype for schizophrenia," Nat Commun, vol. 11, no. 1, p. 3089, Jun 18 2020. [DOI] [PMC free article] [PubMed] [Google Scholar]
- [14].Britz J, Van De Ville D, and Michel CM, "BOLD correlates of EEG topography reveal rapid resting-state network dynamics," Neuroimage, vol. 52, no. 4, pp. 1162–70, Oct 1 2010. [DOI] [PubMed] [Google Scholar]
- [15].Rieger K, Diaz Hernandez L, Baenninger A, and Koenig T, "15 Years of Microstate Research in Schizophrenia - Where Are We? A Meta-Analysis," (in eng), Frontiers in psychiatry, vol. 7, pp. 22–22. 2016. [DOI] [PMC free article] [PubMed] [Google Scholar]
- [16].Michel CM and Koenig T, "EEG microstates as a tool for studying the temporal dynamics of whole-brain neuronal networks: A review," (in English), Neuroimage, vol. 180, pp. 577–593, Oct 15 2018. [DOI] [PubMed] [Google Scholar]
- [17].Baradits M, Bitter I, and Czobor P, "Multivariate patterns of EEG microstate parameters and their role in the discrimination of patients with schizophrenia from healthy controls," (in English), Psychiatry Research, vol. 288, Jun 2020. [DOI] [PubMed] [Google Scholar]
- [18].Khanna A, Pascual-Leone A, Michel CM, and Farzan F, "Microstates in resting-state EEG: current status and future directions," Neurosci Biobehav Rev, vol. 49, pp. 105–13, Feb 2015. [DOI] [PMC free article] [PubMed] [Google Scholar]


