

SUMMARY
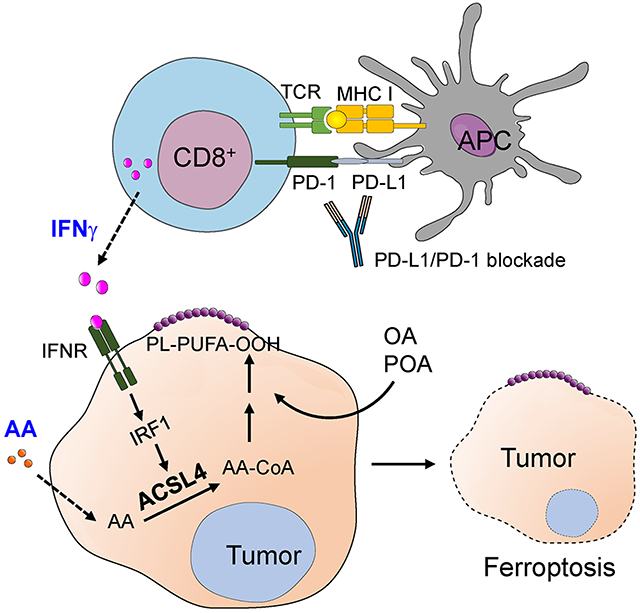
Tumor cell intrinsic ferroptosis initiating mechanisms are unknown. Here, we discover T cell-derived interferon (IFN)γ in combination with arachidonic acid (AA) induces immunogenic tumor ferroptosis, serving as a mode of action for CD8+ T cell (CTL)-mediated tumor killing. Mechanistically, IFNγ stimulates ACSL4 and alters tumor cell lipid pattern, thereby increasing incorporations of AA into C16 and C18 acyl chain-containing phospholipids. Palmitoleic acid and oleic acid, two common C16 and C18 fatty acids in blood, promote ACSL4-dependent tumor ferroptosis induced by IFNγ plus AA. Moreover, tumor ACSL4 deficiency accelerates tumor progression. Low-dose AA enhances tumor ferroptosis and elevates spontaneous and immune checkpoint blockade (ICB)-induced anti-tumor immunity. Clinically, tumor ACSL4 correlates with T cell signatures and improved survival in ICB-treated cancer patients. Thus, IFNγ signaling paired with selective fatty acids is a natural tumor ferroptosis promoting mechanism and a mode of action of CTLs. Targeting ACSL4 pathway is a potential anti-cancer approach.
Keywords: ACSL4, arachidonic acid, interferon, oleic acid, palmitoleic acid, ferroptosis, lipid peroxidation, T cell, immunotherapy, checkpoint, PD-L1, immunity, cancer
Graphical Abstract
In brief:
Liao et al. demonstrate IFNγ from cytotoxic T lymphocytes (CTLs) and arachidonic acid from the tumor microenvironment naturally induce tumor cell ferroptosis, which is mediated via ACSL4-dependent lipid reprogramming. Targeting the ACSL4 pathway is a potential anti-cancer approach.
INTRODUCTION
Ferroptosis was discovered studying the cytotoxic effects of small synthetic molecules, such as Erastin and RSL3, in cultured tumor cells in vitro (Dixon and Stockwell, 2019). These small molecules artificially induce ferroptosis by targeting cystine uptake, glutathione (GSH) synthesis, iron loading, glutathione peroxidase-4 (GPX4) activity, and ferroptosis suppressor-protein-1 (FSP1) (Doll et al., 2019) (Bersuker et al., 2019). Interestingly, accumulating evidence indicates ferroptosis may be implicated in a variety of pathological scenarios - including acute kidney injury, tissue ischemia and reperfusion injury, neurodegeneration, and cancer. However, natural ferroptosis inducing mechanisms in these conditions remain unknown.
Immune checkpoint blockade (ICB)-activated CD8+ T cells in the tumor microenvironment can sensitize tumor cell ferroptosis. The combination of a synthetic ferroptosis inducer and PD-L1 blockade synergistically enhances the anti-tumor efficacy in preclinical models (Lang et al., 2019; Wang et al., 2019). Moreover, T cell-derived IFNγ sensitizes tumor cell ferroptosis induced by Erastin or RSL3 in the in vitro culture system (Wang et al., 2019). However, IFNγ alone failed to directly initiate and induce tumor cell ferroptosis in vitro (Wang et al., 2019). Whether and how tumor cells can undergo endogenous ferroptosis in the absence of synthetic chemical inducers remains elusive. Ferroptosis is regulated by fatty acid metabolism (Kagan et al., 2017) (Hassannia et al., 2019; Magtanong et al., 2019). Fatty acids consist of short-chain fatty acids (SCFA), medium-chain fatty acids (MCFA), long-chain fatty acids (LCFA), and very-long-chain fatty acids (VLCFA). Moreover, fatty acids include saturated and unsaturated (monounsaturated and polyunsaturated) species. Here, we have screened and tested ferroptotic potential of different fatty acids in combination with IFNγ on in vitro cultured tumor cells. We have also enlisted a multidisciplinary approach utilizing targeted lipidomics analysis and multiple tumor models, to explore the crosstalk between the immune system (such as CD8+ T cells and IFNγ) and lipid metabolism (such as different fatty acids) in the context of tumor ferroptosis in the tumor microenvironment, and its relevance in cancer immunity and therapy.
RESULTS
Arachidonic acid and IFNγ coordinately induce tumor cell ferroptosis
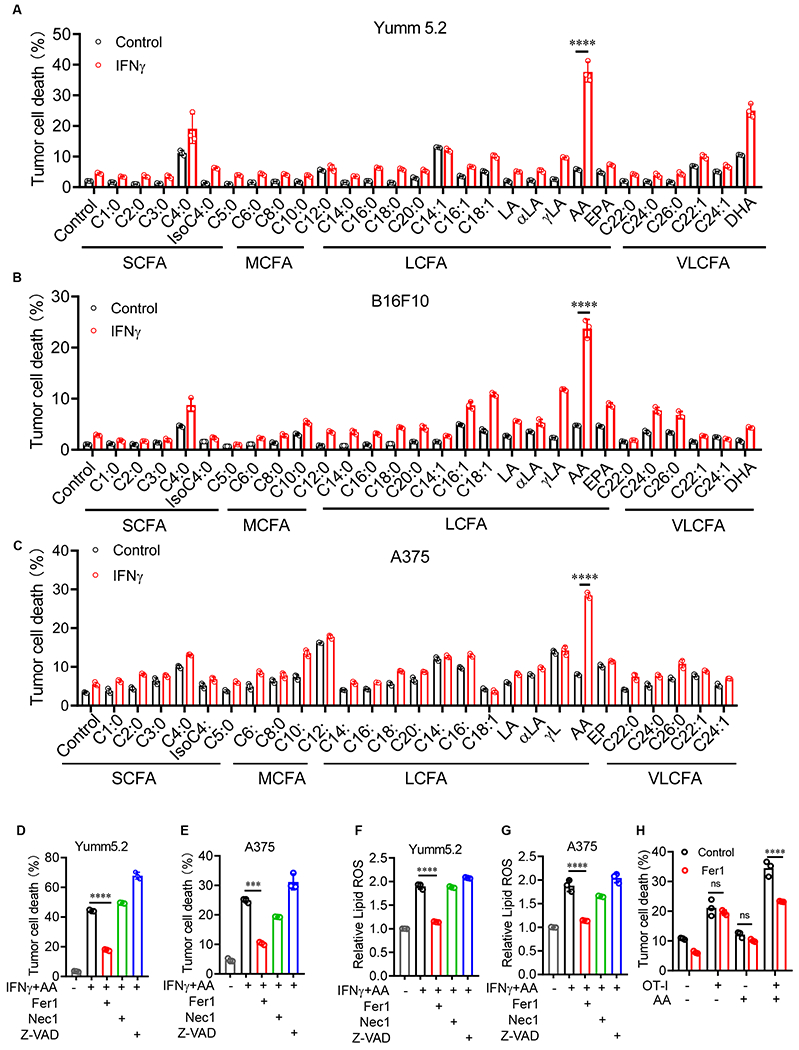
We hypothesized that IFNγ could cooperate with selective fatty acids to induce tumor cell ferroptosis without synthetic inducers. To test this hypothesis, we screened and tested ferroptotic potential of all typical fatty acids (Table S1) in inducing both mouse and human tumor cell death with or without IFNγ (Psychogios et al., 2011). As expected, IFNγ or individual fatty acids alone failed to induce cell death in two murine melanoma lines, Yumm5.2 and B16F10, and a human melanoma line. A375 (Figure 1A–1C). Interestingly, arachidonic acid, but not other fatty acids, synergized with IFNγto induce potent cell death in all 3 tumor cell lines (Figure 1A–1C). Thereafter, we focused our studies on arachidonic acid. Physiological levels of arachidonic acid are approximately 13 μM in peripheral blood (Zabielski et al., 2014). We treated Yumm5.2 cells with IFNγ in the presence of different concentrations of arachidonic acid, starting with 10 μM. We found that arachidonic acid promoted tumor lipid reactive oxygen species (ROS) production and cell death in a dose- (Figure S1A–1B) and time- (Figure S1C–1D) dependent manner.
Figure 1.
Arachidonic acid (AA) and IFNγ coordinately induce tumor cell ferroptosis
(A-C) Percentage of dead Yumm5.2 (A), B16F10 (B), and A375 (C) cells that were treated with IFNγ and common fatty acids for 3 days (n = 3), Table S1.
(D and E) Percentage of dead Yumm5.2 (D) and A375 (E) cells treated with IFNγ and AA in the presence of ferrostatin-1 (Fer1; 2 μM), Necostatin-1 (Nec1; 1μM), or z-VAD-FMK (z-VAD; 10 μM) for 3 days. 10 (D) and 50 (E) ng/mL IFNγ, and 20 (D) and 30 (E) μM AA (n = 3).
(F and G) Lipid ROS in Yumm5.2 (F) and A375 (G) cells treated with IFNγ and AA in the presence of ferrostatin-1 (Fer1; 2 μM) for 3 days. 10 (F) and 50 (G) ng/mL IFNγ, and 20 (F) and 30 (G) μM AA (n=3).
(H) Percentage of dead OVA-pulsed Yumm5.2 cells in co-cultures with OT-I cells (tumor: OT-I ratio of 1:2) in the presence of AA (20 μM) and (Fer1; 2 μM) for 48 hours (n = 3).
Data are shown as mean ± s.d., two-way ANOVA (A-C and H) or one-way ANOVA (D-G). ***P < 0.001, ****P < 0.0001, and ns, not significant.
To determine if the combination of IFNγ and arachidonic acid induces tumor cell death via ferroptosis, we treated Yumm5.2 cells and A375 cells with IFNγ and arachidonic acid in the presence of different cell death inhibitors - including ferrostatin-1 (Fer1), a specific ferroptosis inhibitor; necrostatin-1 (Nec1), a necrosis inhibitor; and Z-VAD-fmk (Z-VAD), an apoptosis inhibitor. The combination of IFNγ and arachidonic acid induced Yumm5.2 and A375 cell death, and Fer1, but not other inhibitors, rescued both Yumm5.2 and A375 cell death (Figure 1D and 1E). Furthermore, the combination of IFNγ and arachidonic acid increased lipid ROS in Yumm5.2 (Figure 1F) and A375 (Figure 1G) cells, which was also reversed by Fer1 (Figure 1F and 1G). Thus, the combination of IFNγ and arachidonic acid causes tumor cell death via inducing tumor ferroptosis in the absence of synthetic ferroptosis inducer. Tumor antigen specific CD8+ T cells promote tumor cell ferroptosis via IFNγ (Wang et al., 2019). We tested if arachidonic acid altered tumor killing mediated by antigen specific CD8+ T cells. We cultured ovalbumin expressing (OVA+)-Yumm5.2 cells with OVA-specific CD8+ T (OT-I) cells in the presence of arachidonic acid. We observed that supplementation of arachidonic acid increased OT-I-mediated tumor cell death, which could be rescued by Fer1 (Figure 1H). Thus, arachidonic acid and CD8+ T cells (or IFNγ) can coordinately induce tumor cell ferroptosis.
Arachidonic acid and IFNγ induce tumor cell ferroptosis via ACSL4
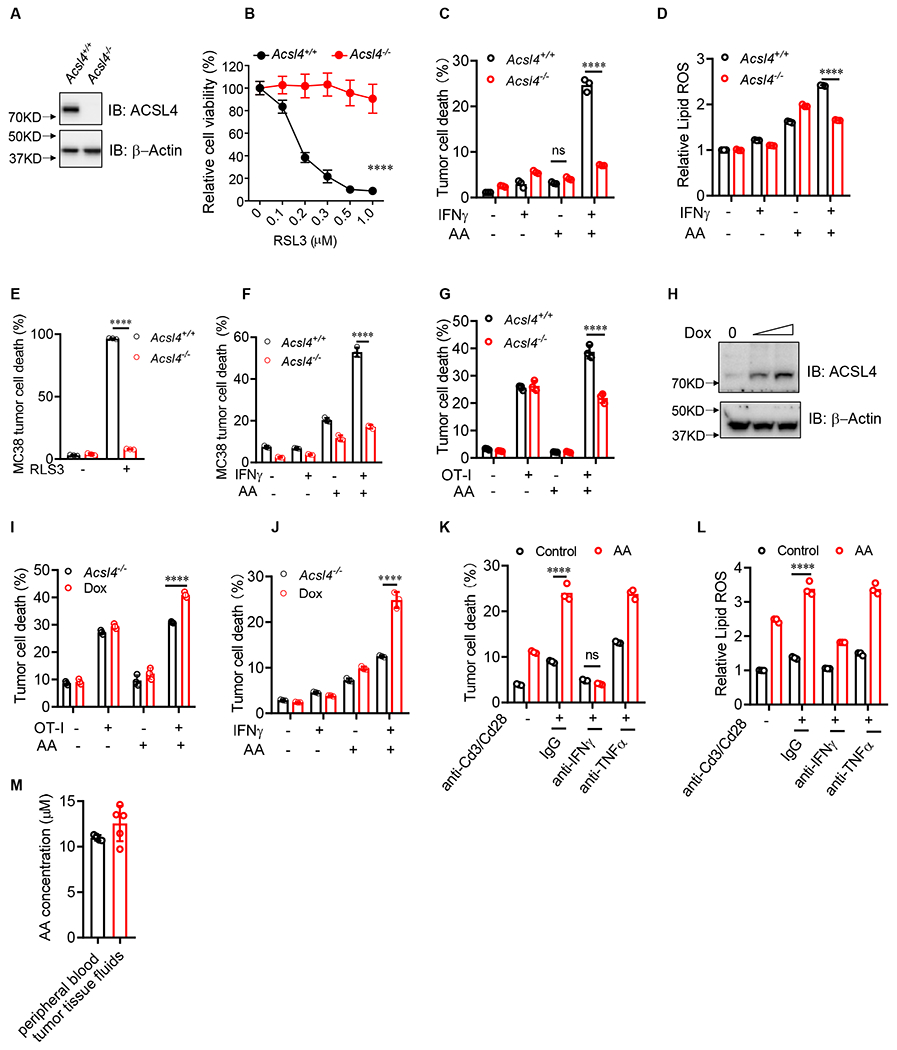
We next explored the mechanism by which IFNγ plus arachidonic acid induce tumor cell ferroptosis. Acyl-CoA synthetase long-chain family member 4 (ACSL4) activates arachidonic acid to arachidonyl-CoA, which is esterified into phospholipids. Exogenous arachidonic acid enhances RSL3-induced ferroptosis (Doll et al., 2017). In line with a previous report (Kagan et al., 2017), arachidonic acid alone failed to directly trigger tumor cell ferroptosis (Figure 1A–1C). We questioned if ACSL4 is a critical enzyme for arachidonic acid plus IFNγ to induce tumor cell ferroptosis. We generated Acsl4 deficient (Acsl4−/−) Yumm5.2 cells (Figure 2A). As expected, Acsl4−/− Yumm5.2 cells were resistant to RSL3, a synthetic ferroptosis inducer, compared with wild-type (Acsl4+/+) cells (Figure 2B). Acsl4 deficiency abolished Yumm5.2 tumor cell death (Figure 2C) and lipid ROS production (Figure 2D) induced by the combination of IFNγ and arachidonic acid. In addition, we treated Yumm5.2 cells with Rosiglitazone, an enzymatic inhibitor of ACSL4 (Kim et al., 2001). We found that Rosiglitazone prevented Yumm5.2 tumor cell death induced by IFNγ and arachidonic acid in a dose dependent manner (Figure S2A). We extended our study to MC38 colon tumor cells. Similarly, Acsl4−/− MC38 cells were resistant to ferroptosis induced by RSL3 (Figure 2E) and the combination of IFNγ plus arachidonic acid (Figure 2F) as compared to Acsl4+/+ MC38 cells. Furthermore, in the co-culture of OVA+-Yumm5.2 cells and OT-I cells, supplementation of arachidonic acid enhanced Acsl4+/+ tumor cell death, but not Acsl4−/− tumor cell death (Figure 2G). To demonstrate tumor incorporation of arachidonic acid, we detected intracellular arachidonic acid in tumor cells when exogeneous arachidonic acid was provided in the in vitro culture (Figure S2B). We next performed an Acsl4 rescue experiment. Considering that constitutively forced ACSL4 expression might directly affect tumor cell death, we used a doxycycline (Dox)-inducible system to mediate ACSL4 re-expression in ACSl4−/− Yumm5.2 cells (Figure 2H). We observed that forced ACSL4 expression sensitized tumor cell death induced by OT-I cells in the presence of arachidonic acid (Figure 2I), and by the combination of IFNγ plus arachidonic acid (Figure 2J). Furthermore, supplementation of arachidonic acid enhanced tumor cell killing (Figure 2K) and lipid ROS production (Figure 2L) induced by activated CD8+ T-cells. These effects were abolished by anti-IFNγ monoclonal antibody (mAb), but not by anti-TNFα mAb (Figure 2K and 2L). Arachidonic acid can be obtained from diet or from an essential fatty acid linoleic acid by desaturation and chain elongation. We detected arachidonic acid in peripheral blood and tumor tissues in Yumm5.2 tumor-bearing mice (Figure 2M). IFNγ is often produced by activated T cells and NK cells. Hence, simultaneous presence of arachidonic acid and IFNγ could be a natural condition and mechanism capable of inducing tumor cell ferroptosis in the tumor microenvironment.
Figure 2.
Arachidonic acid and IFNγ induce tumor cell ferroptosis via ACSL4
(A) Immunoblots of ACSL4 in Acsl4+/+ or Acsl4−/− Yumm5.2 cells.
(B) Relative cell viability of Acsl4+/+ or Acsl4−/− Yumm5.2 cells treated with different concentrations of RSL3 for 24 hours (n = 3).
(C and D) Percentage of dead cells (C) or relative lipid ROS (D) in Acsl4+/+ or Acsl4−/− Yumm5.2 cells treated with IFNγ and AA for 3 days (n = 3).
(E) Percentage of dead Acsl4+/+ or Acsl4−/− MC38 cells treated with RSL3 for 24 hours (n = 3).
(F) Percentage of dead cells in Acsl4+/+ or Acsl4−/− MC38 cells treated with IFNγ and AA for 3 days (n = 3).
(G) Percentage of dead OVA+ Acsl4+/+ or Acsl4−/− Yumm5.2 cells cultured with OT-I cells (tumor: OT-I ratio of 1:2) in the presence of AA for 48 hours (n = 3).
(H) Immunoblots of Acsl4 in inducible Acsl4 expression in Acsl4−/− Yumm5.2 cells transfected with Tet-On inducible ACSL4 expression plasmids. Cells were treated with or without Dox (0.2 or 0.5 μg/ml).
(I) Percentage of dead OVA+ in Acsl4−/− Yumm5.2 cells cultured with OT-I cells in the presence of AA for 48 hours. Yumm5.2 cells were pretreated with or without doxycycline (0.2 μg/ml) for 2 days to induce ACSL4 expression (n = 3).
(J) Percentage of dead Yumm5.2 cells treated with IFNγ and AA for 3 days. Yumm5.2 cells were pretreated with or without doxycycline (1 μg/ml) for 2 days to induce Acsl4 expression (n = 3).
(K and L) Percentage of dead cells (K) or relative lipid ROS (L) in Acsl4+/+ or Acsl4−/− Yumm5.2 cells treated with supernatant from activated CD8+ T cells in the presence of anti-IFNγ or anti-TNFα blocking mAbs for 3 days (n = 3).
(M) AA levels in peripheral blood or Yumm5.2 tumor tissues of tumor-bearing mice measured by ELISA (n = 4- 5).
Data are shown as mean ± s.d., two-way ANOVA (B-G and I-L). ****P < 0.0001, and ns, significant. Immunoblots, one of three experiments is shown
See also Figure S2.
Given that system Xc− and IFNγ regulate cell ferroptosis (Dixon and Stockwell, 2019; Wang et al., 2019), we wondered if system Xc− was involved in tumor ferroptosis induced by IFNγ plus arachidonic acid. To this end, we examined Yumm5.2 cell ferroptosis induced by Erastin or IFNγ plus arachidonic acid in the presence of cysteine. Erastin inhibited system Xc−, leading to cystine starvation, glutathione depletion, and consequently ferroptotic cell death. As expected, addition of cysteine bypassed system Xc− and blocked Erastin-induced tumor ferroptosis (Figure S2C). However, addition of cysteine failed to alter tumor ferroptosis induced by IFNγ plus arachidonic acid (Figure S2D). These results provide additional evidence that ACSL4, not system Xc−, is critical for tumor ferroptosis induced by IFNγ plus arachidonic acid. Altogether, our results reveal that activated T cell-derived IFNγ paired with arachidonic acid in the tumor microenvironment can induce tumor cell ferroptosis via ACSL4.
IFNγ stimulates ACSL4 expression via STAT1 and IRF1 signaling
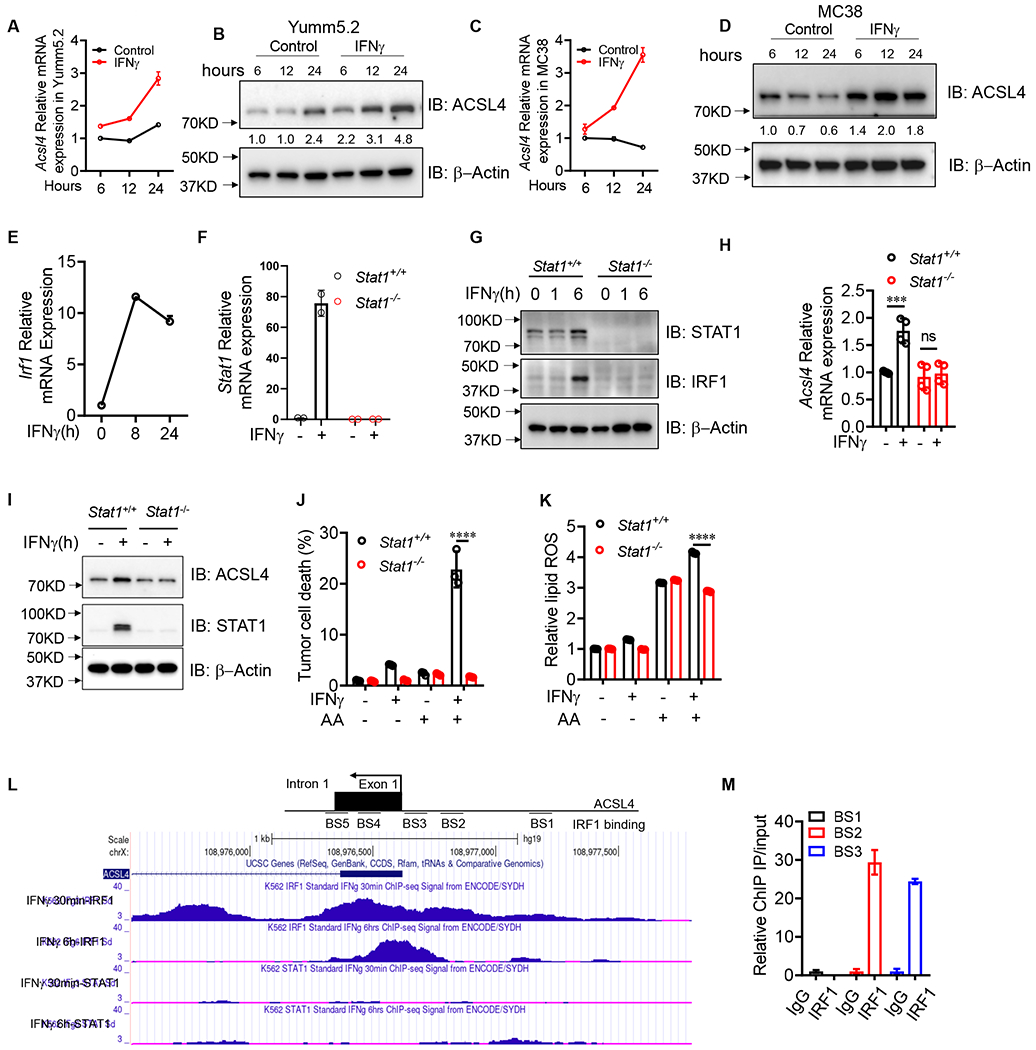
Given the necessity of ACSL4 in tumor ferroptosis induced by the combination of arachidonic acid and IFNγ, we hypothesized that IFNγ regulates ACSL4 expression in tumor cells. To test this hypothesis, we cultured Yumm5.2 cells with IFNγ at different time points. IFNγ treatment enhanced Acsl4 expression in Yumm5.2 and MC38 cells at both mRNA and protein levels (Figure 3A–3D). As positive controls, IFNγ treatment stimulated expression of IFNγ responsive genes, such as interferon regulatory factor 1 (IRF1) (Figure 3E). IFNγ signaling regulates gene expression through Janus kinase (JAK)- signal transducer and activator of transcription 1 (STAT1) pathway. Using CRISPR-Cas9 technology, we established Stat1 deficient (Stat1−/−) Yumm5.2 cells. As expected, IFNγ treatment failed to stimulate Stat1 transcript (Figure 3F), and STAT1 and IRF1 protein expression (Figure 3G) in Stat1−/− Yumm5.2 cells as compared to wild-type cells. IFNγ treatment failed to facilitate Acsl4 expression in Stat1−/− Yumm5.2 cells as compared to wild-type cells at both mRNA and protein levels (Figure 3H and 3I). Interestingly, IFNγ plus arachidonic acid failed to induce Stat1−/− tumor cell ferroptosis (Figure 3J) and lipid ROS production (Figure 3K) as compared to wild-type cells. Upon JAK/STAT1 activation via IFNγ, IRF1 binds to IFN-stimulated response element (ISRE), thereby initiating the transcription of IFNγ responsive genes. ENCODE chromatin immunoprecipitation (ChIP)-seq database suggests the existence of the binding sites for IRF1 at the promotor region of Acsl4, but not for STAT1 (Figure 3L) (Consortium, 2012). Further analysis revealed 5 potential IRF1 binding sites (BS1-5) in the promoter region of Acsl4 (Figure 3L). ChIP assay identified BS2 and BS3 as the major IRF1 binding sites in the putative promoter of Acsl4 in A375 cells (Figure 3M). Altogether, these results suggest that Acsl4 is a previously unknown IFNγ-responsive gene, and STAT1 activation is essential for Acsl4 expression and tumor cell ferroptosis induced by arachidonic acid plus IFNγ.
Figure 3.
IFNγ stimulates ACSL4 expression via STAT1 and IRF1 signaling
(A and B) Acsl4 transcripts (A) and proteins (B) in Yumm5.2 cells treated by IFNγ at indicated times (n=2-3).
(C and D) Acsl4 transcripts (C) and proteins (D) in MC38 cells treated by IFNγ at different times (n =2-3).
(E) Irf1 transcripts in Yumm5.2 cells treated with IFNγ at different times (n =2).
(F) Stat1 transcripts in Stat1+/+ or Stat1−/− Yumm5.2 cells treated with IFNγ for 24 hours (n =2).
(G) Immunoblots of STAT1 and IRF1 in Stat1+/+ or Stat1−/− Yumm5.2 cells treated with IFNγ at different times.
(H and I) Acsl4 transcripts (H) and proteins (I) in Stat1+/+ or Stat1−/− Yumm5.2 cells treated by IFNγ for 24 hours (n = 3-4).
(J and K) Percentage of dead cells (J) and relative lipid ROS (K) in Stat1+/+ or Stat1−/− Yumm5.2 cells treated with IFNγ and AA for 3 days (n = 3).
(L) IRF1 ChIP-seq data from ENCODE shows the IRF1 binding sites at the ACSL4 promoter region.
(M) ChIP of IRF1 in A375 cells treated with or without IFNγ. IRF1 binding to ACSL4 TSS region was quantified by qPCR. Results are expressed as fold change in the specific site occupancy over control (n = 2).
Data are shown as mean ± s.d., two-way ANOVA (H, J and K). ***P < 0.001, ****P < 0.0001, and ns, not significant. Immunoblots, one of three experiments is shown.
IFNγ reprograms ACSL4 associated phospholipids to induce tumor ferroptosis
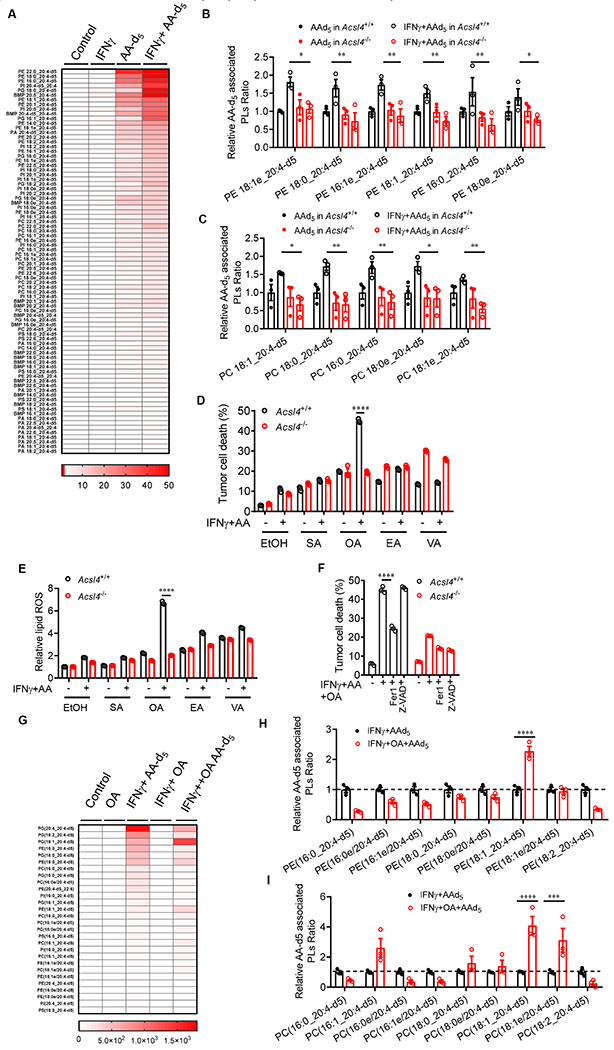
Cellular lipid composition and fatty acid metabolism control ferroptosis (Dixon and Stockwell, 2019; Kraft et al., 2020; Zou et al., 2020). Apart from ACSL4 expression, we wondered if IFNγ in combination with arachidonic acid altered tumor cell lipids. Interestingly, targeted phospholipid analysis in Acsl4+/+ and Acsl4−/− Yumm5.2 cells treated with IFNγ, deuterated arachidonic acid-d5 (AA-d5), and their combination demonstrated distinct lipid clusters in different experimental conditions (Figure S3A). Arachidonic acid or IFNγ slightly changed the relative abundance of different phospholipid species in Acsl4+/+ Yumm5.2 cells (Figure 4A). Treatment with arachidonic acid-d5 plus IFNγ increased the total arachidonic acid-associated phospholipid species in Acsl4+/+ Yumm5.2 cells as compared to Acsl4−/− Yumm5.2 cells (Figure S3B). Interestingly, when we compared the impact of arachidonic acid-d5 on different phospholipid species, we found that arachidonic acid was preferentially integrated into C16 and C18 acyl chain-containing phospholipids in ACSL4-dependent manner (Figure S3C). Arachidonic acid-d5 was preferentially integrated into phosphatidylethanolamine (PE) and phosphatidylcholine (PC) species - particularly in C16:0, C16:1, C18:0, and C18:1 species (Figure 4B and 4C). This effect was amplified by IFNγ (Figure 4B and 4C). Altogether, the data indicate that IFNγ alters ACSL4 expression and lipids to induce tumor ferroptosis.
Figure 4.
IFNγ reprograms ACSL4 associated phospholipids to induce tumor ferroptosis
(A-C) Effect of IFNγ plus AA-d5 on tumor phospholipids. Yumm5.2 cells treated with IFNγ(10 ng/ml), AA-d5 (10μM), and their combination for 48 hours. Lipids were analyzed by ultra-performance liquid chromatography–tandem mass spectrometry (UPLC-MS/MS). Heatmap shows phospholipid fold-changes in Yumm5.2 cells (A). Phosphatidylethanolamine (PE), phosphatidylcholine (PC), phosphatidylglycerol (PG), phosphatidylserine (PS), phosphatidylinositol (PI), phosphatidic acid (PA) and Bis (monoacylglycero) phosphate (BMP), “e” represents ether phospholipid. The relative changes of different phospholipids (A), PE (B), and PC (C) that contain C16 and C18 acyl chain are shown (n = 3).
(D and E) Percentage of dead cells (D) or relative lipid ROS (E) in Acsl4+/+ or Acsl4−/− Yumm5.2 cells treated with IFNγ and low dose AA (10 μM) for 48 hours in the presence of stearic acid (SA, 20 μM), oleic acid (OA, 60 μM), elaidic acid (EA, 60 μM), and trans-vaccenic acid (VA, 60 μM) (n = 3).
(F) Percentage of dead cells in Acsl4+/+ or Acsl4−/− Yumm5.2 cells treated with IFNγ, AA (10 μM), and OA (60 μM) in the presence of Fer1 or z-VAD for 48 hours (n = 3).
(G-I) Effect of IFNγ plus AA-d5 and OA on tumor phospholipids. Yumm5.2 cells treated with OA (60 μM), IFNγ (10ng/ml) + AA-d5 (10μM), IFNγ + OA or their combination for 48 hours. Lipids were analyzed by UPLS-MS/MS. Heatmap shows phospholipid fold-changes in Yumm5.2 cells (G). The relative changes of different phospholipids (G), and PE (H), and PC (I) of C16 and C18 acyl chain-containing phospholipids are shown in Yumm5.2 cells (n = 3).
Data are shown as mean ± s.e.m.(A-C and G-I), mean ± s.d.(D-F), two-way ANOVA (B-F, H and L). *P < 0.05, **P < 0.01, ***P < 0.001, and ****P < 0.0001.
Given that arachidonic acid-d5 was preferentially integrated into C16- and C18- acyl chain-containing phospholipids and IFNγ synergized with this integration, we posit that certain C16 and C18 fatty acids could participate in tumor ferroptosis induced by the combination of IFNγ and arachidonic acid. To explore this possibility, we turned our attention to the common C16- and C18-fatty acids in human peripheral blood. Blood C16 fatty acids include 16:0 (palmitic acid, PA) and 16:1. C16:1 isomers consist mainly of palmitoleic acid (POA), palmitelaidic acid (PEA), and sapienic acid (SAA) (Psychogios et al., 2011; Sommerfeld, 1983) (Table S2). To test a potential role of common C16-fatty acids in tumor cell ferroptosis, we cultured Acsl4+/+ and Acsl4−/− Yumm5.2 cells with these fatty acids in the presence of IFNγ and low-dose arachidonic acid. We observed that POA, but not other C16-fatty acids, enhanced tumor cell lipid ROS production in Acsl4+/+ tumor cells as compared to Acsl4−/− tumor cells (Figure S3D). As expected, POA induced cell death in Acsl4+/+ Yumm5.2 cells, but not in Acsl4−/− Yumm5.2 cells (Figure S3E). In addition, Fer1, but not Z-VAD, abolished the effect of POA on Acsl4+/+ Yumm5.2 cell death (Figure S3E). Common C18:0 and C18:1 fatty acids in peripheral blood include C18:0 (stearic acid, SA) and C18:1 isomers, which mainly consist of oleic acid (OA), elaidicacid (EA), and vaccenic acid (VA)(Psychogios et al., 2011; Sommerfeld, 1983) (Table S2). We performed similar experiments to test a potential role of common C18-fatty acids in tumor cell ferroptosis. We found that OA, but not other C18-fatty acids, enhanced tumor cell death (Figure 4D) and lipid ROS production (Figure 4E) in Acsl4+/+ tumor cells as compared to Acsl4−/− tumor cells. Furthermore, the effect of OA on tumor cell death was reversed by Fer1, but not by Z-VAD (Figure 4F). The data indicate that OA promotes tumor cell ferroptosis initiated by IFNγ plus arachidonic acid. However, it has been reported (Magtanong et al., 2019; Yang et al., 2016b) and we confirmed that OA inhibited Erastin-induced ferroptosis in vitro (Figure S3F). The results suggest a context dependent role of OA in tumor cell ferroptosis. To further determine this possibility, we examined if OA or OA plus IFNγ could induce tumor cell ferroptosis in the absence of arachidonic acid. We found that OA or OA plus IFNγ had no obvious effect on Yumm5.2 cell death (Figure S3G). Then, we performed a target lipidomic assay in Yumm5.2 cells treated with IFNγ plus arachidonic acid-d5 in the presence or absence of OA. The PCA analysis demonstrated distinct lipid clusters in different conditions (Figure S3H). We tracked how OA affected the composition of arachidonic acid acyl chain-containing phospholipids, specifically analyzing arachidonic acid-d5 incorporated phospholipids (Figure 4G). We found that OA resulted in an increase in 18:1_20:4-d5 phospholipids in the major lipid species of PE (Figure 4H) and PC (Figure 4I). The data suggest that IFNγ reprograms ACSL4 associated phospholipids to induce tumor ferroptosis, and the common C16- and C18-fatty acids, such as POA and OA, can participate in this process.
Tumor ACSL4 affects anti-tumor immunity
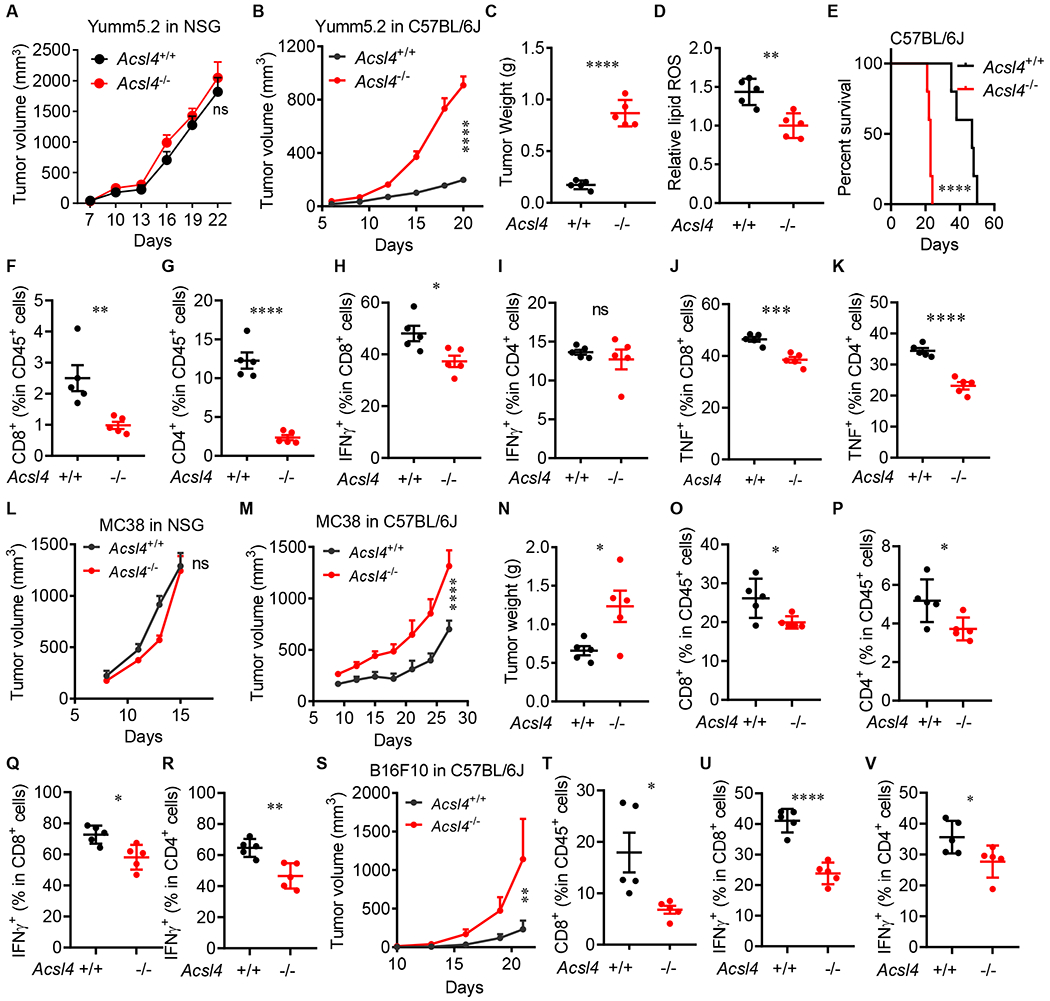
The combination of arachidonic acid and IFNγ is an endogenous trigger for tumor cell ferroptosis via ACSL4. This mechanism may participate in CD8+ T cell-mediated tumor killing. As Acsl4−/− tumor cells are relatively resistant to ferroptotic cell death compared to Acsl4+/+ tumor cells, we hypothesized that Acsl4−/− and Acsl4+/+ tumor cells manifested different T cell responses in vivo due to their differences in ferroptotic death and potential tumor antigen release and spread. To test this hypothesis, we inoculated Acsl4−/− and Acsl4+/+ Yumm5.2 cells into NOD.SCID γc-deficient (NSG) (immune deficient) mice and C57BL/6J (immune competent) mice. Acsl4−/− and Acsl4+/+ Yumm5.2 tumors comparably progressed in NSG mice (Figure 5A), were similarly proliferative in vitro (Figure S4A), and equally sensitive to cisplatin-induced apoptosis (Figure S4B). However, Acsl4−/− tumors grew faster and larger in C57BL/6J (immunocompetent) mice as shown by tumor volume (Figure 5B) and tumor weight (Figure 5C) when compared to Acsl4+/+ tumors. Acsl4−/− tumors expressed lower levels of lipid ROS than Acsl4+/+ tumors in vivo (Figure 5D). Mice bearing Acsl4−/− tumors experienced a shorter survival than their counterparts (Figure 5E), and harbored reduced amounts of CD8+ and CD4+ T cells (Figure S4C; Figure 5F and 5G), and IFNγ+ and TNFα+CD8+ and CD4+ T cells in the tumor microenvironment (Figure 5H–5K). We extended our studies to MC38 colon tumor model. We inoculated Acsl4−/− and Acsl4+/+ MC38 cells in NSG (Figure 5L) and C57/BL6 mice (Figure 5M). Like Yumm5.2 tumor model, Acsl4−/− and Acsl4+/+ MC38 tumors grew similarly in NSG mice (Figure 5L), but Acsl4−/− MC38 tumors rapidly progressed in the immunocompetent C57BL/6J mice compared to Acsl4+/+ MC38 tumors as shown by tumor volume (Figure 5M) and tumor weight (Figure 5N). Again, Acsl4−/− MC38 tumors harbored lower amount of CD8+ and CD4+ T cells (Figure 5O and 5P), and IFNγ+CD8+ and CD4+ T cells (Figure 3Q and 3R), when compared to Acsl4+/+ MC38 tumors. We additionally generated Acsl4−/− B16F10 cells. Acsl4−/− B16F10 cells were resistant to RSL3 induced cell death (Figure S4D), but sensitive to cisplatin-induced apoptosis (Figure S4E). Acsl4+/+ and Acsl4−/− B16F10 cells had similar proliferation ability in vitro (Figure S4F). However, Acsl4−/− B16F10 tumors rapidly progressed in C57BL/6J mice as compared to Acsl4+/+ B16F10 tumors (Figure 5S), and harbored lower amount of CD8+T cells (Figure 5T), and IFNγ+CD8+ and CD4+ T cells (Figure 5U and 5V). These results demonstrate that tumor ACSL4 deficiency weakens anti-tumor T cell responses.
Figure 5.
Tumor ACSL4 affects anti-tumor immunity
(A and B) Growth of Acsl4+/+ or Acsl4−/− Yumm5.2 tumors in NSG mice (A) or C57BL/6 mice (B) (n = 5).
(C) Tumor weights of Acsl4+/+ or Acsl4−/− Yumm5.2 tumors in C57BL/6 mice (n = 5).
(D) Relative lipid ROS in Acsl4+/+ or Acsl4−/− Yumm5.2 tumors in C57BL/6 mice (n = 5).
(E) Overall survival of C57BL/6 mice bearing Acsl4+/+ or Acsl4−/− Yumm5.2 tumors (n = 5).
(F and G) Percentages of CD8+ (F) and CD4+ (G) T cells in CD45+ cells of Yumm5.2 tumors (n = 5).
(H-K) Percentages of IFNγ+ (H and I) and TNFα+ (J and K) in CD8+ and CD4+ T cells of Yumm5.2 tumors (n =5).
(L and M) Growth of Acsl4+/+ or Acsl4−/− MC38 tumors in NSG mice (L) or C57BL/6 mice (n = 5-7).
(N) Tumor weights of Acsl4+/+ or Acsl4−/− MC38 tumors in C57BL/6 mice (n = 5).
(O and P) Percentages of CD8+ (O) and CD4+ (P) T cells in CD45+ cells of MC38 tumors (n = 5).
(Q and R) Percentages of IFNγ+ CD8+ (Q) and IFNγ+ CD4+ (R) T cells of MC38 tumors (n = 5).
(S) Growth of Acsl4+/+ or Acsl4−/− B16F10 tumors in C57BL/6 mice (n = 5).
(T) Percentages of CD8+ T cells in CD45+ cells of B16F10 tumors (n = 5).
(U and V) Percentages of IFNγ+ CD8+ (U) and IFNγ+ CD4+ (V) T cells of B16F10 tumors (n =5).
Data are shown as mean ± s.e.m. (A-C and G-I), two-way ANOVA (A, B, L, M and S), two-tailed t-test (C, D, F-K, N-R and T-V) or Log-rank test (E), *P < 0.05, **P < 0.01, ***P < 0.001, ****P < 0.0001, and ns, not significant.
See also Figure S4.
To explore if tumor ACSL4 status differentially and directly altered T cell function, we activated T cells in the presence of Acsl4+/+ and Acsl4 −/− tumor cells in vitro and detected comparable T cell IL-2 and granzyme B in the two groups (Figure S4G and S4H). In addition, tumor ACSL4 might differentially and indirectly alter T cell function via prostaglandin E2 (PGE2). Indeed, ACSL4 plays a controversial role in PGE2 production in different types of cells (Golej et al., 2011; Kuwata et al., 2019; Reeves et al., 2021). It is well known that PGE2 negatively affects anti-tumor immune responses and inhibition of cyclooxygenases (COX) 2 can sensitize ICB in tumor bearing animal models (Bottcher et al., 2018; Li et al., 2016; Zelenay et al., 2015). To determine if PGE2 is critically involved in the different immune responses in the tumor microenvironment in mice bearing Acsl4−/− and Acsl4+/+ Yumm5.2 cells, we measured PGE2 in Acsl4−/− and Acsl4+/+ Yumm5.2 tumor tissues and detected comparable levels of PGE2 in these two groups (Figure S4I). Altogether, these results suggest that tumor ACSL4 affects spontaneous anti-tumor immunity in vivo via control of tumor ferroptosis.
Targeting tumor ferroptosis sensitizes checkpoint therapy
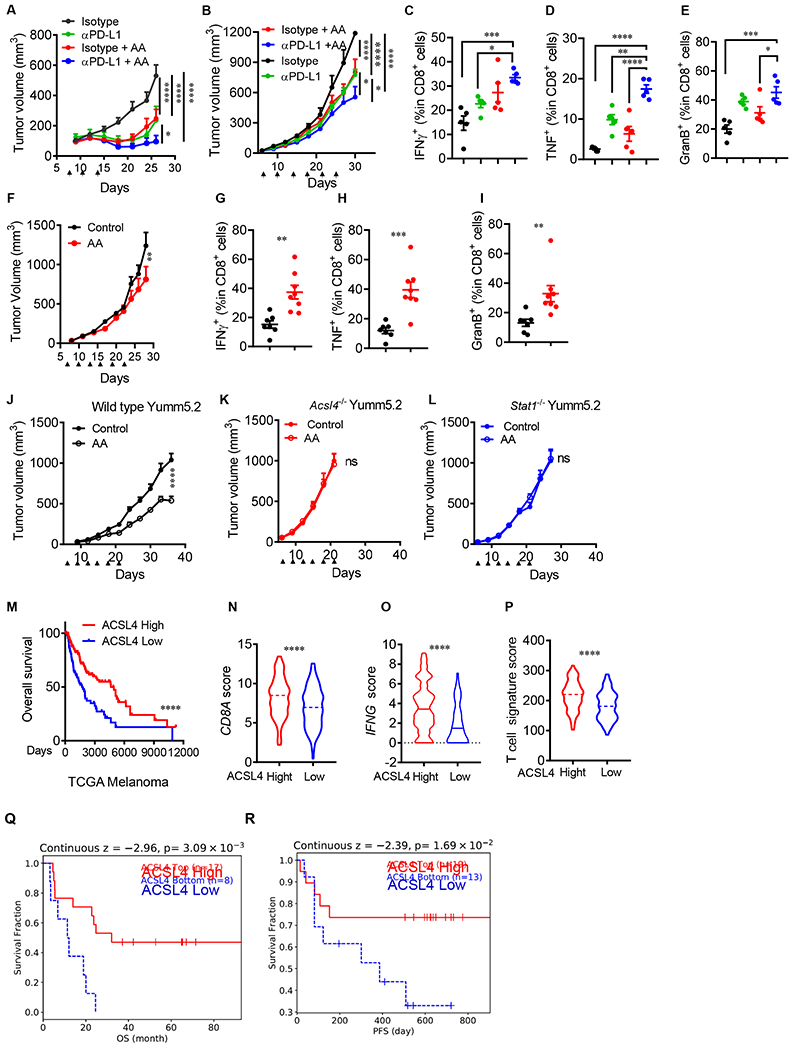
IFNγ signaling plays a central role in spontaneous- and immune checkpoint blockade-induced immunity (Ayers et al., 2017; Farrar and Schreiber, 1993). Given that arachidonic acid plus IFNγ induced tumor cell ferroptosis (Figure 1A–1C), we hypothesized that arachidonic acid supplementation as a substrate for ACSL4 may induce tumor cell ferroptosis in vivo, inhibit tumor progression, and synergize the anti-tumor effect of PD-L1 blockade in immune competent mice. To test this hypothesis, we treated mice bearing 3 types of tumors, including MC38, Yumm5.2, and Lewis lung carcinoma (LLC) with low-dose arachidonic acid. These tumors manifest high to low sensitivity to immune checkpoint therapy (Lin et al., 2018). Similar to anti-PD-L1 therapy, arachidonic acid alone slowed down MC38 tumor growth, and the combination of arachidonic acid and anti-PD-L1 yielded additional tumor inhibition (Figure 6A). We conducted similar experiments in Yumm5.2 tumor bearing mice. Again, treatment with arachidonic acid and anti-PD-L1 comparably reduced tumor growth, and their combination therapy resulted in a superior tumor suppression when compared to single treatment (Figure 6B). Administration of arachidonic acid led to increased levels of arachidonic acid in tumor tissues (Figure S5A). In line with this, the combination therapy increased the percentages of IFNγ+, TNFα+, and granzyme B+CD8+ T cells in the tumor microenvironment (Figure 6C–6E). Furthermore, we treated mice bearing LLC tumors, a checkpoint therapy resistant tumor line (Lin et al., 2018). Interestingly, treatment with arachidonic acid also yielded anti-tumor efficacy (Figure 6F), accompanied with an increase in IFNγ+, TNFα+, and granzyme B+CD8+ T cells in the tumor microenvironment (Figure 6G–6I). Moreover, treatment with arachidonic acid failed to affect tumor growth in NSG mice bearing MC38 (Figure S5B), Yumm5.2 (Figure S5C), and LLC (Figure S5D) tumors. In addition to tumor cells, low-dose arachidonic acid may directly alter T cell survival, function, and lipid profile. To test this, we stimulated T cells in vitro in the presence of arachidonic acid. We found that arachidonic acid treatment had no effect on T cell death and function, as shown by 7-AAD and intracellular IL-2 and granzyme B staining, respectively (Figure S5E and S5F). Then, we treated Yumm5.2 tumor bearing mice with low dose arachidonic acid and isolated T cells for functional test and lipidomic assay. In line with the in vitro data (Figure S5E and S5F), arachidonic acid treatment had no obvious effects on T cell death and expression of IL-2 and granzyme B (Figure S5G and S5H). Lipidomic assay demonstrated similar phospholipid patterns in T cells isolated from mice treated with or without arachidonic acid (Figure S5I–S5P). Thus, low-dose arachidonic acid targets tumors, promotes tumor immunity, and sensitizes therapeutic efficacy to checkpoint blockade.
Figure 6.
Targeting tumor ferroptosis sensitizes checkpoint therapy
(A) Effect of AA and anti-PD-L1 on MC38 tumor growth. Mice bearing subcutaneous MC38 tumors were treated isotype antibody, anti-PD-L1 antibody, AA, or anti-PD-L1 antibody plus AA (arrowhead). Tumor volume is shown (n = 5).
(B-E) Effects of AA and anti-PD-L on Yumm5.2 tumor growth and immune responses. Yumm5.2 tumor-bearing mice were treated with isotype antibody, anti-PD-L1 antibody, AA, or anti-PD-L1 plus AA (arrowhead). Tumor volume is shown (B). Percentages of tumor infiltrating IFNγ+ (C), TNFα+ (D), and granzyme B+ (E) CD8+ T cells were analyzed by FACS (n=5).
(F-I) Effects of AA administration on LLC tumor growth and immune responses. LLC tumor-bearing mice were treated with PBS, phosphate-buffered saline (Control), and AA (arrowhead). Tumor volume is shown (F). Percentages of tumor infiltrating IFNγ+ (G), TNFα+ (H), and granzyme B+ (I) CD8+ T cells were analyzed by FACS (n = 7-8).
(J-L) Effect of AA administration on tumor growth in vivo. Wild type (J), Acsl4−/−(K), and Stat1−/− (L) Yumm5.2 tumor-bearing mice were treated with PBS and AA (arrowhead). Tumor volume is shown (n=8-9).
(M) Kaplan-Meier survival curves for melanoma patients with Low (bottom 25%) or High (top 25%) melanoma ACSL4 transcripts in TCGA dataset.
(N-P) Correlation between ACSL4 transcripts and immune genes - including CD8A (N), IFNG (O), and T cell signature (P) in TCGA dataset in patients with melanoma expressing High (n = 120) or Low (n = 120) levels of ACSL4. Dotted lines: median.
(Q and R) Kaplan-Meier survival curves for melanoma patients having received adoptive T cell therapy (ACT) with High (n = 17) and Low (n = 8) levels of tumor ACSL4 transcripts (Lauss et al., 2017)(Q) or having received the combination of anti-PD-1 and anti-CTLA-4 with High (n = 19) and Low (n = 13) levels of tumor ACSL4 transcripts (Gide et al., 2019)(R).
Data are shown as mean ± s.e.m., two-way ANOVA (A, B, F and J-L), one-way ANOVA (C-E), two-tailed t-test (G-I and N-P) or Log-rank test (M, Q and R), *P< 0.05, **P < 0.01, ***P < 0.001, ****P < 0.0001, and ns, not significant.
See also Figures S5 and S6.
We next assessed if the anti-tumor effect mediated by arachidonic acid administration depended on tumor ACSL4 and IFNγ signal pathway. To this end, we treated mice bearing wild type, ACSl4−/− and Stat1−/− Yumm5.2 tumors with arachidonic acid. As expected, administration of arachidonic acid slowed down wild type tumor growth but had no effect on ACSl4−/− and Stat1−/− Yumm5.2 tumors as shown by tumor volume and tumor mass images (Figure 6J–6L and Figure S5Q–S5S). These results suggest that the therapeutic effect of arachidonic acid is ACSL4 and IFNγ signaling dependent.
Finally, we assessed the potential relevance of ACSL4 in human tumor immunity. We first compared transcript levels of ACSL4 between normal tissues and tumor tissues in patients with cancer. Using TIMER2.0 analysis, we found that ACSL4 expression levels were lower in multiple types of tumor tissues than normal tissues (Li et al., 2020) (Figure S6A). We next examined the relationship between Acsl4 expression, cancer patient outcome, and immune signatures. Based on gene-expression profiles of cancer patients from The Cancer Genome Atlas (TCGA) database and Kaplan-Meier survival analysis, we found that high Acsl4 expression was associated with improved overall survival in patients with melanoma (Figure 6M) and bladder cancer (Figure S6B). ACSL4 expression positively correlated with CD8A (Figure 6N and Figure S6C), IFNγ (Figure 6O and Figure S6D) and T-cell signature (Ayers et al., 2017) (Figure 6P and Figure S6E). Then, we employed Tumor Immune Dysfunction and Exclusion (TIDE) algorithm (Jiang et al., 2018) to assess the relationship between tumor ACSL4 expression and clinical response to immunotherapy (Gide et al., 2019; Lauss et al., 2017). We observed that high levels of ACSL4 expression were associated with increased overall survival or progression free survival in patients having received immunotherapy (Figure 6Q and 6R). The data suggests a potential involvement of ACSL4 in spontaneous and ICB-induced anti-tumor immunity in patients with cancer.
DISCUSSION
Ferroptosis inducers are synthetic molecules that decrease tumor growth (Dixon and Stockwell, 2019). It is not clear if activation of endogenous ferroptosis mechanisms restricts tumor progression and alters checkpoint therapy sensitivity. Here, we find that ACSL4 is the lynchpin that activates endogenous ferroptotic mechanisms through metabolic lipid reprogramming. Moreover, IFNγ in combination with arachidonic acid directly triggers ferroptosis in both human and mouse tumor cells and serves as a mode of action for CTL-tumor killing.
Arachidonic acid (20:4) is an omega-6, polyunsaturated fatty acid. We detect moderate levels of arachidonic acid in the tumor microenvironment. Arachidonic acid can enhance RSL3-induced ferroptosis in mouse embryonic fibroblasts in vitro. However, arachidonic acid alone fails to directly initiate ferroptosis (Kagan et al., 2017). Similar to arachidonic acid, IFNγ targets Xc− system and promotes synthetic molecule-induced ferroptosis in human and mouse tumor cell lines (Wang et al., 2019). However, IFNγ alone is unable to directly trigger ferroptosis (Wang et al., 2019). Unlike each alone, the combination of arachidonic acid and IFNγ directly triggers tumor cell ferroptosis. This natural tumor ferroptotic mechanism is conceptually similar to the fundamental findings that the combination of different cytokines (such as TGFβ plus IL-6) induces Th17 cells or Th22 cells (Cua et al., 2003; Mangan et al., 2006; Zheng et al., 2007), and the combination of TNFα and IFNγ induces PANoptosis as characterized by inflammatory cell death (Karki et al., 2021). Thus, our results will stimulate a bridge of interest in exploring if this mechanism is not only operative in tumor immunity, but also in autoimmunity and infection immunity. In addition, as IFNγ is often produced by activated effector T cells, anemic T cell infiltration and loss of IFNγ gene signaling can result in bypassing the aforementioned natural immune related tumor ferroptotic mechanism, leading to tumor progression. Hence, our data suggests that natural tumor ferroptosis deficiency may be a previously unrecognized feature of cold tumors.
Ferroptosis occurs when lipid hydroperoxide detoxification and accumulation is unbalanced (Dixon and Stockwell, 2019). Environmental stress may tip this balance in favor of lipid ROS accumulation, resulting in ferroptosis initiation (Wang et al., 2019). We posit that T cells function as an immune stress signal to tumor cells - thereby resulting in ferroptotic tumor cell death and subsequent tumor antigen release and T cell activation in the tumor microenvironment. In support of this notion, we demonstrate that crosstalk between the IFNγ and ACSL4 signaling pathways contributes to CTL-mediated tumor cell death via inducing ferroptosis. It is well known that CTLs kill targets via the perforin-granzyme-caspase-mediated apoptosis (Voskoboinik et al., 2015). Our results show that ACSL4-dependent ferroptosis is a previously unappreciated mode of action of CTLs. Thus, CTL-induced tumor apoptosis is no longer a soloist in this process. Given that cell apoptosis is generally considered an immune tolerogenic cell death (“type-2 cell death”), we suggest that tumor ferroptosis induced by the combination of IFNγ and arachidonic acid is the long-awaited form of immunogenic cell death (“type-1 cell death”). Our finding not only sheds light on CTL-killing mechanisms, but also raises the possibility of a potential interplay between two types of cell death - namely, ferroptosis and apoptosis.
Arachidonic acid is a conditionally essential polyunsaturated long-chain fatty acid (PUFAs) (Harizi et al., 2008; Tallima and El Ridi, 2018). ACSL4 preferentially uses PUFAs, including arachidonic acid, as substrates (Dixon et al., 2015; Doll et al., 2017). ACSL4 activates arachidonic acid by thioesterification with coenzyme A (CoA), generating arachidonyl-CoA - the first step reaction of arachidonic acid metabolism (Kagan et al., 2017). Lysophosphatidylcholine acyltransferase 3 (LPCAT3) and lipoxygenases (LOX) are involved in the incorporation of arachidonyl-CoAs into phospholipids on membranes and oxidation of these phospholipids, respectively (Conrad and Pratt, 2019; Ingold et al., 2018; Wenzel et al., 2017). Hence, ACSL4 plays an essential role in PUFA metabolism. Unexpectedly, we have found crosstalk between the ACSL4-mediated PUFA metabolic pathway and the IFNγ signaling pathway in tumor cells. IFNγ targets the promotor region of ACSL4 and transcriptionally stimulates ACSL4 expression in tumor cells. Furthermore, IFNγ alters tumor cell lipidomic pattern in the presence of arachidonic acid via ACSL4. IFNγ increases the total arachidonic acid-associated phospholipid species, particularly C16 and C18 acyl chain-containing phospholipids. This suggests the involvement of C16- and C18-fatty acid associated phospholipids in tumor cell ferroptosis. In line with this possibility, we demonstrate that the common C16- and C18-fatty acids in peripheral blood, such as POA and OA, can enhance tumor ferroptosis initiated by the combination of IFNγ and arachidonic acid via ACSL4, and OA enhances key arachidonic acid-d5 incorporated lipid species of PE and PC in tumor cells. The data indicates that T cells can selectively reprogram lipid metabolism in tumor cells via the IFNγ signaling pathway. Future studies are essential to explore thoroughly the unknown roles and modes of action of many individual fatty acids and their combinations in spontaneous and ICB-associated tumor cell ferroptosis. Along this line, metabolic reprogramming occurs in tumorigenesis (Boroughs and DeBerardinis, 2015) and cancer immunotherapy (Li et al., 2019). Lipid metabolism, including fatty acid and cholesterol metabolism, can affect CD8+ T cell activity and is involved in the regulation of T cell immunity induced by cancer immunotherapy (Ma et al., 2019; Pearce et al., 2009; Yang et al., 2016a; Zhang et al., 2017). Given moderate levels of arachidonic acid in the tumor microenvironment and its role in tumor ferroptosis, we reason that supplementation of arachidonic acid may stimulate tumor ferroptosis in vivo and synergize checkpoint therapy. Indeed, low-dose arachidonic acid administration inhibits growth of multiple murine tumors in vivo in immune competent models - including mouse LLC tumor, an immune checkpoint blockade resistant tumor. Additionally, administration of low-dose arachidonic acid has the ability to enhance the therapeutic efficacy of PD-L1 blockade and elevate the anti-tumor T cell response via the IFNγ signaling pathway. Thus, ICB-triggered IFNγ signaling can cooperate with arachidonic acid to induce and enhance tumor ferroptosis, resulting in effective tumor regression. Thus, targeting arachidonic acid metabolism may be a previously unappreciated approach to synergize with cancer immune checkpoint blockade.
STAR*METHODS
Resource availability
Lead contact
Further information and requests for materials should be directed to the lead contact: Weiping Zou (wzou@med.umich.edu).
Materials availability
This study did not generate new unique reagents.
Data and code availability
Lipidomic raw data and files have been deposited to Mendeley: doi:10.17632/kvp23k439m.1 Gene expression profiles of human cancer tissues were from GSE100797 (Lauss et al., 2017) and PRJEB23709 (Gide et al., 2019).
Experimental model and subject details
Cell lines
Human melanoma cell line A375 (CRL-1619), mouse melanoma cell lines, Yumm5.2 (CRL-3367), B16F10 (CRL-6475) and Lewis lung cancer cell (LLC) (CRL-1642) lines were purchased from the American Type Culture Collection (ATCC, Manassas, VA). Mouse colon cancer cell line MC38 was previously reported (Lin et al., 2018). Tumor cells were maintained in RPMI1640 (HyClone SH30255, GE Healthcare, Chicago, IL) containing 5% (v/v) fetal calf serum (Fcs) (HyClone, SH3007003HI) and 1% (v/v) pen/strep (GIBCO, 15140-122) for 30 generations or more than 3 months before performing experiments. All cell lines in our laboratory are routinely tested for mycoplasma contamination and cells used in this study were negative for mycoplasma. None of our cell lines are on the list of commonly misidentified cell lines (International Cell Line Authentication Committee). Tumor cells were treated with IFNγ (10 ng/ml) and arachidonic acid (AA) (20 μM) for 48-72 hours, unless otherwise specifically described.
To generate OVA-expressing mouse tumor cells, Yumm5.2 cells were transfected with the plasmid pCI-neo-mOVA (Addgene plasmid # 25099) and selected with 1 mg/mL G418 (Thermo Fisher) for 2 weeks.
Mouse CD8+ T cells were isolated from spleen and lymph nodes using EasySep™ Mouse CD8+ T Cell Isolation Kit (Stemcell Technologies, Cambridge, MA), and then stimulated with anti-CD3 (Clone 145-2C11, BD Biosciences, San Jose, CA) and anti-CD28 (Clone 37.51, BD Biosciences) for 3 days. T cell supernatant was collected by centrifugation at 3,000 ×g for 10 minutes and followed by filtration using a 0.2 μM filter.
Animal models
Six- to eight-week-old NOD.SCID γc-deficient (NSG) or C57BL/6 mice were obtained from The Jackson Laboratory. Mice were maintained under pathogen-free conditions. Tumor cells were cultured in the presence of 5% Fes for 30 generations. Yumm5.2 tumor cells (105), MC38 tumor cells (3.5 × 10⁶), B16F10 tumor cells (5 × 10⁴), and LLC tumor cells (105) were subcutaneously injected on the right flank of C57BL/6 mice. On day 6, 100 μg isotype control antibody or 100 μg anti-PD-L1 (Bio X Cell, NH) were peritoneally injected into tumor bearing mice. Tumor diameters were measured using calipers. Tumor volume was calculated as previously described (Peng et al., 2015). On day 6, arachidonic acid (peroxide free) (C20H32O2) (Cayman Chemical, 90010.1) (2 mg/kg) was administered intraperitoneally every three days. All animal studies were conducted under the approval of the University of Michigan Institutional Animal Care and Use Committee (PRO00010169).
METHOD DETAILS
Generation of ACSL4−/− and STAT1−/− tumor cells
ACSL4−/− and STAT1−/− cells were generated with CRISPR technology. Mouse ACSL4 and STAT1 loci were targeted by ACSL4 (Santa Cruz Biotechnology, sc 424503-NIC) and STAT1 (sc-423174-NIC) Double Nickase Plasmids (m) in Yumm5.2, MC38 and B16F10 cells using TurboFect™ (Thermo Fisher Scientific, R0532). 24 hours after transfection, cells were selected with 0.5-3 μg/ml puromycin (Santa Cruz Biotechnology, sc-108071C) for additional 96 hours. Single cell clones were selected and expanded in 96-well plate. Knockout clones were identified by immunoblotting. Multiple clones were pooled for the experiments.
OT-I cell isolation and co-culture with OVA+ tumor cells
C57BL/6-Tg (TcraTcrb) 1100Mjb/J (OT-I) mice were purchased from The Jackson Laboratory. Single spleen cells were suspended in 2 ml Red Blood Cell Lysis Buffer (Sigma-Aldrich) for 1 minute, washed, and resuspended at 2 × 10⁶ cells/ml in RPMI culture medium containing 1 μg/ml OVA257-264 peptide, 5 μg/ml of mouse recombinant IL-2, and 40 μM 2-mercaptoethanol, and then incubated at 37°C for 5 days.
To set up the co-culture of OT-I and OVA+ tumor cells, splenocytes were harvested after 5-day activation. OT-I cells were purified using EasySep™ mouse CD8+ T Cell Isolation Kit (Stemcell technologies). Yumm5.2-OVA cells were seeded overnight. OT-I cells were then added into the culture at different time points. Cells were harvested by trypsinization and analyzed by flow cytometer.
BODIPY-C11 staining
Tumor cells (5000 cells/well) were seeded in 12-well plate and treated with IFNγ (10 ng/ml) or 40% T-cell supernatants, followed with arachidonic acid (AA). Then, cells were harvested by trypsinization for staining. For the co-culture of OVA+ tumor cells and OT-I cells, the mixture was collected and resuspended in 100 μl FACS buffer. Cells were first stained with anti-CD45 (30-F11) and anti-OVA257-264-H2Kb (25-D1.16) antibodies for 10 minutes at room temperature. To perform BODIPY-C11 staining, cells were resuspended in 1 mL Hanks Balanced Salt Solution (HBSS, Gibco 14-025-092), containing 5 μM BODIPY™ 581/591 C11 or BODIPY™ 665/676 and incubated for 15 minutes at 37°C in a tissue culture incubator. Cells were washed and resuspended in 200 μl fresh HBSS and analyzed immediately with a flow cytometer (LSR II, BD Biosciences). For BODIPY 581/591 C11 staining, the signals from both non-oxidized C11 (PE channel) and oxidized C11 (FITC channel) were monitored. The ratio of MFI of FITC to MFI of PE was calculated for each sample. The data were normalized to control samples as shown by relative lipid ROS.
Targeted phospholipid analysis
Acsl4+/+ and Acsl4−/− Yumm5.2 cells were treated with IFNγ (10 ng/ml), arachidonic acid-d5 (10 μM) (Cayman Chemical), or both for 48 hours, collected by trypsinization, and washed with PBS. The cell pellet (107 cells) was re-suspended in 500 μl 25 mM HEPES (pFH 7.4) containing 200 μM DTPA, and lysed by sonication on ice. Then, 500 μl methanol (high performance liquid chromatography, HPLC grade) was added. Samples were immediately frozen and kept at −80 °C. Upon thawing, after addition of an internal standard mix (EquiSplash; Avanti Polar Lipids), lipids were extracted using the Bligh & Dyer method. The organic phase was dried using a SpeedVac concentrator (Thermo Scientific) and resuspended in 100 μL of mobile phase A (hexanes/isopropanol 30:40 v/v) for injection into the liquid chromatography with tandem mass spectrometry (LC-MS/MS) system (Exion LC coupled to Triple Quadrupole 6500+, Sciex). Phospholipids were separated by class upon normal-phase HPLC using a gradient (25 % to 95 %) with mobile phase B (hexanes/isopropanol/water 30:40:7 v/v/v, 5 mM ammonium acetate) on a HILIC column (Kinetex 2.6 μm, 100 Å, 100 ×2 .1 mm; Phenomenex). Ions were analyzed by multiple-reaction monitoring of phospholipid molecular species, containing d0- and-d5-arachidonoyl chains in combination with common acyl chains: 16:0, 16:1, 18:0, 18:1, 18:2, 20:0, 20:2, 20:4, 20:5, 22:0, 22:2, 22:4, 22:5, and 22:6. The m/z transitions monitored were those from the deprotonated molecular negative ion (or the acetate adduct negative ion in the case of phosphatidylcholine species) to the corresponding acyl ion fragments. The chromatographic peaks (ion count vs time) for each analyte and internal standard were integrated using MultiQuant software (Sciex). Analyte relative abundances were calculated as the area ratio of each to the corresponding internal standard in their class.
Quantification of arachidonic acid
Tumor tissues were collected and placed in empty 15 ml conical tubes. Tissues were divided with scissors, wrapped with a 5-μm nylon filter paper (Sterlitech, WA), and stuffed (filter down) into a 1.5 ml conical tube. Tissues were centrifuged at 4,000 r.p.m. for 2 hours (Watson et al., 2021). Interstitial fluid and peripheral blood were used to detect arachidonic acid using an enzyme-linked immunosorbent assay, following the manufacturer’s instructions (Biovision, CA, E4602).
Quantification of prostaglandin E2 (PGE2)
The interstitial fluid from tumor tissues were used to detect PGE2 using an enzyme-linked immunosorbent assay, following the manufacturer’s instructions (Cayman, 500141).
Cell death measurement and immune profiling by FACS
For cell death analysis, cells were treated, collected, initially stained with specific antibodies, then resuspended in PBS containing 1 μg/ml Propidium Iodide (PI) or 7-Aminoactinomycin D (7-AAD)for 15 minutes, and directly run on a flow cytometer. For the co-culture of OVA+ tumor cells and OT-I cells, the mixture was collected and resuspended in 100 μl FACS buffer. Cells were first stained with anti-CD45 (30-F11) antibody for 10 minutes at room temperature, and then resuspended in FACS buffer containing 1 μg/ml PI for 10 minutes and analyzed by flow cytometry.
To quantify T cells and T cell cytokine expression, single-cell suspensions were prepared from fresh tumor tissues. T cells were enriched by density gradient centrifugation. For cytokine staining, T cells were incubated in culture medium containing PMA (5 ng/ml), lonomycin (500 ng/ml), Brefeldin A (1: 1000), and Monensin (1: 1000) at 37°C for 4 hours. Anti-CD90 (53-2.1), anti-CD3 (17A2), anti-CD4 (RM4-5), and anti-CD8 (53-6.7) were added for 20 minutes for surface staining. The cells were then washed and resuspended in 1 ml of freshly prepared Fix/Perm solution (BD Biosciences) at 4°C overnight. After being washed with Perm/Wash buffer (BD Biosciences), the cells were stained with anti-TNF (MP6-XT22), anti-IFNγ (XMG1.2), and anti-granzyme B (16G6) for 30 minutes, washed, and fixed in 4% formaldehyde (Sigma Aldrich, 1004960700). All samples were read on an LSR II cytometer and analyzed with FACS DIVA software v. 8.0 (BD Biosciences).
Cell proliferation and viability assay
Tumor cells were harvested and seeded into 96-well plate. After adhesion, cells were treated with different ferroptosis inducers, inhibitors, or cisplatin. To determine the effect of treatment on cell growth and viability, 10% volume of alamarBlue (Bio-Rad, BUF012B) was directly added into medium and incubated for 4 - 6 hours. Absorbance at wavelengths of 570 nm and 600 nm was measured. The percent difference in reduction between treated and control cells was calculated using the following equation: Percent difference between treatment and control (%)
After calculation, the viability of control cells was 100% and all others were normalized to control and shown as relative cell number (%).
Quantitative PCR analysis
Total RNA was isolated from cells by column purification with Direct-zol RNA Miniprep Kit (R2053, Zymo Research) with DNase treatment. cDNA was synthesized using High-Capacity cDNA Reverse Transcription Kit (Thermo Fisher Scientific) with poly-dT or random hexamer primers. Quantitative PCR (qPCR) was performed on cDNA using Fast SYBR® Green Master Mix (4385618, Thermo Fisher Scientific) on a StepOnePlus™ Real-Time PCR System (Thermo Fisher Scientific). Gene expression was quantified using the following primers:
mouse Acsl4 forward: ATTGGTCAGGGATATGGGCT;
mouse Acsl4 reverse: AGAGGAGCTCCAACTCTTCCA;
mouse Irf1 forward: TCCAAGTCCAGCCGAGACACTA;
mouse Irf1 reverse: ACTGCTGTGGTCATCAGGTAGG;
mouse Stat1 forward: GCCTCTCATTGTCACCGAAGAAC;
mouse Stat1 reverse: TGGCTGACGTTGGAGATCACCA;
mouse Actb forward: AGATCAAGATCATTGCTCCTCCT;
mouse Actb reverse: ACGCAGCTCAGTAACAGTCC;
mouse Gapdh forward: AGGAGAGTGTTTCCTCGTCC;
mouse Gapdh reverse: TGCCGTGAGTGGAGTCATAC;
Fold changes in mRNA expression were calculated by the ΔΔCt method using GAPDH or ACTB as an endogenous control. All fold changes are expressed normalized to the untreated control.
Immunoblotting
Cells were washed in cold PBS and lysed in 1× RIPA lysis buffer (Millipore, R0278) with 1× protease inhibitor cocktail (Roche, 11697498001). Lysates were incubated on ice for 10 minutes and cleared by centrifugation at 15,000 g for 15 minutes. Protein concentration was quantified using a BCA protein assay kit (Thermo Fisher, 23225). 30 μg total protein was mixed with sample buffer (Thermo Fisher, B0007) and denatured at 95 °C for 10 minutes. Sample was separated by SDS-PAGE and transferred to a PVDF membrane (Millipore, IPVH00010). Membranes were blocked with 5% w/v nonfat dry milk and incubated with primary antibodies overnight at 4°C and HRP-conjugated secondary antibodies (Cell Signaling Technology (CST) Danvers, MA) for 2 hours at room temperature. Signal was detected using Clarity and Clarity Max Western ECL Blotting Substrates (Bio-Rad) and captured using ChemiDoc Imaging System (Bio-Rad). Antibodies used were rabbit anti-ACSL4 (1:5000) (Abcam, ab155282), mouse anti-ACSL4 (1:1000) (Santa Cruz, sc-271800), anti-IRF1 (1:2000) (CST, 8478), anti-STAT1(1:1000) (CST, 9175), and anti-β-actin (1:5000) (CST, 5125).
Chromatin immunoprecipitation (ChIP)
ChIP assay was performed according to the SimpleChIP® Enzymatic Chromatin IP Kit (CST, 9003). In brief, Cells were fixed with formaldehyde and lysed, and chromatin was fragmented by partial digestion with Micrococcal Nuclease to obtain chromatin fragments of 1 to 5 nucleosomes. ChIP was performed using antibodies against IRF1 (CST, 8478) and IgG control (CST, 2729), and ChIP-Grade Protein G Magnetic Beads. After reversal of protein-DNA cross-links, the DNA was purified using DNA purification spin columns, ChIP-enriched chromatin was used for real-time PCR. Relative expression levels were normalized to input. Specific primers are listed in the Table S3.
In vitro T cell activation
Splenocytes (106/ml) from C57BL/6J mice were activated with anti-CD3 (eBioscience, 5 μg/ml) and anti-CD28 (eBioscience, 2.5 μg/ml) or other indicated concentration in the presence of 20 μM AA or tumor cell co-culture. The cells were subjected to surface marker and intracellular cytokine staining and analyzed by FACS. In a different setting, splenocytes from OT-I TCR transgenic mice were cultured with OVA loaded dead tumor cells for 3 days.
Mouse T cell isolation
Mouse T cells were isolated from spleen and lymph nodes in tumor-bearing mice. First, the cells are stained with a FITC-anti-mouse CD90 (53-2.1) primary antibody (BD Biosciences). Subsequently, the cells are magnetically labeled with Anti-FITC MicroBeads (Miltenyi Biotec). Then the cell suspension is loaded on a LS Columns (Miltenyi Biotec) which is placed in the magnetic field of a MACS Separator (Miltenyi Biotec). The magnetically labeled cells are retained in the column while the unlabeled cells run through. After removal of the column from the magnetic field, the magnetically retained T cells can be eluted as the positively selected cell fraction. The purity of T cells was more than 90% by FACS analysis.
QUANTIFICATION AND STATISTICAL ANALYSIS
No statistical methods were used to predetermine sample size. For cell-based experiments, biological triplicates were performed in each single experiment in general, unless otherwise stated. Animal experiments were performed in NSG and C57BL/6 mice. Animals were randomized into different groups after tumor cell inoculation; at least 5-9 mice were used for each group, unless otherwise indicated. Animals that failed to develop tumor were excluded from the analysis. Statistical analysis was performed using GraphPad Prism8 software (GraphPad Software, Inc.). Two tailed t-test and Mann-Whitney test were used to compare treatments vs. control groups. ANOVA models were used to compare continuous outcomes across multiple experimental groups, unless otherwise indicated in each figure legend. Survival functions were estimated by Kaplan-Meier methods and log-rank test was used to compare the survival distributions of difference groups.
Supplementary Material
KEY RESOURCES TABLE
| REAGENT or RESOURCE | SOURCE | IDENTIFIER |
|---|---|---|
| Antibodies | ||
| Recombinant Anti-FACL4 antibody [EPR8640] | Abcam | Cat# ab155282, RRID:AB_2714020 |
| Anti-ACSL4 Antibody | Santa Cruz | Cat# sc-271800, RRID:AB_10715092 |
| Stat1 (42H3) Rabbit mAb | Cell Signaling Technology | Cat# 9175, RRID:AB_2197984 |
| IRF-1 (D5E4) XP® Rabbit mAb | Cell Signaling Technology | Cat# 8478, RRID:AB_10949108 |
| β-Actin (13E5) Rabbit mAb | Cell Signaling Technology | Cat# 5125, RRID:AB_1903890 |
| XCT/SLC7A11 Antibody | Cell Signaling Technology | Cat# 98051, RRID:AB_2800296 |
| Normal Rabbit IgG antibody | Cell Signaling Technology | Cat# 2729, RRID:AB_1031062 |
| V500 Rat Anti-Mouse CD45 (30-F11) | BD Bioscience | Cat# 561487; RRID: AB_10697046 |
| FITC Rat Anti-Mouse CD90.2 (53-2.1) | BD Bioscience | Cat# 553003; RRID: AB_394542 |
| Alexa Fluor® 700 Rat Anti-Mouse CD8a (53-6.7) | BD Bioscience | Cat# 557959; RRID: AB_396959 |
| BV786 Rat Anti-Mouse IFNγ (XMG1.2) | BD Bioscience | Cat# 563773; RRID: AB_2738419 |
| PE-Cy™7 Rat Anti-Mouse TNF (MP6-XT22) | BD Bioscience | Cat# 557644; RRID: AB_396761 |
| PE Mouse Anti-Human Granzyme B (GB11) | BD Bioscience | Cat# 561142; RRID: AB_10561690 |
| Armenian hamster Anti-Mouse CD3e (145-2C11) | Thermo Fisher | Cat# 14-0031-82; RRID: AB_467048 |
| Syrian hamster Anti-Mouse CD28 (37.51) | Thermo Fisher | Cat# 14-0281-82; RRID: AB_466413 |
| PE Mouse anti-OVA257-264 (SIINFEKL) peptide bound to H-2Kb (eBio25-D1.16) | Thermo Fisher | Cat# 12-5743-82; RRID: AB_925771 |
| InVivoMAb rat IgG2a isotype control (2A3) | Bio X Cell | Cat# BE0089; RRID: AB_1107769 |
| InVivoPlus Anti-mouse PD-L1 (10F.9G2) | Bio X Cell | Cat# BE0101; RRID: AB_10949073 |
| IFN gamma Monoclonal Antibody (XMG1.2) | Thermo Fisher | Cat# 16-7311-85 |
| TNF alpha Monoclonal Antibody (MP6-XT22) | Thermo Fisher | Cat# 14-7321-81 |
| Rat IgG1 kappa Isotype Control (eBRG1) | Thermo Fisher | Cat# 16-4301-81 |
| Chemicals, peptides, and recombinant proteins | ||
| Formic acid | Sigma-Aldrich | Cat# 695076 |
| Acetic acid | Sigma-Aldrich | Cat# A6283 |
| Propionic acid | Sigma-Aldrich | Cat# P1386 |
| Butyric acid | Sigma-Aldrich | Cat# B103500 |
| Isobutyric acid | Sigma-Aldrich | Cat# I1754 |
| Valeric acid | Sigma-Aldrich | Cat# 240370 |
| Isovaleric acid | Sigma-Aldrich | Cat# 129542 |
| Hexanoic acid | Sigma-Aldrich | Cat# 153745 |
| Octanoic acid | Sigma-Aldrich | Cat# C2875 |
| Decanoic acid | Sigma-Aldrich | Cat# C1875 |
| Arachidonic acid | Cayman Chemical | Cat# 90010 |
| Arachidonic Acid (peroxide free) | Cayman Chemical | Cat# 90010.1 |
| Oleic acid | Cayman Chemical | Cat# 90260 |
| Linoleic Acid | Cayman Chemical | Cat# 90150 |
| γ-linolenic acid | Cayman Chemical | Cat# 90220 |
| Palmitic acid | Cayman Chemical | Cat# 10006627 |
| Elaidic acid | Cayman Chemical | Cat# 90250 |
| Palmitoleic acid | Cayman Chemical | Cat# 10009871 |
| α-linolenic acid | Cayman Chemical | Cat# 90210 |
| Stearic acid | Cayman Chemical | Cat# 10011298 |
| Trans-vaccenic acid | Cayman Chemical | Cat# 15301 |
| Lauric acid | Cayman Chemical | Cat# 10006626 |
| Myristic acid | Cayman Chemical | Cat# 13351 |
| Myristoleic acid | Cayman Chemical | Cat# 9002461 |
| 13(Z)-docosenoic acid | Cayman Chemical | Cat# 90175 |
| Docosanoic acid | Cayman Chemical | Cat# 9000338 |
| Lignoceric acid | Cayman Chemical | Cat# 13353 |
| Hexacosanoic acid | Cayman Chemical | Cat# 13354 |
| Octadecenoic acid | Cayman Chemical | Cat# 20026 |
| Octacosanoic acid | Cayman Chemical | Cat# 31735 |
| Nervonic acid | Cayman Chemical | Cat# 13940 |
| (1S,3R)-RSL3 (RSL3) | Cayman Chemical | Cat# 19288 |
| Erastin | Cayman Chemical | Cat# 17754 |
| Ferrostatin-1 | Cayman Chemical | Cat# 17729 |
| Necrostatin-1 | Cayman Chemical | Cat# 11658 |
| Z-VAD(OH)-fmk | Cayman Chemical | Cat# 14467 |
| cisplatin | Cayman Chemical | Cat# 13119 |
| Rosiglitazone | Cayman Chemical | Cat# 71740 |
| 2-Mercaptoethanol | Sigma-Aldrich | Cat# 63689 |
| Ovalbumin Peptide (257-264) chicken | Sigma-Aldrich | Cat# S7951 |
| Recombinant mouse IFNγ | R&D Systems | Cat# 485-MI |
| BODIPY™ 581/591 C11 (Lipid Peroxidation Sensor) | Thermo Fisher | Cat# D3861 |
| BODIPY™ 665/676 (Lipid Peroxidation Sensor) | Thermo Fisher | Cat# B3932 |
| 7-AAD (7-Aminoactinomycin D) | Thermo Fisher | Cat# A1310 |
| PI (Propidium Iodide) | Thermo Fisher | Cat# P1304MP |
| Deposited data | ||
| Raw and analyzed lipidomic data | This paper | doi:10.17632/kvp23k439m.1 |
| Gene expression profile of patient samples | (Lauss et al., 2017) | GEO dataSets: GSE100797 |
| Gene expression profile of patient samples | (Gide et al., 2019) | ENA: PRJEB23709 |
| Critical commercial assays | ||
| Arachidonic Acid (AA) ELISA Kit | BioVision | Cat# E4602 |
| Prostaglandin E2 (PGE2) Express ELISA Kit | Cayman Chemical | Cat# 500141 |
| SimpleChIP® Enzymatic Chromatin IP Kit (Magnetic Beads) | Cell Signaling Technology | Cat# 9003 |
| Experimental models: Cell lines | ||
| Mouse cell line: YUMM5.2 | ATCC | Cat# CRL-3367 |
| Mouse cell line: B16-F10 | ATCC | Cat# CRL-6475 |
| Mouse cell line: LLC | ATCC | Cat# CRL-1642 |
| Mouse cell line: MC38 | (Lin et al., 2018) | N/A |
| Human cell line: A375 | ATCC | Cat# CRL-1619 |
| Experimental models: Organisms/strains | ||
| Mouse: NOD.SCID γc deficient (NSG) | The Jackson Laboratory | Cat# JAX: 005557 |
| Mouse: C57BL/6J | The Jackson Laboratory | Cat# JAX: 000664 |
| Mouse: OT-I TCR transgenic mice | The Jackson Laboratory | Cat# JAX: 003831 |
| Oligonucleotides | ||
| ChIP-qPCR primers | listed in Table S3 | |
| ACSL4 Double Nickase Plasmid (m) | Santa Cruz | Cat# sc-424503-NIC |
| STAT1 Double Nickase Plasmid (m) | Santa Cruz Biotechnology | Cat# sc-423174-NIC |
| Recombinant DNA | ||
| Acsl4 (NM_207625) Mouse Tagged ORF Clone | Origene™ Technologies | Cat#MR210200 |
| pLV[TetOn]-Puro-TRE3G>mAcsl4[NM_207625.2]/3xFLAG | VectorBuilder | N/A |
| Software and algorithms | ||
| Metabolomics Workbench | (Zabielski et al., 2014) | https://www.metabolomicsworkbench.org/ |
| BD FACSDiva™ Software | BD Bioscience | https://www.bdbiosciences.com/en-us/instruments/research-instruments/research-software/flow-cytometry-acquisition/facsdiva-software |
| Graphpad Prism 8.0 software | GraphPad Software, Inc. | http://www.graphpad.com/scientific-software/prism/ |
| ImageJ | https://imagej.nih.gov/ij/ | |
| Timer 2.0 | (Li et al., 2020) | http://timer.cistrome.org/ |
| TIDE | (Jiang et al., 2018) | http://tide.dfci.harvard.edu/ |
Arachidonic acid and IFNγ coordinately induce tumor cell ferroptosis via ACSL4
ACSL4-dependent tumor ferroptosis is a mode of action of CTLs
ACSL4 mediates immunogenic tumor ferroptosis
Targeting tumor ACSL4 sensitizes checkpoint therapy
ACKNOWLEDGEMENTS
This work was supported in part by U.S. NIH/NCI R01 grants (CA217648, CA123088, CA099985, CA193136, and CA152470) (W.Z) and the NIH through the University of Michigan Rogel Cancer Center Grant (CA46592).
Footnotes
Publisher's Disclaimer: This is a PDF file of an unedited manuscript that has been accepted for publication. As a service to our customers we are providing this early version of the manuscript. The manuscript will undergo copyediting, typesetting, and review of the resulting proof before it is published in its final form. Please note that during the production process errors may be discovered which could affect the content, and all legal disclaimers that apply to the journal pertain.
COMPETING INTEREST DECLARATION
The authors declare no competing interests.
References
- Ayers M, Lunceford J, Nebozhyn M, Murphy E, Loboda A, Kaufman DR, Albright A, Cheng JD, Kang SP, Shankaran V, et al. (2017). IFN-gamma-related mRNA profile predicts clinical response to PD-1 blockade. J Clin Invest 127, 2930–2940. [DOI] [PMC free article] [PubMed] [Google Scholar]
- Bersuker K, Hendricks JM, Li Z, Magtanong L, Ford B, Tang PH, Roberts MA, Tong B, Maimone TJ, Zoncu R, et al. (2019). The CoQ oxidoreductase FSP1 acts parallel to GPX4 to inhibit ferroptosis. Nature 575, 688–692. [DOI] [PMC free article] [PubMed] [Google Scholar]
- Boroughs LK, and DeBerardinis RJ (2015). Metabolic pathways promoting cancer cell survival and growth. Nat Cell Biol 17, 351–359. [DOI] [PMC free article] [PubMed] [Google Scholar]
- Bottcher JP, Bonavita E, Chakravarty P, Blees H, Cabeza-Cabrerizo M, Sammicheli S, Rogers NC, Sahai E, Zelenay S, and Reis e Sousa C (2018). NK Cells Stimulate Recruitment of cDC1 into the Tumor Microenvironment Promoting Cancer Immune Control. Cell 172, 1022–1037 e1014. [DOI] [PMC free article] [PubMed] [Google Scholar]
- Conrad M, and Pratt DA (2019). The chemical basis of ferroptosis. Nat Chem Biol 15, 1137–1147. [DOI] [PubMed] [Google Scholar]
- Consortium EP (2012). An integrated encyclopedia of DNA elements in the human genome. Nature 489, 57–74. [DOI] [PMC free article] [PubMed] [Google Scholar]
- Cua DJ, Sherlock J, Chen Y, Murphy CA, Joyce B, Seymour B, Lucian L, To W, Kwan S, Churakova T, et al. (2003). Interleukin-23 rather than interleukin-12 is the critical cytokine for autoimmune inflammation of the brain. Nature 421, 744–748. [DOI] [PubMed] [Google Scholar]
- Dixon SJ, and Stockwell BR (2019). The Hallmarks of Ferroptosis. Annu Rev Canc Biol 3, 35–54. [Google Scholar]
- Dixon SJ, Winter GE, Musavi LS, Lee ED, Snijder B, Rebsamen M, Superti-Furga G, and Stockwell BR (2015). Human Haploid Cell Genetics Reveals Roles for Lipid Metabolism Genes in Nonapoptotic Cell Death. ACS Chem Biol 10, 1604–1609. [DOI] [PMC free article] [PubMed] [Google Scholar]
- Doll S, Freitas FP, Shah R, Aldrovandi M, da Silva MC, Ingold I, Grocin AG, da Silva TNX, Panzilius E, Scheel CH, et al. (2019). FSP1 is a glutathione-independent ferroptosis suppressor. Nature 575, 693-+. [DOI] [PubMed] [Google Scholar]
- Doll S, Proneth B, Tyurina YY, Panzilius E, Kobayashi S, Ingold I, Irmler M, Beckers J, Aichler M, Walch A, et al. (2017). ACSL4 dictates ferroptosis sensitivity by shaping cellular lipid composition. Nat Chem Biol 13, 91–98. [DOI] [PMC free article] [PubMed] [Google Scholar]
- Farrar MA, and Schreiber RD (1993). The molecular cell biology of interferon-gamma and its receptor. Annu Rev Immunol 11, 571–611. [DOI] [PubMed] [Google Scholar]
- Gide TN, Quek C, Menzies AM, Tasker AT, Shang P, Holst J, Madore J, Lim SY, Velickovic R, Wongchenko M, et al. (2019). Distinct Immune Cell Populations Define Response to Anti-PD-1 Monotherapy and Anti-PD-1/Anti-CTLA-4 Combined Therapy. Cancer Cell 35, 238–255 e236. [DOI] [PubMed] [Google Scholar]
- Golej DL, Askari B, Kramer F, Barnhart S, Vivekanandan-Giri A, Pennathur S, and Bornfeldt KE (2011). Long-chain acyl-CoA synthetase 4 modulates prostaglandin E(2) release from human arterial smooth muscle cells. J Lipid Res 52, 782–793. [DOI] [PMC free article] [PubMed] [Google Scholar]
- Harizi H, Corcuff JB, and Gualde N (2008). Arachidonic-acid-derived eicosanoids: roles in biology and immunopathology. Trends Mol Med 14, 461–469. [DOI] [PubMed] [Google Scholar]
- Hassannia B, Vandenabeele P, and Vanden Berghe T (2019). Targeting Ferroptosis to Iron Out Cancer. Cancer Cell 35, 830–849. [DOI] [PubMed] [Google Scholar]
- Ingold I, Berndt C, Schmitt S, Doll S, Poschmann G, Buday K, Roveri A, Peng X, Porto Freitas F, Seibt T, et al. (2018). Selenium Utilization by GPX4 Is Required to Prevent Hydroperoxide-Induced Ferroptosis. Cell 172, 409–422 e421. [DOI] [PubMed] [Google Scholar]
- Jiang P, Gu S, Pan D, Fu J, Sahu A, Hu X, Li Z, Traugh N, Bu X, Li B, et al. (2018). Signatures of T cell dysfunction and exclusion predict cancer immunotherapy response. Nat Med 24, 1550–1558. [DOI] [PMC free article] [PubMed] [Google Scholar]
- Kagan VE, Mao G, Qu F, Angeli JP, Doll S, Croix CS, Dar HH, Liu B, Tyurin VA, Ritov VB, et al. (2017). Oxidized arachidonic and adrenic PEs navigate cells to ferroptosis. Nat Chem Biol 13, 81–90. [DOI] [PMC free article] [PubMed] [Google Scholar]
- Karki R, Sharma BR, Tuladhar S, Williams EP, Zalduondo L, Samir P, Zheng M, Sundaram B, Banoth B, Malireddi RKS, et al. (2021). Synergism of TNF-alpha and IFN-gamma Triggers Inflammatory Cell Death, Tissue Damage, and Mortality in SARS-CoV-2 Infection and Cytokine Shock Syndromes. Cell 184, 149–168 e117. [DOI] [PMC free article] [PubMed] [Google Scholar]
- Kim JH, Lewin TM, and Coleman RA (2001). Expression and characterization of recombinant rat Acyl-CoA synthetases 1, 4, and 5. Selective inhibition by triacsin C and thiazolidinediones. J Biol Chem 276, 24667–24673. [DOI] [PubMed] [Google Scholar]
- Kraft VAN, Bezjian CT, Pfeiffer S, Ringelstetter L, Muller C, Zandkarimi F, Merl-Pham J, Bao XW, Anastasov N, Kossl J, et al. (2020). GTP Cyclohydrolase 1/Tetrahydrobiopterin Counteract Ferroptosis through Lipid Remodeling. Acs Central Sci 6, 41–53. [DOI] [PMC free article] [PubMed] [Google Scholar]
- Kuwata H, Nakatani E, Shimbara-Matsubayashi S, Ishikawa F, Shibanuma M, Sasaki Y, Yoda E, Nakatani Y, and Hara S (2019). Long-chain acyl-CoA synthetase 4 participates in the formation of highly unsaturated fatty acid-containing phospholipids in murine macrophages. Biochim Biophys Acta Mol Cell Biol Lipids 1864, 1606–1618. [DOI] [PubMed] [Google Scholar]
- Lang X, Green MD, Wang W, Yu J, Choi JE, Jiang L, Liao P, Zhou J, Zhang Q, Dow A, et al. (2019). Radiotherapy and Immunotherapy Promote Tumoral Lipid Oxidation and Ferroptosis via Synergistic Repression of SLC7A11. Cancer Discov 9, 1673–1685. [DOI] [PMC free article] [PubMed] [Google Scholar]
- Lauss M, Donia M, Harbst K, Andersen R, Mitra S, Rosengren F, Salim M, Vallon-Christersson J, Torngren T, Kvist A, et al. (2017). Mutational and putative neoantigen load predict clinical benefit of adoptive T cell therapy in melanoma. Nat Commun 8, 1738. [DOI] [PMC free article] [PubMed] [Google Scholar]
- Li T, Fu J, Zeng Z, Cohen D, Li J, Chen Q, Li B, and Liu XS (2020). TIMER2.0 for analysis of tumor-infiltrating immune cells. Nucleic Acids Res 48, W509–W514. [DOI] [PMC free article] [PubMed] [Google Scholar]
- Li X, Wenes M, Romero P, Huang SC, Fendt SM, and Ho PC (2019). Navigating metabolic pathways to enhance antitumour immunity and immunotherapy. Nat Rev Clin Oncol 16, 425–441. [DOI] [PubMed] [Google Scholar]
- Li Y, Fang M, Zhang J, Wang J, Song Y, Shi J, Li W, Wu G, Ren J, Wang Z, et al. (2016). Hydrogel dual delivered celecoxib and anti-PD-1 synergistically improve antitumor immunity. Oncoimmunology 5, e1074374. [DOI] [PMC free article] [PubMed] [Google Scholar]
- Lin H, Wei S, Hurt EM, Green MD, Zhao L, Vatan L, Szeliga W, Herbst R, Harms PW, Fecher LA, et al. (2018). Host expression of PD-L1 determines efficacy of PD-L1 pathway blockade-mediated tumor regression. J Clin Invest 128, 805–815. [DOI] [PMC free article] [PubMed] [Google Scholar]
- Ma XZ, Bi EG, Lu Y, Su P, Huang CJ, Liu LT, Wang Q, Yang MJ, Kalady MF, Qian JF, et al. (2019). Cholesterol Induces Cd8(+) T Cell Exhaustion in the Tumor Microenvironment. Cell Metab 30, 143-+. [DOI] [PMC free article] [PubMed] [Google Scholar]
- Magtanong L, Ko PJ, To M, Cao JY, Forcina GC, Tarangelo A, Ward CC, Cho K, Patti GJ, Nomura DK, et al. (2019). Exogenous Monounsaturated Fatty Acids Promote a Ferroptosis-Resistant Cell State. Cell Chem Biol 26, 420–432 e429. [DOI] [PMC free article] [PubMed] [Google Scholar]
- Mangan PR, Harrington LE, O’Quinn DB, Helms WS, Bullard DC, Elson CO, Hatton RD, Wahl SM, Schoeb TR, and Weaver CT (2006). Transforming growth factor-beta induces development of the T(H)17 lineage. Nature 441, 231–234. [DOI] [PubMed] [Google Scholar]
- Pearce EL, Walsh MC, Cejas PJ, Harms GM, Shen H, Wang LS, Jones RG, and Choi Y (2009). Enhancing CD8 T-cell memory by modulating fatty acid metabolism. Nature 460, 103–107. [DOI] [PMC free article] [PubMed] [Google Scholar]
- Peng D, Kryczek I, Nagarsheth N, Zhao L, Wei S, Wang W, Sun Y, Zhao E, Vatan L, Szeliga W, et al. (2015). Epigenetic silencing of TH1-type chemokines shapes tumour immunity and immunotherapy. Nature 527, 249–253. [DOI] [PMC free article] [PubMed] [Google Scholar]
- Psychogios N, Hau DD, Peng J, Guo AC, Mandal R, Bouatra S, Sinelnikov I, Krishnamurthy R, Eisner R, Gautam B, et al. (2011). The human serum metabolome. PLoS One 6, e16957. [DOI] [PMC free article] [PubMed] [Google Scholar]
- Reeves AR, Sansbury BE, Pan M, Han X, Spite M, and Greenberg AS (2021). Myeloid-Specific Deficiency of Long-Chain Acyl CoA Synthetase 4 Reduces Inflammation by Remodeling Phospholipids and Reducing Production of Arachidonic Acid-Derived Proinflammatory Lipid Mediators. J Immunol 207, 2744–2753. [DOI] [PMC free article] [PubMed] [Google Scholar]
- Sommerfeld M (1983). Trans unsaturated fatty acids in natural products and processed foods. Prog Lipid Res 22, 221–233. [DOI] [PubMed] [Google Scholar]
- Tallima H, and El Ridi R (2018). Arachidonic acid: Physiological roles and potential health benefits - A review. J Adv Res 11, 33–41. [DOI] [PMC free article] [PubMed] [Google Scholar]
- Voskoboinik I, Whisstock JC, and Trapani JA (2015). Perforin and granzymes: function, dysfunction and human pathology. Nat Rev Immunol 15, 388–400. [DOI] [PubMed] [Google Scholar]
- Wang W, Green M, Choi JE, Gijon M, Kennedy PD, Johnson JK, Liao P, Lang X, Kryczek I, Sell A, et al. (2019). CD8(+) T cells regulate tumour ferroptosis during cancer immunotherapy. Nature 569, 270–274. [DOI] [PMC free article] [PubMed] [Google Scholar]
- Watson MJ, Vignali PDA, Mullett SJ, Overacre-Delgoffe AE, Peralta RM, Grebinoski S, Menk AV, Rittenhouse NL, DePeaux K, Whetstone RD, et al. (2021). Metabolic support of tumour-infiltrating regulatory T cells by lactic acid. Nature 591, 645-+. [DOI] [PMC free article] [PubMed] [Google Scholar]
- Wenzel SE, Tyurina YY, Zhao J, St Croix CM, Dar HH, Mao G, Tyurin VA, Anthonymuthu TS, Kapralov AA, Amoscato AA, et al. (2017). PEBP1 Wardens Ferroptosis by Enabling Lipoxygenase Generation of Lipid Death Signals. Cell 171, 628–641 e626. [DOI] [PMC free article] [PubMed] [Google Scholar]
- Yang W, Bai Y, Xiong Y, Zhang J, Chen S, Zheng X, Meng X, Li L, Wang J, Xu C, et al. (2016a). Potentiating the antitumour response of CD8(+) T cells by modulating cholesterol metabolism. Nature 531, 651–655. [DOI] [PMC free article] [PubMed] [Google Scholar]
- Yang WS, Kim KJ, Gaschler MM, Patel M, Shchepinov MS, and Stockwell BR (2016b). Peroxidation of polyunsaturated fatty acids by lipoxygenases drives ferroptosis. Proc Natl Acad Sci U S A 113, E4966–4975. [DOI] [PMC free article] [PubMed] [Google Scholar]
- Zabielski P, Blachnio-Zabielska A, Lanza IR, Gopala S, Manjunatha S, Jakaitis DR, Persson XM, Gransee J, Klaus KA, Schimke JM, et al. (2014). Impact of insulin deprivation and treatment on sphingolipid distribution in different muscle subcellular compartments of streptozotocin-diabetic C57Bl/6 mice. Am J Physiol Endocrinol Metab 306, E529–542. [DOI] [PMC free article] [PubMed] [Google Scholar]
- Zelenay S, van der Veen AG, Bottcher JP, Snelgrove KJ, Rogers N, Acton SE, Chakravarty P, Girotti MR, Marais R, Quezada SA, et al. (2015). Cyclooxygenase-Dependent Tumor Growth through Evasion of Immunity. Cell 162, 1257–1270. [DOI] [PMC free article] [PubMed] [Google Scholar]
- Zhang Y, Kurupati R, Liu L, Zhou XY, Zhang G, Hudaihed A, Filisio F, Giles-Davis W, Xu X, Karakousis GC, et al. (2017). Enhancing CD8(+) T Cell Fatty Acid Catabolism within a Metabolically Challenging Tumor Microenvironment Increases the Efficacy of Melanoma Immunotherapy. Cancer Cell 32, 377–391 e379. [DOI] [PMC free article] [PubMed] [Google Scholar]
- Zheng Y, Danilenko DM, Valdez P, Kasman I, Eastham-Anderson J, Wu JF, and Ouyang WJ (2007). Interleukin-22, a T(H)17 cytokine, mediates IL-23-induced dermal inflammation and acanthosis. Nature 445, 648–651. [DOI] [PubMed] [Google Scholar]
- Zou YL, Li HX, Graham ET, Deik AA, Eaton JK, Wang WY, Sandoval-Gomez G, Clish CB, Doench JG, and Schreiber SL (2020). Cytochrome P450 oxidoreductase contributes to phospholipid peroxidation in ferroptosis. Nature Chemical Biology 16, 302-+. [DOI] [PMC free article] [PubMed] [Google Scholar]
Associated Data
This section collects any data citations, data availability statements, or supplementary materials included in this article.
Supplementary Materials
Data Availability Statement
Lipidomic raw data and files have been deposited to Mendeley: doi:10.17632/kvp23k439m.1 Gene expression profiles of human cancer tissues were from GSE100797 (Lauss et al., 2017) and PRJEB23709 (Gide et al., 2019).